Fig. 1
Download original image
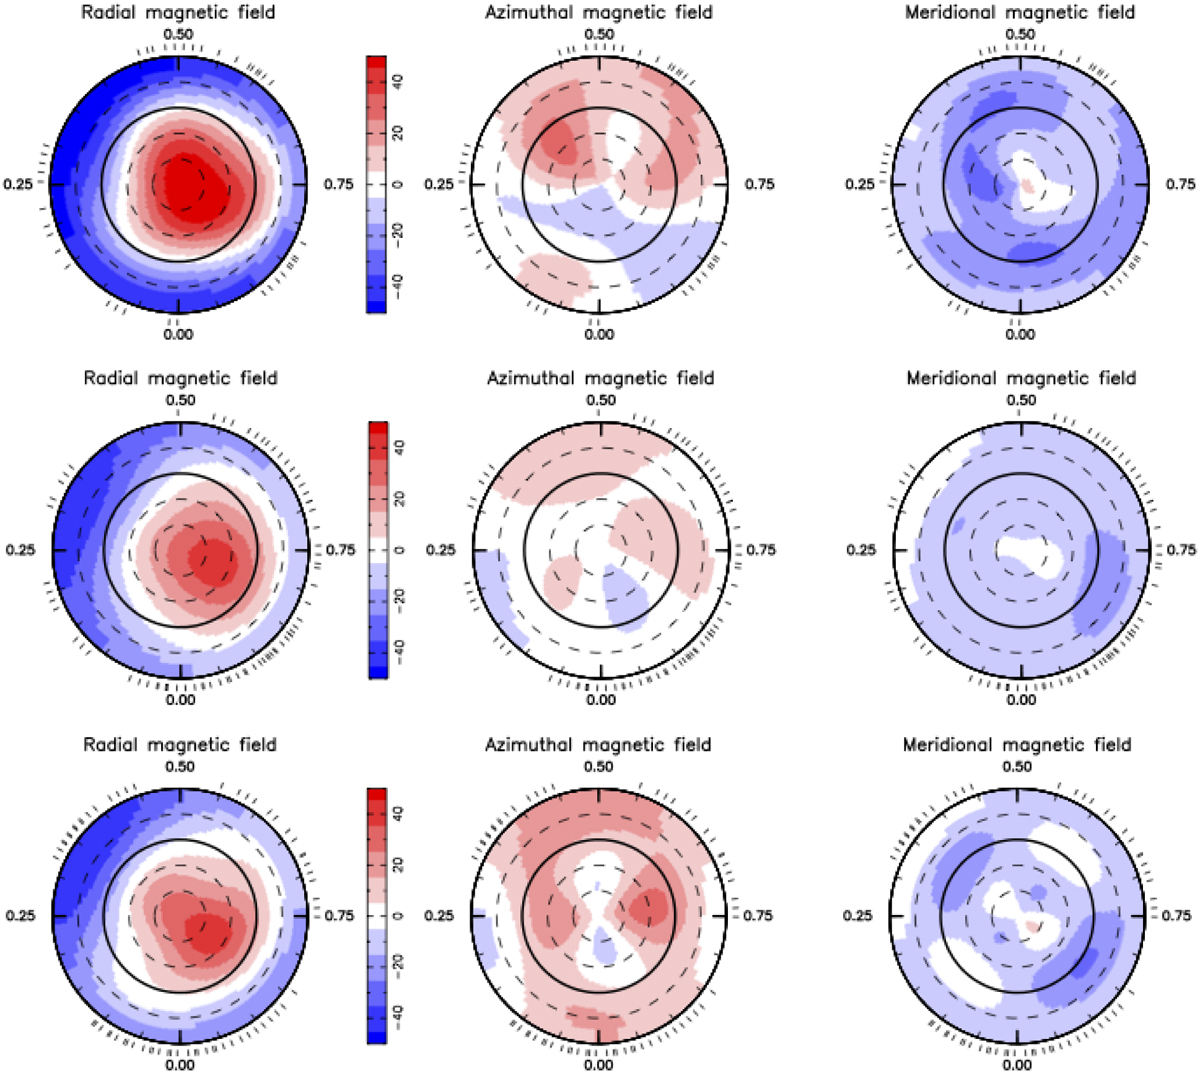
Reconstructed maps of the large-scale field of GJ 3378 in seasons 2019, 2020, and 2021 (from top to bottom). The left, middle, and right columns represent the radial, azimuthal, and meridional field components in spherical coordinates. The colour bar is expressed in Gauss. The maps are shown in a flattened polar projection down to latitude −60° with the pole at the centre and the equator depicted as a bold line. Outer ticks indicate phases of observations, assuming a rotation period of 95.1 days and counting from an arbitrary BJD of 2458745.0.
Current usage metrics show cumulative count of Article Views (full-text article views including HTML views, PDF and ePub downloads, according to the available data) and Abstracts Views on Vision4Press platform.
Data correspond to usage on the plateform after 2015. The current usage metrics is available 48-96 hours after online publication and is updated daily on week days.
Initial download of the metrics may take a while.