Fig. 3
Download original image
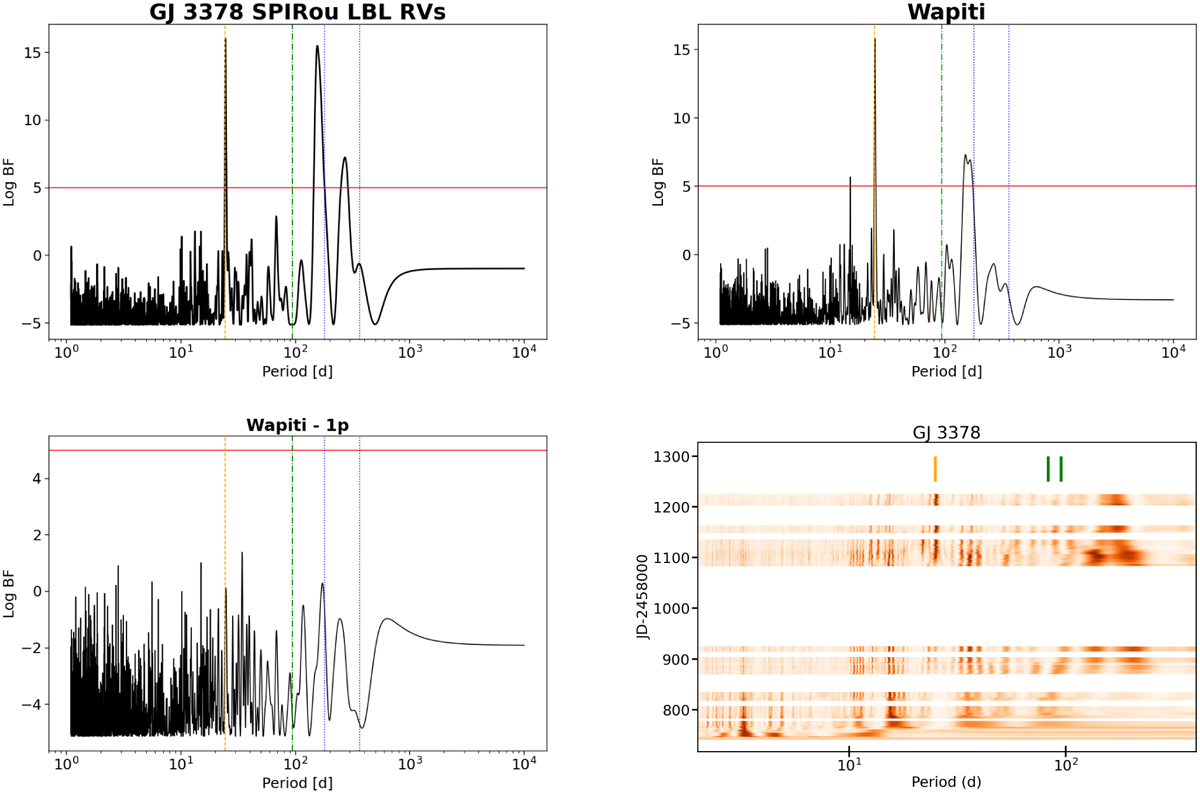
Periodograms of GJ 3378, from top to bottom: SPIRou RVs after pre-cleaning (drift, outlier, and most affected lines removed), wapiti corrected RVs (wPCA corrected), residuals after one planet model is removed, and stacked periodogram. The blue dotted lines show one-year and half-year periods. The green dot-dash line shows the rotation period as measured with the magnetic field proxy. The orange dashed line shows the orbital period, and the red horizontal line shows the detection threshold of logBƒ = 5. On the stacked periodogram, the Y axis corresponds to the time; the orange and green lines show the orbital (24.7 days) and rotational (83–95 days) periods, respectively.
Current usage metrics show cumulative count of Article Views (full-text article views including HTML views, PDF and ePub downloads, according to the available data) and Abstracts Views on Vision4Press platform.
Data correspond to usage on the plateform after 2015. The current usage metrics is available 48-96 hours after online publication and is updated daily on week days.
Initial download of the metrics may take a while.