Fig. A.1
Download original image
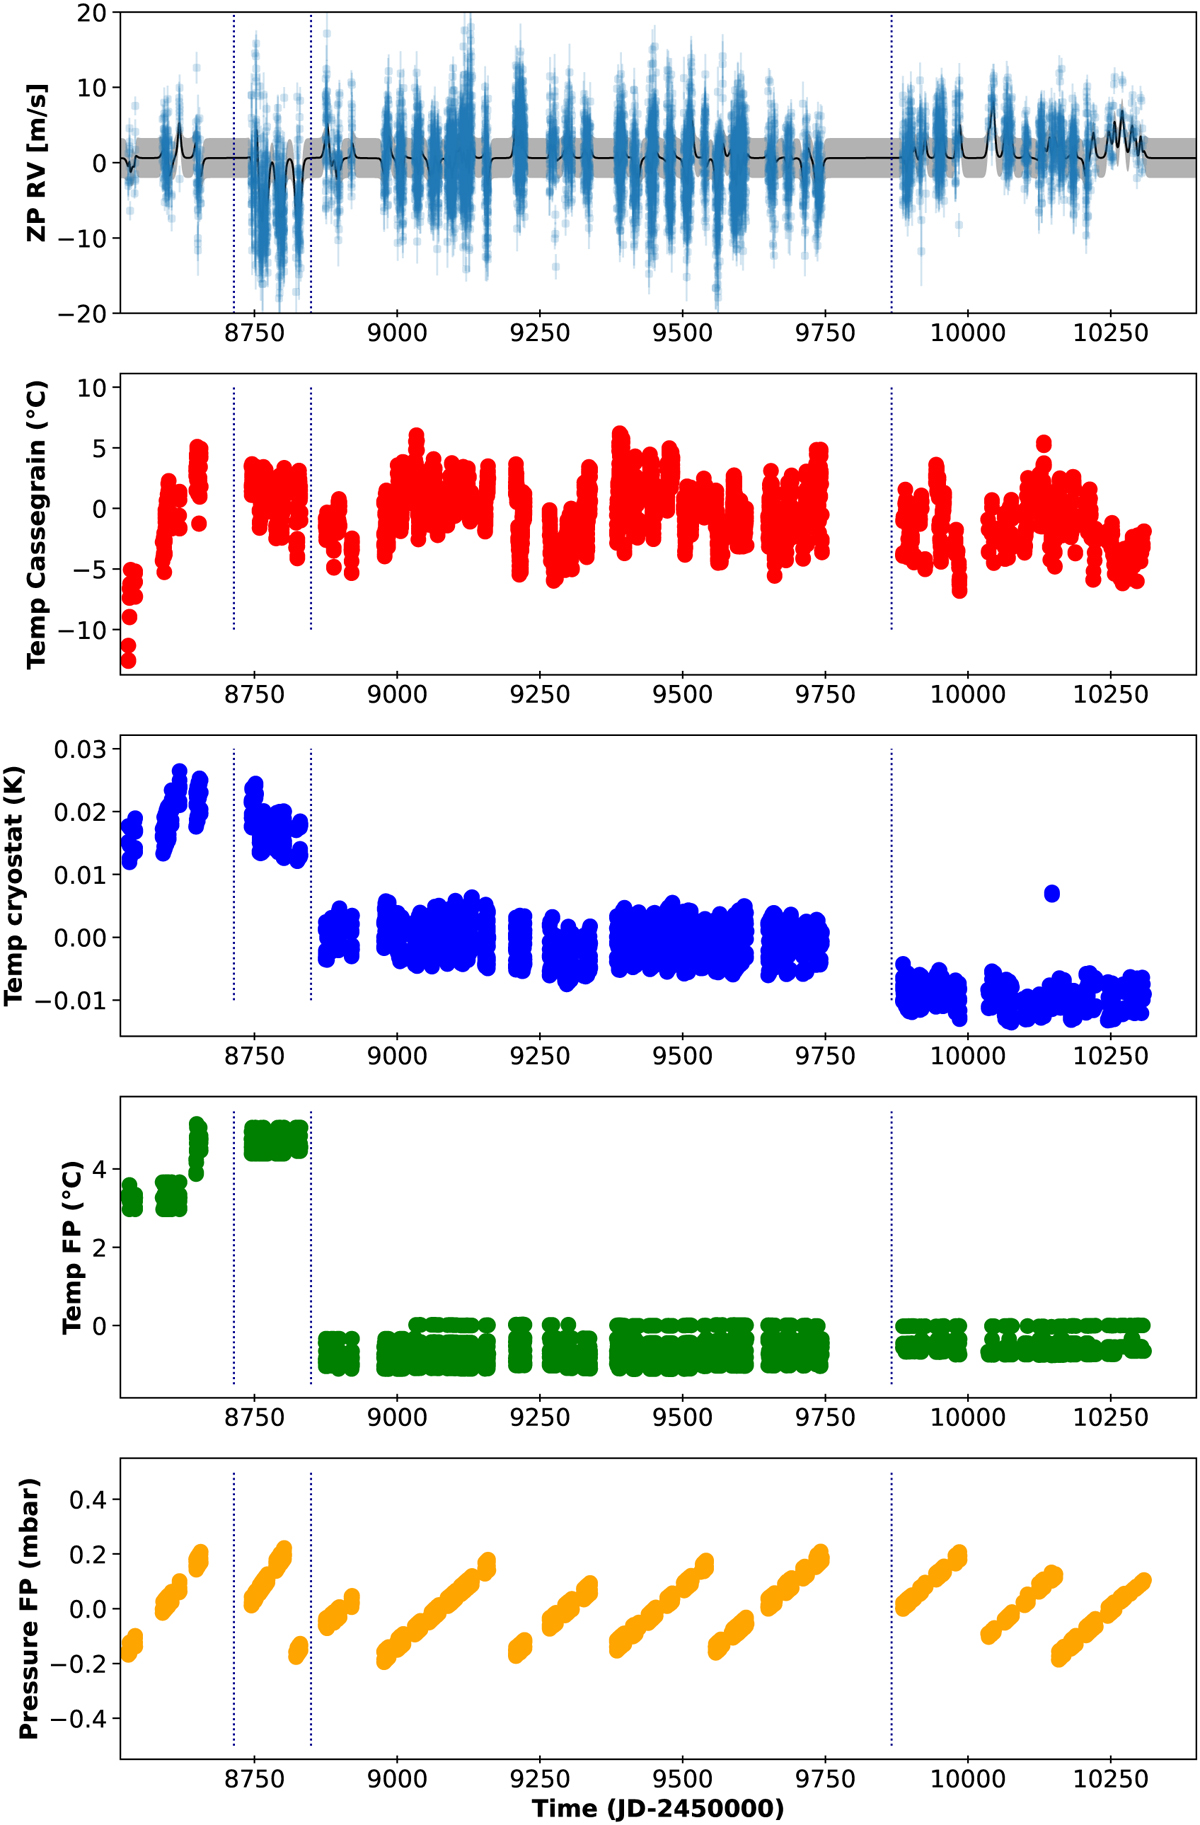
Zero-point RV variations of SPIRou Legacy Survey data obtained with 19 RV-quiet stars (top) as function of time, as well as the evolution of a few ancillary data, from top to bottom: temperature of injection at Cassegrain, temperature of the cryostat, temperature of the Fabry-Pérot set point, and pressure of the Fabry-Pérot cavity (with its pumping cycle). The vertical lines show the start point of new thermal cycles. On the top plot, a Gaussian Process modeling has been applied and is used to correct for any other epoch in a continuous way.
Current usage metrics show cumulative count of Article Views (full-text article views including HTML views, PDF and ePub downloads, according to the available data) and Abstracts Views on Vision4Press platform.
Data correspond to usage on the plateform after 2015. The current usage metrics is available 48-96 hours after online publication and is updated daily on week days.
Initial download of the metrics may take a while.