| Issue |
A&A
Volume 686, June 2024
|
|
|---|---|---|
| Article Number | A229 | |
| Number of page(s) | 8 | |
| Section | Extragalactic astronomy | |
| DOI | https://doi.org/10.1051/0004-6361/202348763 | |
| Published online | 14 June 2024 | |
Probing star formation rates and histories in AGN and non-AGN galaxies across diverse cosmic environments and X-ray luminosity ranges
1
Instituto de Fisica de Cantabria (CSIC-Universidad de Cantabria), Avenida de los Castros, 39005 Santander, Spain
e-mail: gmountrichas@gmail.com
2
Institute of Space Sciences (ICE, CSIC), Campus UAB, Carrerde Can Magrans s/n, 08193 Barcelona, Spain
3
INAF – Osservatorio di Astrofisica e Scienza dello Spazio di Bologna, via Gobetti 93/3, 40129 Bologna, Italy
Received:
28
November
2023
Accepted:
3
April
2024
In this work, we compare the star formation rates (SFRs) and star formation histories (SFHs) of active galactic nucleus (AGN) and non-AGN galaxies. We explore these aspects across different density fields and over three orders of magnitude in X-ray luminosity (LX). For that purpose, we employed X-ray AGNs detected in the XMM-XXL field and constructed a galaxy control sample, using sources from the VIPERS catalogue. We applied strict photometric and quality selection criteria to ensure that only sources with robust (host) galaxy measurements were included in the analysis. Our final samples consist of 149 X-ray AGNs with 42 < log,[LX,2#x2212;10 keV (erg s−1)] < 45 and 3488 non-AGN systems. The sources span a redshift range of 0.5 < z < 1.0 and have stellar masses within, 10.5 < log [M*(M⊙)] < 11.5. For these systems, we adopted the available measurements for their local densities and their spectral lines (Dn4000) from the VIPERS catalogue. To compare the SFRs of these two populations, we calculated the SFRnorm parameter. The latter is defined as the ratio of the SFRs of AGNs to the SFRs of non-AGN galaxies with similar M* and redshift. Our findings reveal that low- and moderate-LX AGNs (42 < log,[LX,2#x2212;10 keV (erg s−1)] < 44) that reside in low-density fields have a nearly flat SFRnorm-LX relation. In contrast, the AGNs of similar LX values that reside in high-density environments present an increase in SFRnorm with LX. These results are in line with previous studies. Notably, our results suggest that the most luminous of the AGNs (log,[LX,2#x2212;10 keV (erg s−1)] > 44) exhibit an increased SFR in comparison to non-AGN galaxies. This trend appears to be independent of the density of the environment. Furthermore, for AGNs with similar LX, those in high-density regions tend to have higher SFRnorm values compared to their counterparts in low-density areas. Comparisons of the Dn4000 spectral index, which serves as a proxy for the age of the stellar population, reveals that low- and moderate-LX AGNs reside in galaxies with comparable stellar populations with non-AGN systems, regardless of the density field they are situated in. However, the most luminous X-ray sources tend to reside in galaxies that have younger stellar populations, as compared to non-AGN galaxies, regardless of the galaxy’s environment.
Key words: galaxies: active / galaxies: evolution / galaxies: nuclei / quasars: general / galaxies: star formation / X-rays: general
© The Authors 2024
 Open Access article, published by EDP Sciences, under the terms of the Creative Commons Attribution License (https://creativecommons.org/licenses/by/4.0), which permits unrestricted use, distribution, and reproduction in any medium, provided the original work is properly cited.
This article is published in open access under the Subscribe to Open model. Subscribe to A&A to support open access publication.
1. Introduction
In the last couple of decades, there has been significant advancement in our comprehension of the formation and growth of supermassive black holes (SMBHs) throughout cosmic history. Black holes increase in size through the accretion of cold gas onto their accretion disks. This gas originates from regions at least nine orders of magnitude larger in scale, either within the host galaxy or from the broader extragalactic environment (e.g. Alexander & Hickox 2012). During this accretion phase, the SMBH becomes active, transforming the galaxy into an active galactic nucleus (AGN). Simultaneously, star formation is driven by cold gas. Notably, AGN activity and star formation tend to reach their peaks during the same cosmic era (at z ∼ 2; e.g. Boyle & Terlevich 1998; Sobral et al. 2013; Madau & Dickinson 2014). These alignments strongly suggest a connection between SMBH activity and the growth of galaxies.
To explore this connection, numerous previous studies have examined the potential correlation between X-ray luminosity (LX), which serves as a proxy for the accretion power of SMBHs, and the star formation rate (SFR) within the host galaxy. While not all research findings concur, the overall consensus suggests that the relationship between SFR and LX is notably impacted by the specific range of LX and stellar mass (M*) that is under consideration (e.g. Mountrichas et al. 2024a; Cristello et al. 2024).
In particular, results from recent studies seem to suggest that in galaxies with 10.5 < log [M*(M⊙)] < 11.5 hosting luminous AGNs (log,[LX,2#x2212;10 keV (erg s−1)] > 44), the SFR is elevated compared to galaxies without an AGN. On the contrary, galaxies that host low- and moderate-LX AGNs (42 < log,[LX,2#x2212;10 keV (erg s−1)] < 44) appear to have lower (or at most equal) SFRd to non-AGN galaxies, with similar M* and redshift (Mountrichas et al. 2021b, 2022c,a). Notably, a recent work by Mountrichas et al. (2024a) extended these findings to both lower (log [M*(M⊙)] < 10.5) and higher (log [M*(M⊙)] > 11.5) stellar mass regimes. However, the threshold LX for observing this elevated SFR appears to increase as we transition from less to more massive galaxies.
These observations hint at the possibility that distinct physical mechanisms may drive AGN activity in varying mass and/or luminosity regimes. As a diverse population, AGNs are subject to different triggering processes, as indicated by both observational studies (e.g. Allevato et al. 2011; Mountrichas et al. 2013, 2016) and theoretical models (e.g. Fanidakis et al. 2012, 2013). Various AGN triggering mechanisms may dominate, depending on factors such as the redshift, LX, and the mass of the source. One plausible mechanism linking star formation with AGN activity involves galaxy mergers (e.g. Hopkins et al. 2008). This scenario posits that a fraction of the cold gas available for star formation in galaxies accretes onto the SMBH, activating an AGN. In higher mass systems, alternative mechanisms decoupled from the host galaxy’s star formation may fuel the SMBH. For instance, the SMBH might be activated when diffuse hot gas in quasi-hydrostatic equilibrium accretes onto the SMBH without first cooling onto the galactic disc. Semi-analytic models suggest that this mechanism becomes dominant in very massive systems (e.g. Fanidakis et al. 2013). Importantly, this framework implies that any observed correlation between AGN activity and SFR is a consequence of a shared mechanism influencing both properties. In other words, there may not be an inherent, direct connection between the two parameters.
Earlier investigations that examined the correlation between SFR and LX (e.g. Masoura et al. 2018; Bernhard et al. 2019; Florez et al. 2020; Mountrichas et al. 2022c) have not delved into the influence of the cosmic environment on the SFR-LX relationship. In the case of galaxies (i.e. non-AGN systems), this aspect has been the focus of extensive research both in the local Universe and at higher redshifts (e.g. Elbaz et al. 2007; Scoville et al. 2013; Lin et al. 2014; Erfanianfar et al. 2016; Cooke et al. 2023). However, these investigations typically do not consider the activity of the SMBH, meaning they do not distinguish between systems with AGNs and those without. In a recent study, Mountrichas et al. (2023) compared the SFR of AGNs and non-AGN galaxies, in different density fields (and for different morphologies). Their research utilised sources in the COSMOS field, probing a redshift range of 0.3 < z < 1.2 and their M* fell within 10.5 < log [M*(M⊙)] < 11.5. Their results showed that AGNs in low-density environments have lower SFRs compared to non-AGN systems. Conversely, in higher density fields, the SFRs of AGNs become equivalent or even surpass those of non-AGN galaxies, particularly in cases with elevated LX (43 < log[LX,2#x2212;10 keV (erg s−1)] < 44). Furthermore, by employing two spectral indices which are commonly used as indicators of stellar population ages (i.e. Dn4000 and Hδ), the study revealed that low-LX AGNs (log[LX,2#x2212;10 keV (erg s−1)] < 43) have consistent stellar populations in all cosmic environments, while moderate-LX AGNs (43 < log[LX,2#x2212;10 keV (erg s−1)] < 44) tend to have younger stars and are more likely to have undergone a recent burst in high-density fields. Non-AGN galaxies, on the other hand, tend to exhibit older stellar populations and were less prone to having undergone recent episodes of star formation in denser environments when compared to their isolated counterparts. Moreover, based on their analysis, bulge-dominated (BD) AGNs were scarse in denser environments; whereas in the case of non-AGN galaxies, the fraction of BD systems increases with the rising density field.
These findings may suggest that in dense environments, AGN feedback counteracts gas removal, preventing the quenching of star formation, a phenomenon known as positive feedback (e.g. Zinn et al. 2013; Santoro et al. 2016; Meenakshi et al. 2022). The more active the AGN (higher LX), the more effective the AGN feedback becomes. However, as mentioned earlier, an alternative interpretation could be that a shared mechanism, such as a galaxy merger, can be fueling both star formation and the SMBH, thereby triggering both processes simultaneously. This perspective aligns with the observed variations in morphological types between AGNs and non-AGN systems in different environments, hinting at galaxy interactions as triggers for both phenomena. Moreover, the scarcity of BD galaxies in AGN-hosting systems within dense fields may indicate interactions that prompt both star formation and AGN activity. Finally, the lower SFRs observed in galaxies hosting AGNs, compared to non-AGN systems in low-density fields, could be attributed to a limited availability of gas in these environments. For example, Zubovas et al. (2013) demonstrated that in galaxies undergoing a gas-poor phase, AGN feedback might quench the star formation process. It is important to note, however, that a limitation of the Mountrichas et al. (2023) study was the absence of the most luminous AGNs, specifically those with X-ray luminosities exceeding log[LX,2#x2212;10 keV (erg s−1)] > 44.
In this study, we employ X-ray AGNs detected in the XMM-XXL field and galaxies from the VIPERS catalogue, to compare the SFRs and star formation histories (SFHs) of the two populations, in different density fields and across three orders of magnitude in LX. Our goal is to leverage the broader range of high X-ray luminosities probed by the AGNs included in the XMM-XXL dataset, thus expanding the scope of these inquiries to encompass higher X-ray luminosity levels compared to the work of Mountrichas et al. (2023). The structure of the paper is as follows. In Sect. 2, we provide an overview of the data we utilise for our investigations. In Sect. 3, we describe the spectral energy distribution (SED) fitting analysis we perform and outline how we obtain information on the SFH and the local densities of the sources. We also describe the various photometric and quality selection criteria we apply in our work. The results of our analysis are presented in Sect. 4. Finally, Sect. 5 offers a summary of our key findings.
2. Data
We utilised two distinct samples. The first dataset comprises X-ray-detected AGNs, while the second one incorporates data from optical spectra measurements for over 90 000 galaxies. Below, we present details about these two datasets.
2.1. The X-ray dataset
The X-ray sample consists of X-ray AGNs detected in the northern field of the XMM-Newton-XXL survey (XMM-XXL; Pierre et al. 2016). XMM-XXL is a medium-depth X-ray survey that covers a total area of 50 deg2 split into two fields nearly equal in size: the XMM-XXL North (XXL-N) and the XXM-XXL South (XXL-S). Furthermore, it is the largest XMM-Newton project approved to date (> 6 Ms) with median exposure at 10.4 ks and a depth of ∼6 × 10⁻¹⁵ erg s−1 cm−2 for point sources, in the 0.5–2 keV band. In this study, we use the XXL-N sample that consists of 14 168 sources. To identify the X-ray detections at other wavelengths the X-ray counterparts have been cross-matched with optical, NIR, and MIR surveys (for more details, see Chiappetti et al. 2018).
2.2. The galaxy control sample
The galaxy control sample used in this work comes from the public data release 2 (PDR-2; Scodeggio 2018) of the VIPERS survey (Guzzo et al. 2014; Garilli et al. 2014), which partially overlaps with the XMM-XXL field. The observations were carried out using the VIMOS (VIsible MultiObject Spectrograph, Le Fèvre et al. 2003) on the ESO Very Large Telescope (VLT). The survey covers an area of ≈23.5 deg2, split over two regions within the Canada-France- Hawaii Telescope Legacy Survey (CFHTLS-Wide) W1 and W4 fields. Follow-up spectroscopic targets were selected to the magnitude limit i′ = 22.5 from the T0006 data release of the CFHTLS catalogues. An optical colour-colour pre-selection, namely, [(r − i) > 0.5(u − g) or (r − i) > 0.7], excludes galaxies at z < 0.5, yielding a > 98% completeness for z > 0.5 and up to z ∼ 1.2 (for more details see Guzzo et al. 2014). Then, PDR-2 consists of 86 775 galaxies with available spectra. Each spectrum is assigned a quality flag that quantifies the redshift reliability. In all the VIPERS papers, redshifts with flags in the range between 2 and 9 have been considered to be reliable and are those used in the science analysis (Garilli et al. 2014; Scodeggio 2018). The above criteria yield 45 180 galaxies within the redshift range spanned by the VIPERS survey (0.5 < z < 1.2).
The process of adding multiwavength photometry to the galaxy sample is described in detail in Sect. 2.1 in Mountrichas et al. (2019; see also Mountrichas & Buat 2023). In brief, the VIPERS galaxy catalogue was cross-matched with sources in the VISTA Hemisphere Survey (VHS, McMahon et al. 2013) and the AllWISE catalogue from the WISE survey (Wright et al. 2010), using the xmatch tool from the astromatch1 package. The process is described in detail in Sect. 2.5 in Pouliasis et al. (2020). Furthermore, xmatch matches a set of catalogues and gives the Bayesian probabilities of the associations or non-association (Pineau et al. 2017). We only retained sources with a high probability of association (> 68%). When one source was associated with several counterparts, we selected the association with the highest probability. 14 128 galaxies from the VIPERS catalogue have counterparts in the near- (VISTA) and mid- (WISE) infrared parts of the electromagnetic spectrum.
3. Galaxy properties
In this section, we describe how we obtain information about the properties of the sources used in our analysis. Specifically, we describe how we measured the SFR and M* values for the AGNs and non-AGN galaxies in our sample, and how we obtained knowledge on their stellar populations.
3.1. Calculation of SFR and M*
The (host) galaxy properties of both the X-ray AGNs and the galaxies in the control sample have been calculated via a spectral energy distribuion (SED) fitting, using the CIGALE code (Boquien et al. 2019; Yang et al. 2020, 2022). The SED fitting analysis is described in detail, for instance, in Section 3.1 in Mountrichas et al. (2021a, 2022c,a, 2023). In brief, the galaxy component is modelled using a delayed SFH model with a function form SFR ∝ t × exp(−t/τ). A star formation burst is included (Ciesla et al. 2017; Małek et al. 2018; Buat et al. 2019) as a constant ongoing period of star formation of 50 Myr. Stellar emission is modelled using the single stellar population templates of Bruzual & Charlot (2003) and is attenuated following the Charlot & Fall (2000) attenuation law. To model the nebular emission, CIGALE adopts the nebular templates based on Inoue (2011). The emission of the dust heated by stars is modelled based on Dale et al. (2014), without any AGN contribution. The AGN emission is included using the SKIRTOR models of Stalevski et al. (2012, 2016). CIGALE has the ability to model the X-ray emission of galaxies. In the SED fitting process, the observed LX in the 2 − 10 keV band are used, provided by the Marchesi et al. (2016). The applied parameter space is shown in Table 1 in Mountrichas et al. (2022c). The reliability of the SFR measurements, both in the case of AGNs and non-AGN systems, has been examined in detail in our previous works and, in particular, in Sect. 3.2.2 in Mountrichas et al. (2022c). For instance, using CIGALE’s ability to create and analyse mock catalogues based on the best-fit model of each source of the dataset, the effect of the (lack of) far-infrared (Herschel) and ultraviolet photometry has been investigated, among others. Furthermore, consistent SFR measurements have been obtained via SED fitting analysis and those derived from the OII λ3726 line (e.g. Siudek et al. 2023b).
3.2. Star formation history
The VIPERS catalog offers insights into the stellar populations of the galaxies it encompasses, focusing on the measurement of the Dn4000 spectral index. Dn4000 tends to be low for younger stellar populations and high for older, metal-rich galaxies, as demonstrated by previous studies (e.g. Kauffmann et al. 2003). The narrow definition of the Dn4000 spectral indicator presented in Balogh et al. (1999) has been adopted (Siudek et al. 2017). The equivalent width of the Hδ spectral line also provides important information for the stellar population of a galaxy, as it rises rapidly in the first few hundred million years after a burst of star formation, when O- and B-type stars dominate the spectrum; it then decreases when A-type stars fade (e.g. Kauffmann et al. 2003; Wu et al. 2018). However, Hδ is particularly sensitive to the spectral resolution of the spectra and due to the resolution of VIPERS, these spectra could not be measured (Siudek et al. 2017). Therefore, in this study we make use of the available Dn4000 measurements of the VIPERS catalogue to examine the stellar populations of the AGNs and non-AGN systems included in our datasets.
3.3. Local densities
The main goal of this work is to study the star formation rates and histories of AGNs and non-AGN galaxies, across different density fields. The VIPERS galaxy catalogue includes information on the local densities of the sources. Their calculation is described in Cucciati et al. (2014, 2017), Siudek et al. (2022, 2023a). In brief, the local environment is characterised by the density contrast, δ, smoothed over a cylinder with a radius equal to the distance of the fifth nearest neighbour (Cucciati et al. 2017), taking into account the local density and the mean density at each redshift. The mean density is estimated using all galaxies (both spectroscopic and photometric) that trace the density field within a cylindrical top-hat filter. The tracers are selected either by applying a cut MB ≤ (20.4 − z), that provides complete tracer samples up to z < 0.9 or are extended out to z = 1 using even brighter tracers. In our analysis, we use overdensities calculated with tracers up z = 1, since it increases our sample size by ∼10%. However, we confirm that our results and overall conclusions are not sensitive to this choice.
3.4. Selection criteria and final samples
In this section, we outline the criteria we applied when assembling the final dataset of X-ray sources, drawn from the XMM-XXL catalogue (Sect. 2.1), and the final control sample of non-AGN galaxies, extracted from the VIPERS survey (Sect. 2.2).
3.4.1. The final X-ray sample
To gain information about the environments the X-ray AGNs reside in, we cross-matched the XXM-XXL dataset with the VIPERS sample. This results in 940 sources. In our analysis, we need to use only systems with the most reliable M* and SFR calculations. For that purpose, we required the AGNs to have measurements in the optical, near-infrared (J, H, K) and mid-infrared (W1, W2, W4) part of the spectrum (see Sect. 2.1). This criterion is met by 555 X-ray sources. Furthermore, to exclude systems with bad SED fits and unreliable host galaxy measurements, we imposed a reduced χ2 threshold of  (e.g. Masoura et al. 2018; Buat et al. 2021). We also excluded sources for which CIGALE could not constrain the parameters of interest (SFR, M*), by following the criteria applied in prior studies (e.g. Mountrichas et al. 2021a; Koutoulidis et al. 2022; Garofalo & Mountrichas 2022; Pouliasis et al. 2022; Mountrichas & Shankar 2023; Mountrichas 2023; Mountrichas & Buat 2023). Specifically, we utilised the two values that CIGALE estimates for each calculated galaxy property. One value corresponds to the best model and the other value (Bayes) is the likelihood-weighted mean value. A large difference between the two calculations suggests a complex likelihood distribution and important uncertainties. We therefore only include in our analysis sources with
  and
and  , where SFRbest and M∗,best are the best-fit values of SFR and M*, respectively and SFRbayes and M∗,bayes are the Bayesian values estimated by CIGALE. There are 455 AGNs that fulfill these requirements. Out of these 455 X-ray sources, 174 have information about their density field (DENSITY > −90) and meet the following criterion, DENSITY_MASK ≥ 0.6. The latter requirement reassures that at least 60% of the cylinder volume overlaps with the VIPERS survey footprint (for more details, see Davidzon et al. 2016; Cucciati et al. 2017).
Prior investigations have emphasised the significance of M* in the comparative analysis of SFR between galaxies hosting an AGN and those without (e.g. Mountrichas et al. 2021b, 2022c,b, 2024a). Specifically, these earlier studies suggested that the LX threshold at which AGN-hosting systems exhibit elevated SFR increases with the mass of the galaxy (Mountrichas et al. 2024a). This threshold appears to differ across different stellar mass ranges, namely log [M(M⊙)] < 10.5, 10.5 < log [M*(M⊙)] < 11.5, and log [M*(M⊙)] > 11.5. Consequently, we confine our X-ray dataset to galaxies within the range 10.5 < log [M*(M⊙)] < 11.5, resulting in a selection of 149 AGNs meeting this criterion. These X-ray sources cover a redshift span of 0.5 < z < 1.0 and exhibit X-ray luminosities within 42 < log[LX,2#x2212;10 keV (erg s−1)] < 45, as illustrated in Fig. 1. It is noteworthy that within this specified M* range, both our X-ray dataset and the galaxy control sample achieve completeness in terms of mass (Davidzon et al. 2013; Mountrichas & Shankar 2023).
 |
Fig. 1. Distribution of the 149 X-ray AGNs used in our analysis, in the LX-redshift plane. |
3.4.2. The final galaxy control sample
We applied the same photometric, quality, and M* criteria (described in Sect. 3.4.1) to the galaxy control sample. Furthermore, we excluded X-ray sources that are included in the XMM-XXL catalogue and systems with a significant AGN component, revealed by the SED fitting process. Specifically, we use the CIGALE measurements and exclude sources that have AGN fraction, fracAGN > 0.2 (e.g. Mountrichas et al. 2021b, 2022c,a). The fracAGN is defined as the fraction of the total IR emission originating from the AGN. This criterion excludes ∼60% of the sources in the galaxy control sample, in line with prior studies (e.g. Georgakakis et al. 2017; Salerno et al. 2019; Mountrichas et al. 2022a). There are 3488 galaxies that meet these requirements. Their distribution in the SFR-M* plane is presented in Fig. 2.
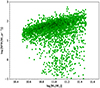 |
Fig. 2. Distribution of galaxies in the control sample, in the SFR-M* plane. |
4. Results
In this section, we examine how the SFRs of AGNs and non-AGN galaxies differs as a function of the LX, across different cosmic environments. Furthermore, we investigate the SFH of these two populations for different density fields.
4.1. Comparison of the SFRs of AGNs and non-AGN galaxies, as a function of LX and the cosmic environment
To conduct a comparative analysis of the SFR of AGNs and non-AGN galaxies, we utilised the SFRnorm parameter (e.g. Mullaney et al. 2015; Masoura et al. 2018; Bernhard et al. 2019). SFRnorm is defined as the ratio of the SFRs of galaxies that host AGN to the SFRs of non-AGN systems with similar M* and redshift. Mountrichas et al. (2021a) showed that systematic biases may affect the measurement of SFRnorm, when analytical expressions from the literature are employed to estimate the SFRs of non-AGN galaxies (e.g. Schreiber et al. 2015), subsequently impacting the accuracy of SFRnorm measurements. To mitigate these systematic effects it is preferable to use a galaxy control sample of non-AGN sources. Therefore, to measure SFRnorm, we used the X-ray and galaxy control samples described in Sect. 2 and followed the process described in previous studies (e.g. Mountrichas et al. 2021b, 2022c,a; Mountrichas & Buat 2023).
Specifically, for the calculation of SFRnorm, the SFR of each X-ray AGN is divided by the SFRs of galaxies in the control sample that are within ±0.2 dex in M*, ±0.075 × (1 + z) in redshift and are in similar density fields. Furthermore, each source is weighted based on the uncertainty of the SFR and M* measurements made by CIGALE. Then, the median values of these ratios are used as the SFRnorm of each X-ray AGNs. We note that our measurements are not sensitive to the choice of the box size around the AGNs. Selecting smaller boxes, however, has an effect on the errors of the calculations (Mountrichas et al. 2021b).
To classify sources into density fields, we rely on the overdensity values of the galaxy control sample. We designate sources in ‘high-density fields’ as those with overdensity values falling within the top 30% of the galaxy sample, while sources with overdensity values within the bottom 30% are classified as ‘low-density field’ sources. Specifically, sources in the high-density field group exhibit log(1 + δ) > 0.57, while those in the low-density field group have log(1 + δ) < 0.18. Among these, there are 43 AGNs and 1047 non-AGN galaxies in low-density fields, as well as 46 AGNs and 1047 non-AGN galaxies in high-density fields. This underscores the diversity of environments where AGNs can be found, consistent with the findings of Siudek et al. (2023b). These authors observed this trend for AGNs hosted by dwarf galaxies. It is worth noting that our results and conclusions remain unaffected when using the highest or lowest 20–40% of overdensity values for source classification.
The top panel of Fig. 3 displays the SFRnorm as a function of LX, using the samples described in the previous section, indicated by the black circles. The median values are presented. The errors presented are 1σ, calculated using bootstrap resampling. For comparison, we also incorporated measurements obtained from datasets within the Boötes, COSMOS, and eFEDS fields, presented in Mountrichas et al. (2021a, 2022c,a). Although the statistical uncertainties associated with our SFRnorm measurements are large, our findings are closely aligned with the outcomes observed in these prior studies. Specifically, the SFRs of low- to moderate-LX (log[LX,2#x2212;10 keV (erg s−1)] < 44) AGNs appear lower or (at most) equal to the SFRs of non-AGN galaxies, whereas more luminous AGNs present enhanced SFRs compared to non-AGN systems. It is important to note that in the depicted results of the previous studies in the figure, quiescent systems have been excluded from both the X-ray and galaxy control datasets. This exclusion primarily impacts the magnitude of the SFRnorm calculations, leading to a reduction, but without impacting the underlying trends (Mountrichas et al. 2021b, 2023).
 |
Fig. 3. SFRnorm ( |

The primary objective of this work is to study the SFRnorm-LX relation, across different cosmic environments. The results are displayed in the bottom panel of Fig. 3, indicated by filled symbols. We observe that AGNs with low to moderate luminosities that reside in low-density fields (filled triangles) exhibit a flat SFRnorm-LX relation, with SFR values lower than those of non-AGN galaxies in similar environments (i.e. SFRnorm < 1). Conversely, AGNs in high-density fields (filled squares) display an increase in SFRnorm with LX.
At log,[LX,2#x2212;10 keV (erg s−1)] > 44, our results imply that SFRnorm increases at elevated LX, irrespective of whether the AGNs are situated in high- or low-density environments. Furthermore, it appears that in all cosmic fields, luminous AGNs exhibit heightened SFR in comparison to non-AGN systems. However, due to the limited size of our X-ray sample, we can calculate only two data points, which come with relatively large associated uncertainties. Consequently, we have refrained from drawing definitive conclusions in this regard. Nevertheless, it is worth noting that these observations find support in the analysis of SFHs of (luminous) AGNs and non-AGN galaxies, as we discuss in the following section.
In the bottom panel of Fig. 3, we also superimpose a set of results from Mountrichas et al. (2023), focused on sources in the COSMOS field, represented by open symbols. Our results show similar trends with these previous findings for AGN featuring low to moderate LX. We note that the overdensity values for the sources in the COSMOS field have been calculated by applying a different method (i.e. ‘weighted adaptive kernel smoothing’; for more details see Darvish et al. 2015; Yang et al. 2018) from that used for the VIPERS galaxies, where it was applied to galaxies that are fainter than those in our galaxy dataset. It is essential to acknowledge that these methodological differences may introduce systematic biases when making comparisons between the two studies. However, Siudek et al. (2023a) examined the field densities of red passive galaxies from VIPERS and COSMOS, revealing a general agreement. This implies that the biases introduced by different techniques may not significantly impact the ultimate conclusions.
The findings of Mountrichas et al. (2023) also suggest a higher SFRnorm amplitude for the same LX in high-density fields compared to low-density regions. Our findings align with this trend, yet the distinction is less prominent, despite being consistently observed across a range of LX values. Previous studies have found differences in the SFRs of AGN host galaxies for different obscuration levels, in particular for AGN with modest LX (Georgantopoulos et al. 2023; Mountrichas & Georgantopoulos 2024; Mountrichas et al. 2024b). The COSMOS field benefits from deeper observations (compared to the XMM-XXL), resulting in a higher number of AGN in COSMOS that exhibit elevated obscuration levels. Therefore, part of the variation in SFRnorm values between high- and low-density fields in COSMOS could be attributed to the differing fractions of obscured AGN in these distinct cosmic environments.
Our findings are in agreement with previous studies that have indicated fluctuations in the SFR across diverse density fields, particularly evident at low redshifts (z < 1; e.g. Erfanianfar et al. 2016; Pérez-Millán et al. 2023; Sobral et al. 2022). However, no other works have suggested any discernible SFR variation across different environments (Leslie et al. 2020; Cooke et al. 2023). Meanwhile, certain investigations have observed environmental impacts solely based on the fraction of quiescent galaxies, with no apparent influence on star-forming systems (Darvish et al. 2016; Delgado et al. 2022).
4.2. Assessing the SFHs of AGNs and non-AGN galaxies given their LX and density fields
In this section, we examine the SFHs of AGNs and non-AGN galaxies across different cosmic environments and for different levels of AGN power. The results of our analysis are shown in the top panel of Fig. 4 and in Table 1. We find that low LX AGN have a Dn4000 distribution that peaks at higher values compared to the Dn4000 distribution of non-AGN galaxies. However, applying a Kolmogorov-Smirnov test yields a p-value of 0.28, implying that the difference of the two distributions is statistically significant at a level of < 2σ (two distributions differ with a statistical significance of ∼2σ for a p-value of 0.05). Moreover, moderate LX AGNs present a lower median Dn4000 value compared to non-AGN galaxies (Table 1). However, the observed differences of the two Dn4000 distributions are not statistically significant (p-value = 0.31).
 |
Fig. 4. Distributions of the Dn4000 spectral index. The top panel illustrates the Dn4000 distributions for sources in low-density fields. The bottom panel, presents the Dn4000 distributions for sources in high-density fields. For the galaxy control sample, the distributions are shown by the black, solid lines. The distributions of AGNs at low (42 < log[LX,2#x2212;10 keV (erg s−1)] < 43), moderate (43 < log[LX,2#x2212;10 keV (erg s−1)] < 44), and high LX (44 < log[LX,2#x2212;10 keV (erg s−1)] < 45) are presented by the green dashed, blue dotted, and red dashed-dotted lines, respectively. |
Number of X-ray AGNs and sources in the control sample in low- and high-density fields. Median Dn4000 values of each subset are also presented.
At the highest LX range spanned by our sample, our analysis indicates that AGNs have significantly lower median Dn4000 values compared to non-AGN galaxies (Table 1). The differences in the Dn4000 distributions of the two populations also exhibit a high statistical significance (p-value = 0.0009). These results suggest that luminous AGNs reside in galaxies with younger stellar populations compared to galaxies that do not host an active SMBH. We note, however, that our sample includes only four AGNs in the highest LX range. These results are in agreement with those presented in the previous section (see also Fig. 3); for instance, in the sense that systems with higher SFRs are expected to have younger stars compared to systems with lower SFRs.
Figure 4 and Table 1 present our results for AGNs and non-AGN systems in high-density fields. Moderate-LX AGNs present lower Dn4000 values compared to lower LX AGNs and non-AGN galaxies. Application of a KS-test reveals p-values of 0.02 and 0.08, between the Dn4000 distributions of low LX AGNs and non-AGNs, as well as moderate-LX AGNs and non-AGN galaxies, respectively. For the most luminous X-ray sources in our sample, with log[LX,2#x2212;10 keV (erg s−1)] > 44, we find that AGNs have statistically significant different Dn4000 distributions (p-value = 0.0001) and lower Dn4000 values compared to non-AGN galaxies. These results corroborate the findings reported in the previous section.
Mountrichas et al. (2023) used AGNs in the COSMOS field and found that in low-density fields, AGNs with log[LX,2#x2212;10 keV (erg s−1)] < 43 tend to have higher Dn4000 values, while AGNs with moderate Lx (43 < log[LX,2#x2212;10 keV (erg s−1)] < 44) exhibit similar Dn4000 values with non-AGN systems. Albeit, only the former difference appeared statistically significant at a level > 2σ. Our results, shown in the top panel of Fig. 4 and Table 1, corroborate these previous findings. Our results are also in line with those presented in Mountrichas et al. (2023) for AGNs and non-AGN systems in high-density fields.
In the study of Mountrichas et al. (2023), a trend was observed wherein galaxies tend to exhibit higher Dn4000 values as they transition to denser cosmic environments (e.g. Cucciati et al. 2010; Delgado et al. 2022; Siudek et al. 2022; Pérez-Millán et al. 2023). However, in our dataset, galaxies exhibit similar median Dn4000 values regardless of their cosmic surroundings (e.g. Leslie et al. 2020; Cooke et al. 2023). It is worth mentioning that prior research, such as the work of Mountrichas et al. (2022b), has highlighted the divergence in the SFH among non-AGN galaxies based on their morphological characteristics, with a comparatively lesser distinction observed among galaxies hosting AGNs. Hence, the observed variations in the comparison of Dn4000 across diverse density fields may be (at least in part) influenced by the inclusion of different morphological types within the sample being examined. These morphological variations may be also the cause of the observed differences in the Dn4000 distributions of galaxies in different density fields. To elaborate, galaxies in low-density fields have a highly peaked Dn4000 distribution, whereas in high-density environments galaxies have a wider Dn4000 distribution that also presents a long tail towards high values. Although these differences do not appear statistically significant (p-value = 0.07), similar features were also reported in the Dn4000 distributions of the galaxy sample used in Mountrichas et al. (2023). Other studies have also reported higher Dn4000 (and lower Hδ) values for galaxies in denser fields (e.g. Pérez-Millán et al. 2023). Mountrichas et al. (2023) found that this tail is populated, mainly, by quiescent galaxies that are more prominent in denser fields. Sobral et al. (2022) found that the Dn4000 and Hδ indices of galaxies depend on the cosmic environment (and M*), however, this is only valid in the case of quiescent systems; for star-forming galaxies, the two spectral indices do not show a significant dependence on the environment.
In summary, our analysis yields results that align with previous research, particularly the findings presented in Mountrichas et al. (2023) and especially with respect to AGNs with low to moderate LX. Most importantly, the results of our analysis suggest that highly luminous X-ray AGNs, with log [LX, 2 − 10 keV(erg s−1) > 44, tend to reside in galaxies characterised by younger stellar populations when contrasted with their counterparts lacking an active SMBH. Furthermore, this trend appears to hold true regardless of the cosmic environment in which these sources are located. We note, however, that larger datasets of luminous AGNs with available information on their local density are required to allow us to draw more definitive conclusions.
5. Conclusions
We used 149 X-ray AGNs, drawn from the XMM-XXL sample and 3488 non-AGN galaxies included in the VIPERS galaxy catalogue, to study the star formation rates and star formation histories of the two populations across difference density fields. Our sources span a redshift range of 0.5 < z < 1.0, with stellar masses of 10.5 < log [M*(M⊙)] < 11.5, and encompassing a broad spectrum of LX values (42 < log[LX,2#x2212;10 keV (erg s−1)] < 45). To distinguish between sources located in high and low-density fields, we utilised the measurements of the overdensity parameter (log(1 + δ)) available in the VIPERS catalog. In our analysis, we conducted an SED fitting using the CIGALE code to extract various properties of the (host) galaxies. We maintained stringent photometric and quality criteria to ensure the inclusion of sources with reliable calculations in our study. In summary, our primary findings can be summarised as follows:
-
Low- and moderate-LX AGNs (42 < log[LX,2#x2212;10 keV (erg s−1)] < 44) that reside in low-density fields exhibit a nearly constant SFRnorm-LX relationship. The SFRs of X-ray AGNs that span such luminosities appears lower, or at most comparable, to those of non-AGN galaxies.
-
Furthermore, AGNs situated in high-density environments present an increase in SFRnorm with LX, across all LX spanned by our dataset.
-
The most luminous of the X-ray sources (log[LX,2#x2212;10 keV (erg s−1)] > 44) display an elevated SFR compared to non-AGN galaxies, regardless of the density field they reside in.
-
For similar LX values, SFRnorm appears to be higher for sources in high-density regions compared to those in low-density fields. While this difference falls within the statistical uncertainties associated with SFRnorm measurements, it remains consistent across the entire LX range covered by our sources.
-
Low- and moderate-LX AGNs reside in galaxies that have comparable stellar populations (i.e. with similar Dn4000 values) compared to non-AGN galaxies, regardless of the density field.
-
Luminous AGNs tend to have younger stellar populations (lower Dn4000 values) compared to non-AGN galaxies, irrespective of the density field.
Our findings may imply that in dense environments, AGN feedback acts against the removal of the gas and prevents the suppression of star formation. The most powerful the AGN, the more effective its feedback becomes. Nevertheless, another way to interpet our finding might be a scenario in which a shared mechanism, such as mergers, serves to fuel both the star formation and the SMBH. The greater the amount of gas channeled to the galaxy through the triggering mechanism, the more pronounced the increase in both the SFR and X-ray luminosity. The lower SFR observed in galaxies hosting AGNs, compared to non-AGN systems ((SFR)norm < 1), in low-density fields could be attributed to a scarcity of available gas in these systems, indicative of negative AGN feedback (Zubovas et al. 2013). For a SMBH to accrete at very high X-ray luminosities (log,[LX,2#x2212;10 keV (erg s−1)] > 44), an ample supply of gas is required. This gas concurrently fuels the SFR in AGN-hosting systems, regardless of the galaxy’s environment.
These results contribute to our understanding of the complex interplay between SMBHs and their host galaxies, shedding light on how environmental factors and AGN luminosity influence star formation and the stellar populations of these systems. However, it is worth emphasising that future studies with larger datasets will be essential for refining and validating these intriguing trends and provide a more comprehensive understanding of the underlying processes at play.
Acknowledgments
This project has received funding from the European Union’s Horizon 2020 research and innovation program under grant agreement no. 101004168, the XMM2ATHENA project. This work has been supported by the Polish National Agency for Academic Exchange (Bekker grant BPN/BEK/2021/1/00298/DEC/1), the European Union’s Horizon 2020 Research and Innovation programme under the Maria Sklodowska-Curie grant agreement (No. 754510).
References
- Alexander, D. M., & Hickox, R. C. 2012, New Astron. Rev., 56, 93 [Google Scholar]
- Allevato, V., Finoguenov, A., Cappelluti, N., et al. 2011, ApJ, 736, 99 [NASA ADS] [CrossRef] [Google Scholar]
- Balogh, M. L., Morris, S. L., Yee, H. K. C., Carlberg, R. G., & Ellingson, E. 1999, ApJ, 527, 54 [Google Scholar]
- Bernhard, E., Grimmett, L. P., Mullaney, J. R., et al. 2019, MNRAS, 483, L52 [NASA ADS] [CrossRef] [Google Scholar]
- Boquien, M., Burgarella, D., Roehlly, Y., et al. 2019, A&A, 622, A103 [NASA ADS] [CrossRef] [EDP Sciences] [Google Scholar]
- Boyle, B. J., & Terlevich, R. J. 1998, MNRAS, 293, 49 [Google Scholar]
- Bruzual, G., & Charlot, S. 2003, MNRAS, 344, 1000 [NASA ADS] [CrossRef] [Google Scholar]
- Buat, V., Ciesla, L., Boquien, M., Małek, K., & Burgarella, D. 2019, A&A, 632, A79 [NASA ADS] [CrossRef] [EDP Sciences] [Google Scholar]
- Buat, V., Mountrichas, G., Yang, G., et al. 2021, A&A, 654, A93 [NASA ADS] [CrossRef] [EDP Sciences] [Google Scholar]
- Charlot, S., & Fall, S. M. 2000, ApJ, 539, 718 [Google Scholar]
- Chiappetti, L., Fotopoulou, S., & Lidman, C. 2018, A&A, 620, A12 [NASA ADS] [CrossRef] [EDP Sciences] [Google Scholar]
- Ciesla, L., Elbaz, D., & Fensch, J. 2017, A&A, 608, A41 [NASA ADS] [CrossRef] [EDP Sciences] [Google Scholar]
- Cooke, K. C., Kartaltepe, J. S., Rose, C., et al. 2023, ApJ, 942, 49 [NASA ADS] [CrossRef] [Google Scholar]
- Cristello, N., Zou, F., Brandt, W. N., et al. 2024, ApJ, 962, 156 [NASA ADS] [CrossRef] [Google Scholar]
- Cucciati, O., Iovino, A., Kovac, K., et al. 2010, A&A, 524, A2 [NASA ADS] [CrossRef] [EDP Sciences] [Google Scholar]
- Cucciati, O., Granett, B. R., Branchini, E., et al. 2014, A&A, 565, A67 [NASA ADS] [CrossRef] [EDP Sciences] [Google Scholar]
- Cucciati, O., Davidzon, I., Bolzonella, M., et al. 2017, A&A, 602, A15 [NASA ADS] [CrossRef] [EDP Sciences] [Google Scholar]
- Dale, D. A., Helou, G., Magdis, G. E., et al. 2014, ApJ, 784, 83 [Google Scholar]
- Darvish, B., Mobasher, B., Sobral, D., Scoville, N., & Aragon-Calvo, M. 2015, ApJ, 805, 121 [NASA ADS] [CrossRef] [Google Scholar]
- Darvish, B., Mobasher, B., Sobral, D., et al. 2016, ApJ, 825, 113 [NASA ADS] [CrossRef] [Google Scholar]
- Davidzon, I., Bolzonella, M., Coupon, J., et al. 2013, A&A, 558, A23 [NASA ADS] [CrossRef] [EDP Sciences] [Google Scholar]
- Davidzon, I., Cucciati, O., Bolzonella, M., et al. 2016, A&A, 586, A23 [NASA ADS] [CrossRef] [EDP Sciences] [Google Scholar]
- Delgado, R. M. G., Rodriguez-Martin, J. E., Díaz-García, L. A., et al. 2022, A&A, 666, A84 [NASA ADS] [CrossRef] [EDP Sciences] [Google Scholar]
- Elbaz, D., Daddi, E., Borgne, D. L., et al. 2007, A&A, 468, 33 [NASA ADS] [CrossRef] [EDP Sciences] [Google Scholar]
- Erfanianfar, G., Popesso, P., Finoguenov, A., et al. 2016, MNRAS, 455, 2839 [NASA ADS] [CrossRef] [Google Scholar]
- Fanidakis, N., Baugh, C. M., Benson, A. J., et al. 2012, MNRAS, 419, 2797 [NASA ADS] [CrossRef] [Google Scholar]
- Fanidakis, N., Georgakakis, A., Mountrichas, G., et al. 2013, MNRAS, 435, 679 [NASA ADS] [CrossRef] [Google Scholar]
- Florez, J., Jogee, S., Sherman, S., et al. 2020, MNRAS, 497, 3273 [NASA ADS] [CrossRef] [Google Scholar]
- Garilli, B., Guzzo, L., Scodeggio, M., et al. 2014, A&A, 562, A23 [NASA ADS] [CrossRef] [EDP Sciences] [Google Scholar]
- Garofalo, D., & Mountrichas, G. 2022, PASP, 134, 064102a [NASA ADS] [CrossRef] [Google Scholar]
- Georgakakis, A., Salvato, M., Liu, Z., et al. 2017, MNRAS, 469, 3232 [NASA ADS] [CrossRef] [Google Scholar]
- Georgantopoulos, I., Pouliasis, E., Mountrichas, G., et al. 2023, A&A, 673, A67 [NASA ADS] [CrossRef] [EDP Sciences] [Google Scholar]
- Guzzo, L., Scodeggio, M., Garilli, B., et al. 2014, A&A, 566, A108 [NASA ADS] [CrossRef] [EDP Sciences] [Google Scholar]
- Hopkins, P. F., Hernquist, L., Cox, T. J., & Keres, D. 2008, ApJS, 175, 356 [NASA ADS] [CrossRef] [Google Scholar]
- Inoue, A. K. 2011, MNRAS, 415, 2920 [NASA ADS] [CrossRef] [Google Scholar]
- Kauffmann, G., Heckman, T. M., White, D. M. S., et al. 2003, MNRAS, 341, 33 [CrossRef] [Google Scholar]
- Koutoulidis, L., Mountrichas, G., Georgantopoulos, I., Pouliasis, E., & Plionis, M. 2022, A&A, 658, A35 [NASA ADS] [CrossRef] [EDP Sciences] [Google Scholar]
- Le Fèvre, O., Saisse, M., Mancini, D., et al. 2003, in Instrument Design and Performance for Optical/Infrared Ground-based Telescopes, eds. M. Iye, & A. F. M. Moorwood, SPIE Conf. Ser., 4841, 1670 [CrossRef] [Google Scholar]
- Leslie, S. K., Schinnerer, E., Liu, D., et al. 2020, ApJ, 899, 58 [Google Scholar]
- Lin, L., Jian, H.-Y., Foucaud, S., et al. 2014, ApJ, 782, 33 [NASA ADS] [CrossRef] [Google Scholar]
- Madau, P., & Dickinson, M. 2014, ARA&A, 52, 415 [Google Scholar]
- Małek, K., Buat, V., Roehlly, Y., et al. 2018, A&A, 620, A50 [Google Scholar]
- Marchesi, S., Civano, F., Elvis, M., et al. 2016, ApJ, 817, 34 [Google Scholar]
- Masoura, V. A., Mountrichas, G., Georgantopoulos, I., et al. 2018, A&A, 618, A31 [NASA ADS] [CrossRef] [EDP Sciences] [Google Scholar]
- McMahon, R. G., Banerji, M., Gonzalez, E., et al. 2013, The Messenger, 154, 35 [NASA ADS] [Google Scholar]
- Meenakshi, M., Mukherjee, D., Wagner, A. Y., et al. 2022, MNRAS, 511, 1622 [NASA ADS] [CrossRef] [Google Scholar]
- Mountrichas, G. 2023, A&A, 672, A98 [NASA ADS] [CrossRef] [EDP Sciences] [Google Scholar]
- Mountrichas, G., & Buat, V. 2023, A&A, 679, A151 [NASA ADS] [CrossRef] [EDP Sciences] [Google Scholar]
- Mountrichas, G., & Georgantopoulos, I. 2024, A&A, 683, A160 [NASA ADS] [CrossRef] [EDP Sciences] [Google Scholar]
- Mountrichas, G., & Shankar, F. 2023, MNRAS, 518, 2088 [Google Scholar]
- Mountrichas, G., Georgakakis, A., Finoguenov, A., et al. 2013, MNRAS, 430, 661 [NASA ADS] [CrossRef] [Google Scholar]
- Mountrichas, G., Georgakakis, A., Menzel, M.-L., et al. 2016, MNRAS, 457, 4195 [NASA ADS] [CrossRef] [Google Scholar]
- Mountrichas, G., Georgakakis, A., & Georgantopoulos, I. 2019, MNRAS, 483, 1374 [NASA ADS] [CrossRef] [Google Scholar]
- Mountrichas, G., Buat, V., Georgantopoulos, I., et al. 2021a, A&A, 653, A70 [NASA ADS] [CrossRef] [EDP Sciences] [Google Scholar]
- Mountrichas, G., Buat, V., Yang, G., et al. 2021b, A&A, 653, A74 [NASA ADS] [CrossRef] [EDP Sciences] [Google Scholar]
- Mountrichas, G., Buat, V., Yang, G., et al. 2022a, A&A, 663, A130 [NASA ADS] [CrossRef] [EDP Sciences] [Google Scholar]
- Mountrichas, G., Buat, V., Yang, G., et al. 2022b, A&A, 667, A145 [NASA ADS] [CrossRef] [EDP Sciences] [Google Scholar]
- Mountrichas, G., Masoura, V. A., Xilouris, E. M., et al. 2022c, A&A, 661, A108 [NASA ADS] [CrossRef] [EDP Sciences] [Google Scholar]
- Mountrichas, G., Yang, G., Buat, V., et al. 2023, A&A, 675, A137 [NASA ADS] [CrossRef] [EDP Sciences] [Google Scholar]
- Mountrichas, G., Masoura, V. A., Corral, A., & Carrera, F. J. 2024a, A&A, 683, A143 [NASA ADS] [CrossRef] [EDP Sciences] [Google Scholar]
- Mountrichas, G., Viitanen, A., Carrera, F. J., et al. 2024b, A&A, 683, A172 [NASA ADS] [CrossRef] [EDP Sciences] [Google Scholar]
- Mullaney, J. R., Alexander, D. M., Aird, J., et al. 2015, MNRAS, 453, L83 [Google Scholar]
- Pérez-Millán, D., Fritz, J., González-Lópezlira, R. A., et al. 2023, MNRAS, 521, 1292 [CrossRef] [Google Scholar]
- Pierre, M., Pacaud, F., Adami, C., et al. 2016, A&A, 592, A1 [NASA ADS] [CrossRef] [EDP Sciences] [Google Scholar]
- Pineau, F. X., Derriere, S., Motch, C., et al. 2017, A&A, 597, A89 [NASA ADS] [CrossRef] [EDP Sciences] [Google Scholar]
- Pouliasis, E., Mountrichas, G., Georgantopoulos, I., et al. 2020, MNRAS, 495, 1853 [NASA ADS] [CrossRef] [Google Scholar]
- Pouliasis, E., Mountrichas, G., Georgantopoulos, I., et al. 2022, A&A, 667, A56 [NASA ADS] [CrossRef] [EDP Sciences] [Google Scholar]
- Salerno, J. M., Martínez, H. J., & Muriel, H. 2019, MNRAS, 484, 2 [NASA ADS] [CrossRef] [Google Scholar]
- Santoro, F., Oonk, J. B. R., Morganti, R., Oosterloo, T. A., & Tadhunter, C. 2016, A&A, 590, A37 [NASA ADS] [CrossRef] [EDP Sciences] [Google Scholar]
- Schreiber, C., Pannella, M., Elbaz, D., et al. 2015, A&A, 575, A74 [NASA ADS] [CrossRef] [EDP Sciences] [Google Scholar]
- Scodeggio, M. 2018, A&A, 609, A84 [NASA ADS] [CrossRef] [EDP Sciences] [Google Scholar]
- Scoville, N., Arnouts, S., Aussel, H., et al. 2013, ApJS, 206, 3 [Google Scholar]
- Siudek, M., Małek, K., Scodeggio, M., et al. 2017, A&A, 597, A107 [NASA ADS] [CrossRef] [EDP Sciences] [Google Scholar]
- Siudek, M., Małek, K., Pollo, A., et al. 2022, A&A, 666, A131 [NASA ADS] [CrossRef] [EDP Sciences] [Google Scholar]
- Siudek, M., Lisiecki, K., Krywult, J., et al. 2023a, MNRAS, 523, 4294 [NASA ADS] [CrossRef] [Google Scholar]
- Siudek, M., Mezcua, M., & Krywult, J. 2023b, MNRAS, 518, 724 [Google Scholar]
- Sobral, D., Smail, I., Best, P. N., et al. 2013, MNRAS, 428, 1128 [NASA ADS] [CrossRef] [Google Scholar]
- Sobral, D., van der Wel, A., Bezanson, R., et al. 2022, ApJ, 926, 117 [NASA ADS] [CrossRef] [Google Scholar]
- Stalevski, M., Fritz, J., Baes, M., Nakos, T., & Popović, L. Č. 2012, MNRAS, 420, 2756 [Google Scholar]
- Stalevski, M., Ricci, C., Ueda, Y., et al. 2016, MNRAS, 458, 2288 [Google Scholar]
- Wright, E. L., Eisenhardt, P. R. M., Mainzer, A. K., et al. 2010, AJ, 140, 1868 [Google Scholar]
- Wu, P.-F., van der Wel, A., Gallazzi, A., et al. 2018, ApJ, 855, 85 [Google Scholar]
- Yang, G., Brandt, W. N., Darvish, B., et al. 2018, MNRAS, 480, 1022 [NASA ADS] [CrossRef] [Google Scholar]
- Yang, G., Boquien, M., Buat, V., et al. 2020, MNRAS, 491, 740 [Google Scholar]
- Yang, G., Boquien, M., Brandt, W. N., et al. 2022, ApJ, 927, 192 [NASA ADS] [CrossRef] [Google Scholar]
- Zinn, P.-C., Middelberg, E., Norris, R. P., & Dettmar, R.-J. 2013, ApJ, 774, 66 [NASA ADS] [CrossRef] [Google Scholar]
- Zubovas, K., Nayakshin, S., King, A., & Wilkinson, M. 2013, MNRAS, 433, 3079 [Google Scholar]
All Tables
Number of X-ray AGNs and sources in the control sample in low- and high-density fields. Median Dn4000 values of each subset are also presented.
All Figures
|
Fig. 1. Distribution of the 149 X-ray AGNs used in our analysis, in the LX-redshift plane. |
| In the text | |
|
Fig. 2. Distribution of galaxies in the control sample, in the SFR-M* plane. |
| In the text | |
|
Fig. 3. SFRnorm ( |
| In the text | |
|
Fig. 4. Distributions of the Dn4000 spectral index. The top panel illustrates the Dn4000 distributions for sources in low-density fields. The bottom panel, presents the Dn4000 distributions for sources in high-density fields. For the galaxy control sample, the distributions are shown by the black, solid lines. The distributions of AGNs at low (42 < log[LX,2#x2212;10 keV (erg s−1)] < 43), moderate (43 < log[LX,2#x2212;10 keV (erg s−1)] < 44), and high LX (44 < log[LX,2#x2212;10 keV (erg s−1)] < 45) are presented by the green dashed, blue dotted, and red dashed-dotted lines, respectively. |
| In the text | |
Current usage metrics show cumulative count of Article Views (full-text article views including HTML views, PDF and ePub downloads, according to the available data) and Abstracts Views on Vision4Press platform.
Data correspond to usage on the plateform after 2015. The current usage metrics is available 48-96 hours after online publication and is updated daily on week days.
Initial download of the metrics may take a while.