Fig. 4.
Download original image
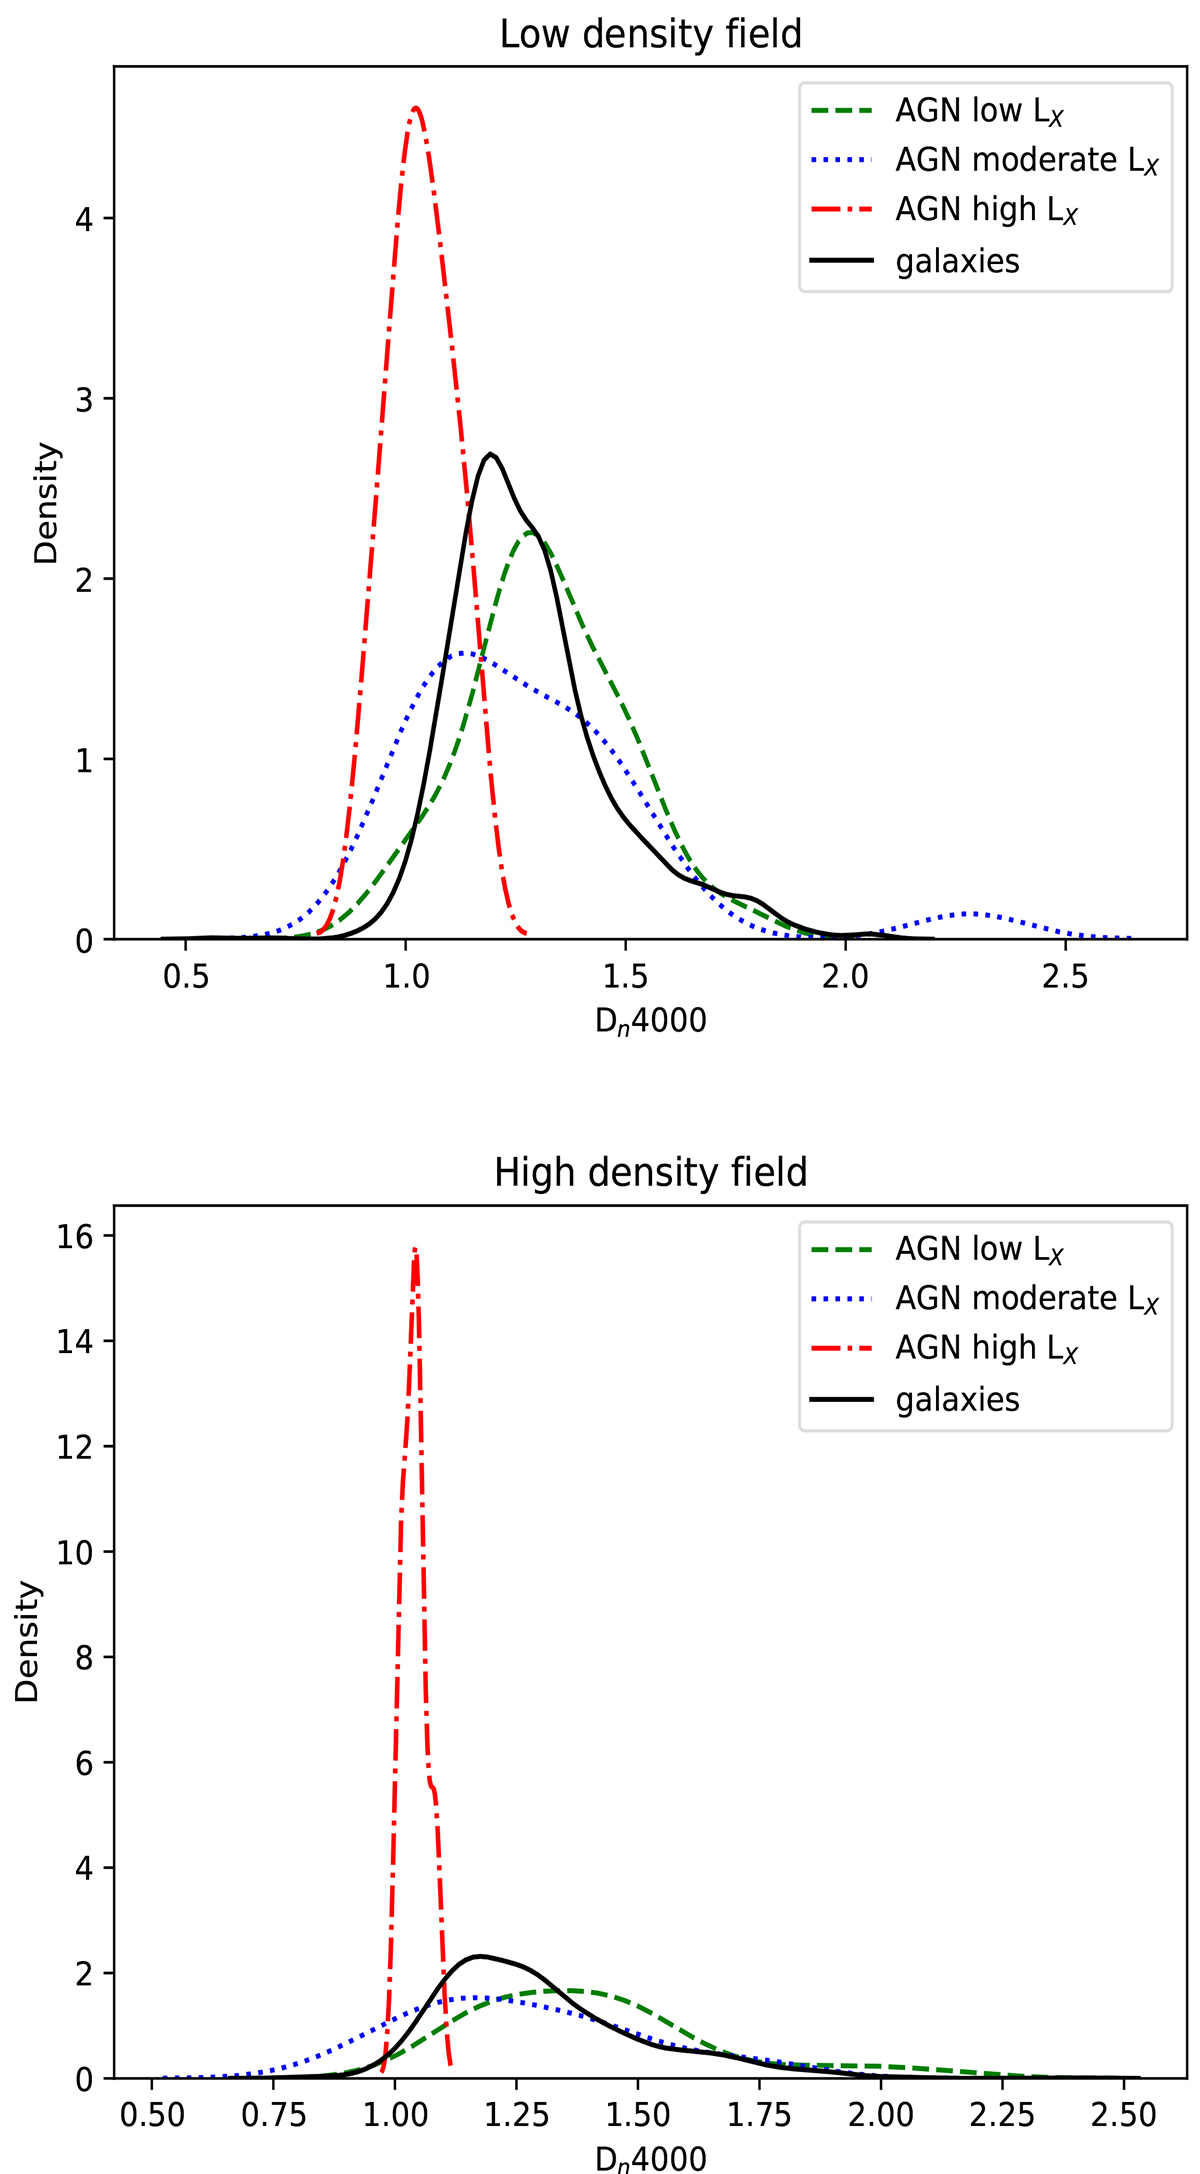
Distributions of the Dn4000 spectral index. The top panel illustrates the Dn4000 distributions for sources in low-density fields. The bottom panel, presents the Dn4000 distributions for sources in high-density fields. For the galaxy control sample, the distributions are shown by the black, solid lines. The distributions of AGNs at low (42 < log[LX,2#x2212;10 keV (erg s−1)] < 43), moderate (43 < log[LX,2#x2212;10 keV (erg s−1)] < 44), and high LX (44 < log[LX,2#x2212;10 keV (erg s−1)] < 45) are presented by the green dashed, blue dotted, and red dashed-dotted lines, respectively.
Current usage metrics show cumulative count of Article Views (full-text article views including HTML views, PDF and ePub downloads, according to the available data) and Abstracts Views on Vision4Press platform.
Data correspond to usage on the plateform after 2015. The current usage metrics is available 48-96 hours after online publication and is updated daily on week days.
Initial download of the metrics may take a while.