| Issue |
A&A
Volume 686, June 2024
|
|
|---|---|---|
| Article Number | A257 | |
| Number of page(s) | 13 | |
| Section | Cosmology (including clusters of galaxies) | |
| DOI | https://doi.org/10.1051/0004-6361/202347448 | |
| Published online | 18 June 2024 | |
THE THREE HUNDRED: Contrasting cluster galaxy density in hydrodynamical and dark matter simulations
1
Univ. Grenoble Alpes, CNRS, Grenoble INP, LPSC-IN2P3, 53, avenue des Martyrs, 38000 Grenoble, France
2
Departamento de Física Teórica and CIAFF, Módulo 8, Facultad de Ciencias, Universidad Autónoma de Madrid, 28049 Madrid, Spain
e-mail: alejandro.jimenez@uam.es
3
I.N.A.F. – Osservatorio Astronomico di Roma, Via Frascati 33, 00040 Monteporzio Catone, Roma, Italy
Received:
12
July
2023
Accepted:
1
February
2024
Cluster number counts at visible and IR wavelengths will be a key cosmological probe in the next decade thanks to the Euclid satellite mission. For this purpose, the performance of cluster detection algorithms, which at these wavelengths are sensitive to the spatial distributions of the cluster galaxy members and their luminosity functions, need to be accurately characterized. Using THE THREE HUNDRED hydrodynamical and dark-matter-only simulations, we studied a complete sample of massive clusters beyond 7 (5) × 1014 M⊙ at redshift 0 (1) on a (1.48 Gpc)3 volume. We find that the mass resolution of the current hydrodynamical simulations (1.5 × 10⁹ M⊙) is not enough to characterize the luminosity function of the sample in the perspective of Euclid data. Nevertheless, these simulations are still useful to characterize the spatial distribution of the cluster substructures assuming a common relative mass threshold for the different flavours and resolutions. By comparing with the dark-matter-only version of these simulations, we demonstrate that baryonic physics preserves significantly low-mass subhalos (galaxies), as has also been observed in previous studies with less statistics. Furthermore, by comparing the hydro simulations with higher resolution dark-matter-only simulations of the same objects and taking the same limit in subhalo mass, we find galaxy density profiles that are significantly more cuspy towards the centre of the clusters, where the low-mass substructures tend to concentrate. We conclude that using a dark-matter-only simulation may lead to some biases on the spatial distribution and density of galaxy cluster members. Based on the preliminary analysis of few high-resolution hydro simulations we conclude that a mass resolution of 1.8 × 10⁸h−1 M⊙ will be needed for THE THREE HUNDRED simulations to approach the expected magnitude limits for the Euclid survey. These simulations are currently under way.
Key words: methods: numerical / galaxies: clusters: general / galaxies: luminosity function / mass function / large-scale structure of Universe
© The Authors 2024
 Open Access article, published by EDP Sciences, under the terms of the Creative Commons Attribution License (https://creativecommons.org/licenses/by/4.0), which permits unrestricted use, distribution, and reproduction in any medium, provided the original work is properly cited.
This article is published in open access under the Subscribe to Open model. Subscribe to A&A to support open access publication.
1. Introduction
The abundance of clusters of galaxies (Press & Schechter 1974) constitutes a major cosmological probe (Allen et al. 2011) for the next generation of large-scale structure surveys like the one expected from the Euclid satellite (Laureijs et al. 2011). The number of clusters per unit of mass and redshift is driven by cosmological parameters as the dark matter and dark energy densities, Ωm and ΩΛ, as well as the rms of the linear matter fluctuations at 8 Mpc scales, σ8, via the halo mass function, which can be computed from numerical simulations (e.g. Tinker et al. 2008). A large number of studies have been performed with multi-wavelength observations of galaxy clusters confirming their potential as cosmological probes in X-ray (Liu et al. 2022; Pacaud et al. 2018; Adami et al. 2018; Böhringer et al. 2017), in the optical (Abbott et al. 2020; Drlica-Wagner et al. 2018; Maturi et al. 2019), and via the thermal Sunyaev-Zeldovich effect (tSZ, Hilton et al. 2021; Bocquet et al. 2019; de Haan et al. 2016; Bleem et al. 2015; Planck Collaboration XXIV 2016; Planck Collaboration XX 2014). Nevertheless, to date cluster cosmological constraints seem to be dominated by systematic effects related to the observational characterization of their mass (see summary in Pratt et al. 2019) and redshift (e.g. Benitez 2000, and references therein).
One key aspect for cluster cosmology is the determination of the selection function (SF) of the survey, which gives the probability of finding a cluster at a certain mass and redshift (see e.g. Adam et al. 2019, and references therin). The SF is an intrinsic characteristic of the cluster survey and depends on the cluster finder algorithm, the observational and quality cuts, the characteristics of the survey, and the chosen observables to estimate the cluster mass (X-ray emission, tSZ effect, richness, lensing, velocity dispersion) and redshift (photometric or spectroscopic). The SF can be estimated from simulations either from full mock galaxy catalogues including clusters and field galaxies, or from individual simulated clusters that are injected in the observed galaxy survey (e.g. Sartoris et al. 2016; Maturi et al. 2019; Adam et al. 2019; Rykoff et al. 2014). In both cases realistic physical properties of the clusters are needed over large ranges in mass and redshift and for a large variety of physical conditions.
For cosmological studies large sky volumes are needed. However, it is very difficult to produce full hydrodynamic simulations with sufficient resolution for such large volumes. A possible solution to this problem is the ‘zoom-in’ technique, as adopted by THE THREE HUNDRED collaboration (Cui et al. 2018). For this project a large cosmological volume is simulated by an N-body dark-matter-only simulation, and full-physics simulations are performed, but only in the regions where a galaxy cluster is found. To have enough statistics it is necessary to run a large number of independent simulations (324 regions for THE THREE HUNDRED). From these simulations cluster properties can be derived and used to complement large volume dark-matter-only simulations (de Andres et al. 2023). Alternatively, the individual cluster simulations and derived cluster properties can also be used to create synthetic clusters, which can be injected in real datasets.
Within the perspective of cluster cosmology with the next generation of optical and infrared large-scale structure surveys, and in particular of the Euclid satellite mission, we concentrate in this paper on the study of cluster member galaxies in THE THREE HUNDRED. We consider their luminosity function and spatial distribution, which are expected to drive cluster detection algorithms (Adam et al. 2019). In Sect. 2 we describe THE THREE HUNDRED data used. In Sect. 3 we discuss resolution effects in the determination of the luminosity function. In Sect. 4 we present results in the spatial distribution of cluster galaxy members. We finally conclude in Sect. 5.
2. THE THREE HUNDRED data
2.1. THE THREE HUNDRED simulations
THE THREE HUNDRED simulations were derived from the MDPL2 MultiDark Simulations (Klypin et al. 2016). The latter consist in a 1 h−1 Gpc cube containing 38403 dark matter (DM) particles with a mass of 1.5 × 10⁹h−1 M⊙ each. Once the dark-matter-only simulations are performed, a cluster finder algorithm is run. In this case we used the ROCKSTAR halo finder (Behroozi et al. 2012), which looks for dark matter halos. A total of 324 spherical regions were extracted from the halo finder results, selecting as the centre for these regions the position of the most massive halo at redshift z = 0. The radius of each spherical region is 15 h−1 Mpc; this is much larger than the virial radius of the central cluster, which is the radius that encloses the mass that corresponds to approximately 98 times of the critical density of the Universe (at z = 0), as given by the spherical collapse model. The phase space initial conditions for the 324 selected regions are used to perform the zoomed re-simulations. For the study presented in this paper, the 300th collaboration ran these simulations in four different flavours based on the GIZMO-SIMBA code (Cui et al. 2022), which can generate both dark-matter-only or hydrodynamical simulations. The GIZMO-SIMBA code is based on the meshless finite mass (MFM) method. The MFM is a Langrangian method for hydrodynamics based on a kernel discretization of the volume coupled to a high-order matrix gradient estimator and a Riemann solver acting over the volume ‘overlap’, first proposed by Hopkins (2015). In the case of hydrodynamical simulations the GIZMO-SIMBA code applies the following baryonic physics models:
-
The gas treatment consists of a homogeneous UV background (Haardt & Madau 2012) accounting for self-shielding on the fly (Rahmati et al. 2013) and gas metal dependent cooling (Smith et al. 2017).
-
Star formation and stellar feedback are included using a stellar model by Davé et al. (2016) and a galactic stellar and substellar initial mass function by Chabrier (2003). Decoupled two-phase winds with mass loading factor scaling with stellar mass and a wind velocity limit in jet mode of 7000 km s−1 are also implemented.
-
Finally, GIZMO-SIMBA includes black hole seeding and growth and active galactic nuclei (AGN) feedback (Davé et al. 2019).
2.2. Dataset
For this paper we used four different flavours of THE THREE HUNDRED simulations depending mainly on the resolution and on the physics used to re-simulate the cluster regions:
-
LR_DMONLY Dark-matter-only simulations with a dark matter particle resolution of 1.5 × 10⁹h−1 M⊙.
-
HR_DMONLY Dark-matter-only simulations at high resolution. They have twice as many particles per dimension than the LR_DMONLY for a total of 76803 particles, and consequently eight times less mass per particle, 1.8 × 10⁸h−1 M⊙ each.
-
LR_HYDRO Full-physics hydrodynamics simulations at the resolution of the LR_DMONLY.
-
HR_HYDRO Full-physics hydrodynamics simulations at the resolution of HR_DMONLY. For these simulations we only have five regions, due to the high computational cost.
Once the regions are re-simulated, they are analysed by the Amiga Halo Finder (AHF; Knollmann & Knebe 2009), producing a catalogue with the halos found within the different regions. In the case of hydrodynamical simulations, for each halo different properties are computed, such as its radius R2001, mass M200, density profile, and galaxy luminosities for several spectral bands covering from far-UV to radio. The galaxy luminosities are computed from the identified stars of the AHF finder using the STARDUST code (Devriendt et al. 1999, and references therein for more details). The spectral energy distribution (SED) of each galaxy is convolved with the bandpass of each photometric filter to compute the galaxy luminosity (Cui et al. 2018). In the case of dark-matter-only simulations we have the same properties except those related to baryonic physics (e.g. stellar mass and luminosities). Each halo can have smaller halos gravitationally bound to it, which we call subhalos, with their own properties. The more massive and central halo is known as the host halo. A low-mass threshold of 8 × 10¹⁴ h−1 M⊙ at z = 0 is imposed for the central halo. For each simulation flavour the final data consists of a halo and substructure catalogue per region.
2.3. Identifying galaxy cluster members.
To define a galaxy, first we consider a mass threshold for the subhalo mass for each of the four simulations. This translates into a mass resolution limit. We note that we consider the particle mass instead of the number of particles as our threshold because for the different simulations the particle mass is different. Thus, the same number of particles does not translate into the same subhalo mass. Taking into account the particle mass and the simulation resolution we adopt the following cuts:
-
For LR_DMONLY we consider 3 × 10¹⁰h−1 M⊙ as the lower limit. This is equivalent to considering that the substructure is formed by at least 20 dark matter particles.
-
For HR_DMONLY considering the same mass threshold as for the low-resolution leads to at least 160 dark matter particles because the resolution is eight times higher. Since the resolution is significantly higher, we can vary this threshold with respect to the low-resolution. So to check the resolution effects, we chose a mass threshold of 9 × 10⁹h−1 M⊙, corresponding to 50 dark matter particles.
-
LR_HYDRO shares resolution with the LR_DMONLY case. However, the particle mass is different because in this case we have dark matter particles and gas particles. This means that the same mass threshold between LR_DMONLY and LR_HYDRO does not translate into the same number of particles. A hydrodynamical simulated structure can have the same mass as a dark-matter-only structure, but without dark matter particles. We have to ensure that a galaxy has dark matter particles. For this reason we apply, in addition to the mass threshold, a threshold for the number of particles. Thus, we consider a mass threshold of 3 × 10¹⁰h−1 M⊙ (as for the LR_DMONLY case) and a minimum number of particles threshold of 10. In this way we ensure the presence of dark matter components in the baryonic structures, and also a minimum mass to have enough resolution.
-
HR_HYDRO shares resolution with the HR_DMONLY case. So, as in the latter, we chose a mass threshold of 9 × 10⁹h−1 M⊙. However, following the reasoning of the LR_HYDRO case, instead of having a minimum of 50 dark matter particles as for HR_DMONLY we chose 30 dark matter particles.
The next step is to identify for each re-simulated region the substructures (galaxies) associated with the halos (clusters). The output of the AHF algorithm is a list of structures with their associated physical properties, for example the total, gas, and stellar mass, as well as the halos to which they are gravitationally bound. For each cluster we define as galaxy members those structures bound to it. After this process, our dataset is formed by a list of clusters with galaxies bound to them. In the case of hydrodynamical simulations, we also need to check the mass ratio of the dark matter to the stellar content of the galaxy. The mass of a real galaxy comes mainly from the dark matter halo surrounding the stars and gas, so we impose that the stellar mass component is not higher than 30% of the total mass of the galaxy. We finally get rid of contaminated low-resolution particles that initially were outside the region of interest in order to maintain only well-resolved structures. Hereafter we use subhalos and substructures interchangeably to refer to galaxies; the same applies to halos and clusters to refer to galaxy clusters.
3. Resolution effects
3.1. Luminosity function
As discussed above, a key property for the detection of clusters of galaxies in large-scale structure surveys is the luminosity function (LF), defined as the projected density of galaxies per unit of magnitude (see Adam et al. 2019, for discussion). We therefore computed the LF for the LR_HYDRO simulations as shown in Fig. 1 (black dots and associated uncertainties). For simplicity we considered in the figure only the clusters at z = 1. To ease the comparison to the results on the Mock Euclid catalogue presented in Adam et al. (2019), we computed the LF for apparent magnitudes in the H-band. First of all, we observe a clear deficit of galaxies at faint magnitudes with a clear drop at magnitude 22. This is even more obvious when trying to fit a Schechter model to the data via a MCMC analysis following Adam et al. (2019). The dark and light grey shaded areas in the figure correspond to the 1σ and 2σ uncertainties over the best-fit Schechter model, respectively.
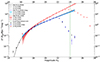 |
Fig. 1. Luminosity function in the H-band for the 324 LR_HYDRO regions (black), for five HR_HYDRO regions (red), and for the same five regions for LR_HYDRO (blue) at z = 1. The dots and the associated uncertainties are computed from the mean and dispersion in the bins in magnitude using all available clusters. The shaded areas are the 1σ and 2σ uncertainties for the best Schechter model fit. The vertical dashed line represents the observational limit for Euclid. |
The observed drop in the number of faint galaxies is most probably due to a lack of resolution in the LR_HYDRO simulations. To test this hypothesis, THE THREE HUNDRED collaboration has produced five HR_HYDRO simulations (see Sect. 2). We show as red dots in Fig. 1 the LF for several clusters in the HR_HYDRO simulations. We computed the LF as for the LR_HYDRO simulations and also fitted it to a Schechter model. We observe that the LF reaches a maximum magnitude of 24, which corresponds to the observational limit (green vertical line in Fig. 1) expected for Euclid (Laureijs et al. 2011). We also observe larger uncertainties, as only five regions are considered, but no drop in the number of galaxies. Furthermore, the Schechter model seems to be a good fit to the data, as expected. We observe fainter galaxies for the LR_HYDRO simulations most probably due to the lack of statistics in the HR_HYDRO simulations. To check this, we show as blue dots in Fig. 1 the LF for the LR_HYDRO simulations for the same five regions as the HR_HYDRO simulations. We observe that the fainter part of the LF agrees between the two resolutions. From these results we conclude that the resolution of the LR_HYDRO simulations is not enough to study the properties of the LF of clusters for the next generation of large-scale structure surveys such as Euclid. Producing HR_HYDRO is computationally very expensive, and so for this paper we only used five regions. In the following we use them for qualitative comparison and limit our quantitative analysis to the LR_HYDRO, LR_DMONLY, and HR_DMONLY simulations.
3.2. Subhalo mass function
The subhalo mass function gives the number of halo member galaxies (subhalos) of a given mass, relative to the mass of the halo. The final mass resolution of the simulation will imprint in the subhalo mass function as a deficit of low-mass subhalos.
To compute the subhalo mass function we first divided our sample into four bins in mass as described in Table 1. These were defined at redshift zero so that we can have bins as narrow as possible in mass (to ensure equivalent properties for the clusters in the bin), while preserving sufficient statistics per bin. We show in Fig. 2 the mass distribution of the selected clusters for the six redshift snapshots considered in this paper. The mass histograms for the LR_HYDRO, LR_DMONLY, and HR_DMONLY simulations are displayed in green, blue, and orange, respectively. On the one hand, we find that the mass distribution at each redshift is very similar for the three simulation flavours. On the other hand, we observe that at high redshift the number of massive clusters decreases significantly, as expected. This increases the number of clusters for the lowest mass bins.
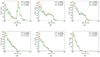 |
Fig. 2. Mass distribution of the selected clusters for the different snapshots in redshifts for the LR_DMONLY (blue), HR_DMONLY (orange), and LR_HYDRO (green) datasets described in the text. (a) z = 0.0, (b) z = 0.3, (c) z = 0.5, (d) z = 0.8, (e) z = 1.0, (f) z = 1.4. |
Definition of the cluster mass bins used for the analyses presented in the main text.
The resolution effect in the subhalo (galaxy) mass function can be clearly observed in Fig. 3. For the four bins in mass and at redshift zero we present the cumulative galaxy mass function for the four simulation flavours. We used all the available regions for each of the simulation flavours. The shaded regions displayed in the figure are obtained for each flavour from the mean and dispersion of the galaxy mass function of individual clusters in the mass bin. We plot the total number of substructures (galaxies or subhalos) per halo (cluster) with relative mass, Msubstruct/Mhalo, higher than a certain threshold. For the second mass bin the HR_HYDRO simulation has no cluster because of the low statistics (only five regions available).
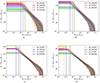 |
Fig. 3. Cumulative galaxy mass function for the HR_HYDRO, HR_DMONLY, LR_HYDRO, and LR_DMONLY simulations at redshift 0 for the four bins in mass considered. The shaded regions correspond to the standard deviation across clusters. Resolution effects are clearly visible for the low-mass region. The vertical lines represent the minimum relative mass necessary to avoid resolution effects. (a) MB1, (b) MB2, (c) MB3,(d) MB4. |
In terms of resolution, for very low-mass subhalos we find significant differences: high-resolution simulations show more subhalos at low mass than their respective low-resolution simulations. However, the subhalo mass function for the four simulation flavours are very similar at intermediate masses, and at high mass they converge into very similar distributions within the variance. We note that the HR_HYDRO simulations are shown only for qualitative comparison because of the lack of statistics. These two effects can be explained by the fact that low-mass substructures cannot be formed unless sufficient resolution is attained.
We also observe some physical effects. For the LR_HYDRO simulation we can see for all mass bins more galaxies than for the LR_DMONLY simulation. This is probably due to baryonic physics, which diminishes the ripping out of the objects because of cooling down processes of the gas, and so permits keeping a greater number of less massive galaxies. The increase in resolution in the HR_DMONLY simulations also tends to increase the number of low-mass substructures (galaxies). However, we observe how the total number of substructures is the same between the HR_DMONLY simulations and the LR_HYDRO simulations.
3.3. Redshift evolution of the subhalo mass function
We show in Fig. A.1 the cumulative subhalo mass function for the LR_HYDRO, LR_DMONLY, and HR_DMONLY simulations for the six redshift snapshots considered. They were computed as for Fig. 3. These cumulative galaxy mass functions can be well approximated by a power-law function, as in Dolag et al. (2009),

where N−4 is a normalization, α is the slope, and Msubstruct/Mcluster is the ratio of the virial mass of the substructures (galaxies) to that of their host halo. To obtain the best-fit parameters we performed least-squares fits of the mean value accounting for the uncertainties computed from the dispersion across clusters. In addition, we also performed a fit of the cumulative galaxy mass function per cluster and we computed the dispersion of the best-fit parameters across clusters for each bin in mass and for each redshift slice.
We present in Fig. 4 the evolution with redshift for both the normalization (left column) and the slope (right column) best-fit parameters for the four cluster mass bins discussed above (from top to bottom). The coloured dots represent the best-fit parameters for the four simulation flavours: LR_HYDRO (orange), LR_DMONLY (blue), and HR_DMONLY (green). The uncertainties are computed from the dispersion of the power-law fit of the 3D cumulative galaxy mass function distribution per cluster, and from the intrinsic uncertainty on the fit of the mean cumulative galaxy mass function, as discussed above. We observe no evolution with redshift for the two parameters, as was already the case in Dolag et al. (2009). However, we observe in average a slight increase in the slope with cluster mass. This is more obvious in Table 2 where we present the redshift averaged slope and uncertainties for the four bins in mass.
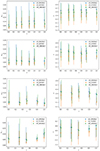 |
Fig. 4. Redshift and mass evolution of the parameters from the power-law fit of the 3D cumulative galaxy mass function. The left column represents the normalization N−4 and the right column the α parameter, for z = 0 up to z = 1.0. From top to bottom the results for the different cluster mass bins of Table 1 are presented. |
Redshift averaged and uncertainties of the slope, α, of the subhalo mass function for the four bins in mass and for the different simulation flavours considered.
3.4. Resolution cuts on the subhalo mass function
As discussed above, the subhalo mass function is very similar for the four simulations flavours apart from resolution effects (see Fig. 3). The latter affects the LR_DMONLY simulations more severely than the LR_HYDRO simulations. Comparing these two flavours in the following would require applying a cut on the minimum mass of the galaxies considered to avoid resolution effects in the LR_DMONLY simulations. A better alternative is to compare HR_DMONLY and LR_HYDRO simulations by applying a cut derived from the latter.
For this we computed for the LR_HYDRO simulations the minimum (Msubstruc/Mhalo) value for which resolution effects are not significant,

where NLR_HYDRO is the subhalo mass function for the LR_HYDRO simulations. The mass cuts found are given in Table 3 for each bin in mass and for each redshift slice. These mass cuts are applied in the rest of this paper when comparing the properties of the LR_HYDRO and HR_DMONLY simulations.
Relative galaxy to cluster mass, Msubstruc/Mhalo, cut applied to compare the LR_HYDRO, LR_DMONLY, and HR_DMONLY simulations for the six different redshift snapshots.
4. Galaxy density distribution
We study now the distribution of cluster galaxy members. For this, we concentrate on the LR_HYDRO and HR_DMONLY simulations to minimize resolution effects, while preserving sufficient statistics (number of cluster regions). We apply the galaxy relative mass cuts presented in Table 3. This should ensure a fair comparison both in terms of statistics and resolution. We note that in most cases dark-matter-only simulations can be used to assess cluster detection algorithm performance (see e.g. Adam et al. 2019).
4.1. Galaxy number density radial profiles
To assess the distribution of cluster galaxy members we compute galaxy density radial profiles for each of the identified clusters. We use equally spaced logarithmic radial bins in R200 units so that we can easily compare and combine clusters of different masses and redshifts. We calculate the cumulative cluster galaxy member density from the centre to the outskirts of the cluster. For a spherical shell at a distance R/R200 from the cluster centre, we count all the galaxies that are inside this sphere and compute the associated spherical volume. We also produced non-cumulative radial profiles, but found them less stable in terms of model fitting and they will not be further discussed here.
We present in the left panel of Fig. 5 the cumulative galaxy number density profiles for the LR_HYDRO (blue) and HR_DMONLY (red) simulations at redshift zero. From top to bottom we show the results for the four bins in mass presented in Table 1. The dots correspond to stacked radial profiles. The stacked profiles are computed by counting all galaxies for all the clusters in the given radial bin and dividing by the volume and the number of clusters considered. Uncertainties are obtained assuming a Poisson distribution for the number of galaxies. We find that for the innermost radius the profiles are badly reconstructed due to a lack of statistics. This effect leads to a clear bias of the stacked galaxy density radial profiles, as discussed in Appendix B (Fig. B.1). In the following we restrict the analysis to the external radial region as represented by the stacked profiles in Fig. 5. In the right panel we present the galaxy density (colour-coded) as a function of the relative galaxy-cluster mass, Msubstruc/Mhalo. We show the results in the middle and right columns of Fig. 5 at redshift zero for the LR_HYDRO and HR_DMONLY simulations, respectively. It is apparent that smaller galaxies tend to collect in the innermost regions of the cluster, as evidenced by the higher density in the LR_HYDRO simulations.
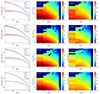 |
Fig. 5. 3D radial number density of galaxies for the four bins in mass defined in Table 1 (from top to bottom) at redshift zero. The left column gives the stacked profiles and uncertainties (dots and error bars) and the best-fit Einasto model with the 1σ and 2σ uncertainties (shaded regions) for the LR_HYDRO (blue) and HR_DMONLY (red) simulations. In the middle and right column we display the radial galaxy density distribution per galaxy-cluster relative mass for the LR_HYDRO and HR_DMONLY simulations, respectively. The color bars indicate the number density of galaxies. |
4.2. Modelling and fitting
It is difficult to extract physical information from a direct comparison of the galaxy density profiles. Better insights can be obtained from well-known analytical models. To this end, we fitted the galaxy density profiles to an Einasto model (Einasto 1965; Navarro et al. 2004) defined as
![$$ \begin{aligned} \rho (r) = n_0\exp {\left(\frac{-2}{\alpha }\left[ \left(\frac{r}{r_0}\right)^\alpha -1\right]\right)}, \end{aligned} $$](/articles/aa/full_html/2024/06/aa47448-23/aa47448-23-eq3.gif)
where n0, r0, and α are free parameters. We summarize here the physical interpretation of the parameters of the model: n0 gives the normalization of the galaxy density; α is related to the slope of the galaxy density distribution (when α decreases, the slope increases); and r0 is a kind of characteristic radius. For a radius larger than r0 the galaxy density profile drops rapidly.
We fitted the stacked cumulative galaxy density profiles to the Einasto model. We note that the latter has been integrated to obtain a cumulative radial profile matching the procedure performed on the simulation data. To find the best-fit parameters we considered a MCMC approach based on the emcee Python package (Foreman-Mackey et al. 2013).
We present in the left panel of Fig. 5 the results of the fit for the LR_HYDRO and HR_DMONLY simulations at redshift zero and for the four bins in mass. For additional insights into these findings, we refer to Haggar et al. (2021), which explores the outer regions of the clusters. Overall, the best-fit models are good fits to the data within the region of interest. The dashed (solid) black lines correspond to the best-fit model for the LR_HYDRO (HR_DMONLY) stacked profiles in the case of the MCMC algorithms. We observe that the best-fit model represents a good fit to the data in the region of interest. The MCMC results also allowed us to handle the uncertainties on the parameters.
We show in Figs. 6 and 7 the MCMC 2D probability distribution for the best-fit parameters of the stacked profiles in Fig. B.1. For both figures we plot the 68% and 95.4% confidence level (C.L.) contours for the LR_HYDRO (left column) and HR_DMONLY (right column) simulations. We give the results for four bins in mass in Table 1 (top to bottom) and for six slices in redshift from 0 to 1.4 (colour-coded). In some cases and for the highest redshift the statistic is not sufficient to obtain reliable fits.
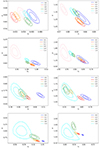 |
Fig. 6. Redshift evolution (z = 0 (blue), z = 0.3 (red), z = 0.5 (orange), z = 0.8 (green), z = 1 (cyan), and z = 1.4 (pink)) of the 2D probability distribution of the α and r0 parameters of the Einasto model for the LR_HYDRO (left column) and HR_DMONLY (right column) simulations. From top to bottom the results for the four bin in mass in Table 1 are shown. The inner and outer contours correspond to the 68% and 95.4% C.L., respectively. |
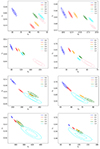 |
Fig. 7. Redshift evolution (z = 0 (blue), z = 0.3 (red), z = 0.5 (orange), z = 0.8 (green), z = 1 (cyan), and z = 1.4 (pink)) of the 2D probability distribution of the r0 and n0 parameters of the Einasto model for the LR_HYDRO (left column) and HR_DMONLY (right column) simulations. From top to bottom results for the four bin in mass in Table 1 are shown. The inner and outer contours correspond to the 68% and 95.4% C.L., respectively. |
We observe in Fig. 6 a clear anti-correlation between the α and r0 parameters. For both simulations the r0 parameter decreases (smaller clusters) with increasing redshift, as expected. Overall, we observe larger values of the α and r0 for the HR_DMONLY simulations with respect to the LR_HYDRO simulations. This indicates that the former are more concentrated and show steeper density profiles. Furthermore, for the HR_DMONLY simulations there seems to be a hint of redshift evolution of the α parameter with larger values at higher redshift. By contrast, for the LR_HYDRO simulations the α parameter shows very little evolution with redshift within the uncertainties. Nevertheless, it is difficult to give general conclusions on redshift evolution for any of the simulations as for a given bin in mass the distribution of cluster masses is very different across redshifts. Nevertheless, we conclude, as observed in Figs. 5 and B.1, that there are more galaxies in the inner cluster region for the LR_HYDRO simulations than for the HR_DMONLY ones.
These conclusions seem to be confirmed by the results shown in Fig. 7 where we present the MCMC 2D probability distribution for the r0 and n0 parameters. We observe that the normalization parameter is larger for the LR_HYDRO simulations with respect to the HR_DMONLY simulations. We also find that overall at lower redshift n0 and r0 are smaller and larger, respectively. This would indicate clusters are more extended at lower redshift, as expected. As for the results in Fig. 6 the differences in the cluster mass distribution across redshift may explain some variations with respect to this general pattern. In addition, we observe a particular behaviour for r0 in the lowest mass bin of the LR_HYDRO simulations, which can be explained considering the low scatter in this mass bin. Moreover low-mass galaxies have a significantly greater concentration of baryonic mass in the central region of the cluster compared to the total mass, increasing the density in the centre of the cluster.
4.3. Discussion
From the previous results we can conclude that the density radial profile for LR_HYDRO simulations are more concentrated and cuspier than those of the HR_DMONLY simulations. This can be clearly observed in the left column of Fig. 5. The LR_HYDRO clusters present a clear excess of galaxies in the central region and a drop in the profile for smaller radius than the HR_DMONLY ones. In addition, we see from the comparison of the subhalo mass function in Sect. 3.2 that the LR_HYDRO (HR_HYDRO) simulations have more low-mass galaxies than the LR_DMONLY (HR_DMONLY) simulations. We interpret these results as the fact that baryonic physics preserve low-mass substructures that tend to be located in the centre of the cluster.
We checked this statement by studying the galaxy density as a function of the relative galaxy-cluster mass presented in the right panel of Fig. 5. We confirm a clear excess of low-mass galaxy in the inner cluster region for the LR_HYDRO simulations with respect to the HR_DMONLY simulations. We also find that the low-mass galaxies are present at all radii and are the main components in number density for both types of simulations.
5. Conclusions
In this paper we have studied the properties of galaxies in THE THREE HUNDRED simulations in terms of luminosity function and radial distribution in the perspective of future large-scale structure surveys at optical and infrared wavelengths. For this we have used full physics hydrodynamical simulations at at mass resolution of 1.5 × 10⁹h−1 M⊙. We have completed these with equivalent resolution and eight times more resolved dark-matter-only simulations to disentangle possible effects from baryonic physics.
In terms of the luminosity function we find that the current mass resolution of THE THREE HUNDRED hydrodynamical simulations is not sufficient, and leads to an artificial cut above magnitudes of about 22 when future surveys like Euclid are expected to go as deep as magnitudes of 24 (Laureijs et al. 2011). These results motivated THE THREE HUNDRED collaboration to produce five high-resolution full-physics hydrodynamical regions (eight times more resolved in mass). We have proved that for these regions the reconstruction of the luminosity function goes up to magnitudes of 24. An effort to produce more high-resolution hydro simulations is under way.
We have computed subhalo (galaxy) mass functions for the four flavours of THE THREE HUNDRED simulations (hydro low and high resolution, and dark matter high and low resolution) for four bins in mass and for six snapshots in redshift. We find that the lack of resolution leads to significantly fewer low-mass galaxies both for the hydro and dark-matter-only simulations. We also find that the overall number of galaxies is the same between the low-resolution hydro simulations and the high-resolution dark-matter-only ones. Therefore, a high-resolution dark-matter-only simulation is broadly comparable with a low-resolution hydrodynamical simulation. We observe that overall the mass functions are quite similar in the high-mass regions where there are no resolution effects. We also find that baryonic physics tends to preserve a significantly greater number of low-mass galaxies. These results align with the insights presented in Sawala et al. (2013), Castro et al. (2021), and Beltz-Mohrmann & Berlind (2021), and provide valuable additional information, particularly in the cluster mass range above 1014 h−1 M⊙ where we have better resolution with a richer dataset. We have approached the different subhalo mass functions by a power law and have consistent slopes across simulations flavours and no evolution with redshift. We conclude that the main difference between the hydrodynamical and dark-matter-only simulations is the increase in the number of low-mass galaxies in the former.
Finally, we have studied the radial distribution of cluster member galaxies. To study possible baryonic physic effects, we compared the low-resolution hydrodynamical simulations and the high-resolution dark-matter-only resolution after imposing a cut in the relative mass of the particle for each bin in mass and for each redshift slice. Overall, we find that the radial galaxy number density profiles of the hydro simulations show an excess of galaxies in the inner part of the cluster and are more concentrated than those of the dark-matter-only simulations. Furthermore, we observe that for the hydro simulations the low-mass galaxies tend to concentrate in the inner part of the cluster. We conclude that baryonic physics preserves significantly more low-mass substructures, in particular in the inner cluster region.
References
- Abbott, T. M. C., Aguena, M., Alarcon, A., et al. 2020, Phys. Rev. D, 102, 023509 [Google Scholar]
- Adam, R., Vannier, M., Maurogordato, S., et al. 2019, A&A, 627, A23 [NASA ADS] [CrossRef] [EDP Sciences] [Google Scholar]
- Adami, C., Giles, P., Koulouridis, E., et al. 2018, A&A, 620, A5 [NASA ADS] [CrossRef] [EDP Sciences] [Google Scholar]
- Allen, S. W., Evrard, A. E., & Mantz, A. B. 2011, ARA&A, 49, 409 [Google Scholar]
- Behroozi, P. S., Wechsler, R. H., & Wu, H.-Y. 2012, ApJ, 762, 109 [Google Scholar]
- Beltz-Mohrmann, G. D., & Berlind, A. A. 2021, ApJ, 921, 112 [NASA ADS] [CrossRef] [Google Scholar]
- Benitez, N. 2000, ApJ, 536, 571 [CrossRef] [Google Scholar]
- Bleem, L. E., Stalder, B., de Haan, T., et al. 2015, ApJS, 216, 27 [Google Scholar]
- Bocquet, S., Dietrich, J. P., Schrabback, T., et al. 2019, ApJ, 878, 55 [Google Scholar]
- Böhringer, H., Chon, G., & Fukugita, M. 2017, A&A, 608, A65 [NASA ADS] [CrossRef] [EDP Sciences] [Google Scholar]
- Castro, T., Borgani, S., Dolag, K., et al. 2021, MNRAS, 500, 2316 [Google Scholar]
- Chabrier, G. 2003, PASP, 115, 763 [Google Scholar]
- Cui, W., Knebe, A., Yepes, G., et al. 2018, MNRAS, 480, 2898 [Google Scholar]
- Cui, W., Dave, R., Knebe, A., et al. 2022, MNRAS, 514, 977 [NASA ADS] [CrossRef] [Google Scholar]
- Davé, R., Thompson, R., & Hopkins, P. F. 2016, MNRAS, 462, 3265 [Google Scholar]
- Davé, R., Anglés-Alcázar, D., Narayanan, D., et al. 2019, MNRAS, 486, 2827 [Google Scholar]
- de Andres, D., Yepes, G., Sembolini, F., et al. 2023, MNRAS, 518, 111 [Google Scholar]
- de Haan, T., Benson, B. A., Bleem, L. E., et al. 2016, ApJ, 832, 95 [NASA ADS] [CrossRef] [Google Scholar]
- Devriendt, J. E. G., Guiderdoni, B., & Sadat, R. 1999, A&A, 350, 381 [NASA ADS] [Google Scholar]
- Dolag, K., Borgani, S., Murante, G., & Springel, V. 2009, MNRAS, 399, 497 [Google Scholar]
- Drlica-Wagner, A., Sevilla-Noarbe, I., Rykoff, E. S., et al. 2018, ApJS, 235, 33 [Google Scholar]
- Einasto, J. 1965, Trudy Astrofizicheskogo Instituta Alma-Ata, 5, 87 [NASA ADS] [Google Scholar]
- Foreman-Mackey, D., Hogg, D. W., Lang, D., & Goodman, J. 2013, PASP, 125, 306 [Google Scholar]
- Haardt, F., & Madau, P. 2012, ApJ, 746, 125 [Google Scholar]
- Haggar, R., Pearce, F. R., Gray, M. E., Knebe, A., & Yepes, G. 2021, MNRAS, 502, 1191 [NASA ADS] [CrossRef] [Google Scholar]
- Hilton, M., Sifón, C., Naess, S., et al. 2021, ApJS, 253, 3 [Google Scholar]
- Hopkins, P. F. 2015, MNRAS, 450, 53 [Google Scholar]
- Klypin, A., Yepes, G., Gottlöber, S., Prada, F., & Heß, S. 2016, MNRAS, 457, 4340 [Google Scholar]
- Knollmann, S. R., & Knebe, A. 2009, ApJS, 182, 608 [Google Scholar]
- Laureijs, R., Amiaux, J., Arduini, S., et al. 2011, arXiv e-prints [arXiv:1110.3193] [Google Scholar]
- Liu, A., Bulbul, E., Ghirardini, V., et al. 2022, A&A, 661, A2 [NASA ADS] [CrossRef] [EDP Sciences] [Google Scholar]
- Maturi, M., Bellagamba, F., Radovich, M., et al. 2019, MNRAS, 485, 498 [Google Scholar]
- Navarro, J. F., Hayashi, E., Power, C., et al. 2004, MNRAS, 349, 1039 [Google Scholar]
- Pacaud, F., Pierre, M., Melin, J. B., et al. 2018, A&A, 620, A10 [NASA ADS] [CrossRef] [EDP Sciences] [Google Scholar]
- Planck Collaboration XX. 2014, A&A, 571, A20 [NASA ADS] [CrossRef] [EDP Sciences] [Google Scholar]
- Planck Collaboration XXIV. 2016, A&A, 594, A24 [NASA ADS] [CrossRef] [EDP Sciences] [Google Scholar]
- Pratt, G. W., Arnaud, M., Biviano, A., et al. 2019, Space Sci. Rev., 215, 25 [Google Scholar]
- Press, W. H., & Schechter, P. 1974, ApJ, 187, 425 [Google Scholar]
- Rahmati, A., Pawlik, A. H., Raičević, M., & Schaye, J. 2013, MNRAS, 430, 2427 [NASA ADS] [CrossRef] [Google Scholar]
- Rykoff, E. S., Rozo, E., Busha, M. T., et al. 2014, ApJ, 785, 104 [Google Scholar]
- Sartoris, B., Biviano, A., Fedeli, C., et al. 2016, MNRAS, 459, 1764 [Google Scholar]
- Sawala, T., Frenk, C. S., Crain, R. A., et al. 2013, MNRAS, 431, 1366 [NASA ADS] [CrossRef] [Google Scholar]
- Smith, B. D., Bryan, G. L., Glover, S. C. O., et al. 2017, MNRAS, 466, 2217 [NASA ADS] [CrossRef] [Google Scholar]
- Tinker, J., Kravtsov, A. V., Klypin, A., et al. 2008, ApJ, 688, 709 [Google Scholar]
Appendix A: Redshift evolution of the subhalo mass function
We show in Fig A.1 the cumulative subhalo mass function for the LR_HYDRO (left column), LR_DMONLY (centre column), and HR_DMONLY (right column) simulations for the six redshift snapshots considered. They were computed as for Fig. 3, the shaded region being obtained from the mean and dispersion across clusters. From top to bottom the rows correspond to the bins in mass defined in Table 1. These subhalo mass functions can be compared to those presented in Dolag et al. (2009). With respect to the latter in this work we increased significantly the statistics, and we extended the cluster mass and redshift ranges considered. Furthermore, we used simulations at different resolutions.
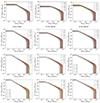 |
Fig. A.1. Redshift evolution (z = 0 (blue), z = 0.3 (orange), z = 0.5 (green), z = 0.8 (red), z = 1 (purple), and z = 1.4 (brown)) of the cumulative galaxy mass function for the LR_HYDRO (left), LR_DMONLY (centre), and HR_DMONLY (right) simulations for the four bin mass defined in Table 1 (from top to bottom). The shaded regions are obtained from the mean and standard deviation across clusters, as described in the text. |
Appendix B: Three-dimensional cumulative galaxy density profiles
We present in Fig. B.1 the 3D cumulative galaxy density distribution for the four simulation flavours considered: LR_DMONLY, LR_HYDRO, HR_DMONLY, and HR_HYDRO (from left to right). From top to bottom we present the results for the four bins in mass presented in Table 1. We plot the stacked density profiles for each slice in redshift. We note that for the HR_HYDRO simulations we only used five regions, which explains why profiles are missing at high redshift for the highest mass bins.
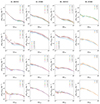 |
Fig. B.1. Redshift evolution (z = 0 (blue), z = 0.3 (orange), z = 0.5 (green), z = 0.8 (red), z = 1 (purple), and z = 1.4 (brown)) of 3D cumulative galaxy density profiles for the four simulation flavours and for the four bin in mass in Table 1. |
All Tables
Definition of the cluster mass bins used for the analyses presented in the main text.
Redshift averaged and uncertainties of the slope, α, of the subhalo mass function for the four bins in mass and for the different simulation flavours considered.
Relative galaxy to cluster mass, Msubstruc/Mhalo, cut applied to compare the LR_HYDRO, LR_DMONLY, and HR_DMONLY simulations for the six different redshift snapshots.
All Figures
|
Fig. 1. Luminosity function in the H-band for the 324 LR_HYDRO regions (black), for five HR_HYDRO regions (red), and for the same five regions for LR_HYDRO (blue) at z = 1. The dots and the associated uncertainties are computed from the mean and dispersion in the bins in magnitude using all available clusters. The shaded areas are the 1σ and 2σ uncertainties for the best Schechter model fit. The vertical dashed line represents the observational limit for Euclid. |
| In the text | |
|
Fig. 2. Mass distribution of the selected clusters for the different snapshots in redshifts for the LR_DMONLY (blue), HR_DMONLY (orange), and LR_HYDRO (green) datasets described in the text. (a) z = 0.0, (b) z = 0.3, (c) z = 0.5, (d) z = 0.8, (e) z = 1.0, (f) z = 1.4. |
| In the text | |
|
Fig. 3. Cumulative galaxy mass function for the HR_HYDRO, HR_DMONLY, LR_HYDRO, and LR_DMONLY simulations at redshift 0 for the four bins in mass considered. The shaded regions correspond to the standard deviation across clusters. Resolution effects are clearly visible for the low-mass region. The vertical lines represent the minimum relative mass necessary to avoid resolution effects. (a) MB1, (b) MB2, (c) MB3,(d) MB4. |
| In the text | |
|
Fig. 4. Redshift and mass evolution of the parameters from the power-law fit of the 3D cumulative galaxy mass function. The left column represents the normalization N−4 and the right column the α parameter, for z = 0 up to z = 1.0. From top to bottom the results for the different cluster mass bins of Table 1 are presented. |
| In the text | |
|
Fig. 5. 3D radial number density of galaxies for the four bins in mass defined in Table 1 (from top to bottom) at redshift zero. The left column gives the stacked profiles and uncertainties (dots and error bars) and the best-fit Einasto model with the 1σ and 2σ uncertainties (shaded regions) for the LR_HYDRO (blue) and HR_DMONLY (red) simulations. In the middle and right column we display the radial galaxy density distribution per galaxy-cluster relative mass for the LR_HYDRO and HR_DMONLY simulations, respectively. The color bars indicate the number density of galaxies. |
| In the text | |
|
Fig. 6. Redshift evolution (z = 0 (blue), z = 0.3 (red), z = 0.5 (orange), z = 0.8 (green), z = 1 (cyan), and z = 1.4 (pink)) of the 2D probability distribution of the α and r0 parameters of the Einasto model for the LR_HYDRO (left column) and HR_DMONLY (right column) simulations. From top to bottom the results for the four bin in mass in Table 1 are shown. The inner and outer contours correspond to the 68% and 95.4% C.L., respectively. |
| In the text | |
|
Fig. 7. Redshift evolution (z = 0 (blue), z = 0.3 (red), z = 0.5 (orange), z = 0.8 (green), z = 1 (cyan), and z = 1.4 (pink)) of the 2D probability distribution of the r0 and n0 parameters of the Einasto model for the LR_HYDRO (left column) and HR_DMONLY (right column) simulations. From top to bottom results for the four bin in mass in Table 1 are shown. The inner and outer contours correspond to the 68% and 95.4% C.L., respectively. |
| In the text | |
|
Fig. A.1. Redshift evolution (z = 0 (blue), z = 0.3 (orange), z = 0.5 (green), z = 0.8 (red), z = 1 (purple), and z = 1.4 (brown)) of the cumulative galaxy mass function for the LR_HYDRO (left), LR_DMONLY (centre), and HR_DMONLY (right) simulations for the four bin mass defined in Table 1 (from top to bottom). The shaded regions are obtained from the mean and standard deviation across clusters, as described in the text. |
| In the text | |
|
Fig. B.1. Redshift evolution (z = 0 (blue), z = 0.3 (orange), z = 0.5 (green), z = 0.8 (red), z = 1 (purple), and z = 1.4 (brown)) of 3D cumulative galaxy density profiles for the four simulation flavours and for the four bin in mass in Table 1. |
| In the text | |
Current usage metrics show cumulative count of Article Views (full-text article views including HTML views, PDF and ePub downloads, according to the available data) and Abstracts Views on Vision4Press platform.
Data correspond to usage on the plateform after 2015. The current usage metrics is available 48-96 hours after online publication and is updated daily on week days.
Initial download of the metrics may take a while.