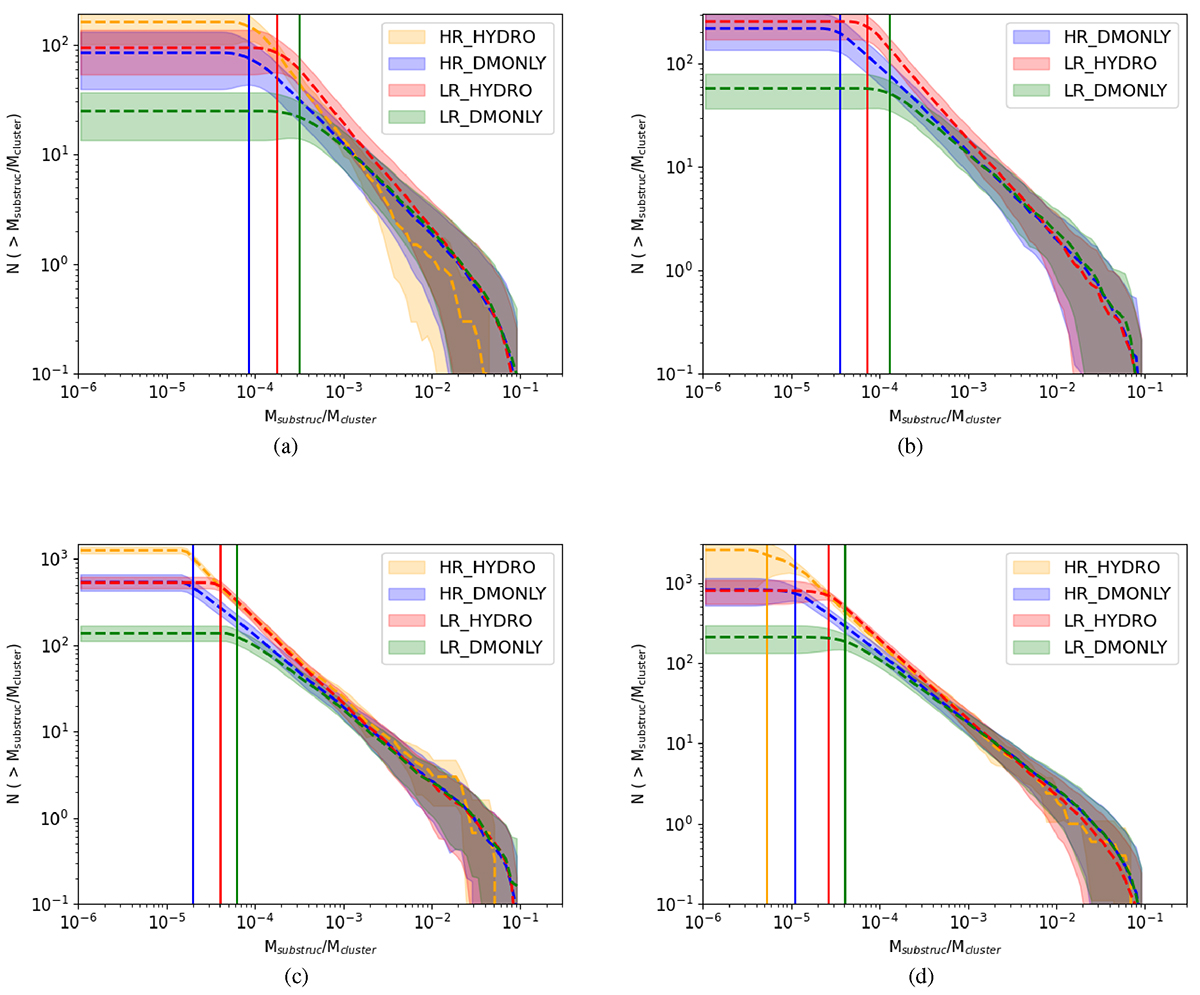
Fig. 3.
Download original image
Cumulative galaxy mass function for the HR_HYDRO, HR_DMONLY, LR_HYDRO, and LR_DMONLY simulations at redshift 0 for the four bins in mass considered. The shaded regions correspond to the standard deviation across clusters. Resolution effects are clearly visible for the low-mass region. The vertical lines represent the minimum relative mass necessary to avoid resolution effects. (a) MB1, (b) MB2, (c) MB3,(d) MB4.
Current usage metrics show cumulative count of Article Views (full-text article views including HTML views, PDF and ePub downloads, according to the available data) and Abstracts Views on Vision4Press platform.
Data correspond to usage on the plateform after 2015. The current usage metrics is available 48-96 hours after online publication and is updated daily on week days.
Initial download of the metrics may take a while.