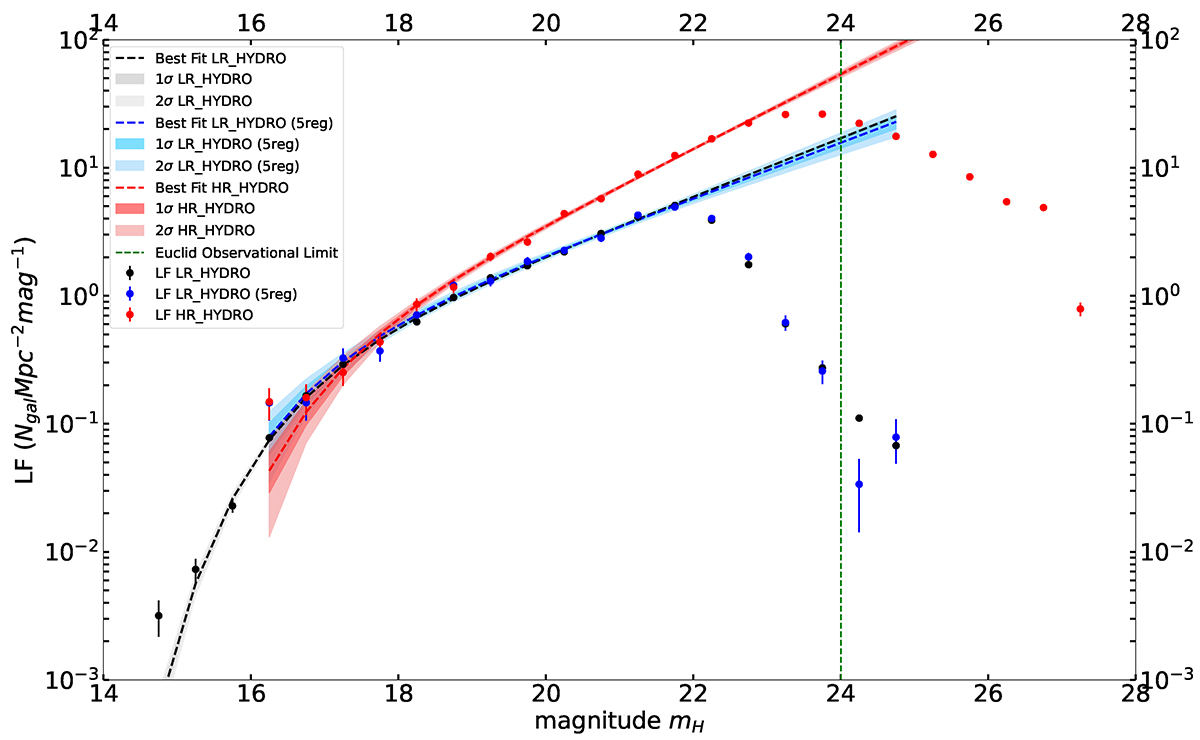
Fig. 1.
Download original image
Luminosity function in the H-band for the 324 LR_HYDRO regions (black), for five HR_HYDRO regions (red), and for the same five regions for LR_HYDRO (blue) at z = 1. The dots and the associated uncertainties are computed from the mean and dispersion in the bins in magnitude using all available clusters. The shaded areas are the 1σ and 2σ uncertainties for the best Schechter model fit. The vertical dashed line represents the observational limit for Euclid.
Current usage metrics show cumulative count of Article Views (full-text article views including HTML views, PDF and ePub downloads, according to the available data) and Abstracts Views on Vision4Press platform.
Data correspond to usage on the plateform after 2015. The current usage metrics is available 48-96 hours after online publication and is updated daily on week days.
Initial download of the metrics may take a while.