Fig. 5.
Download original image
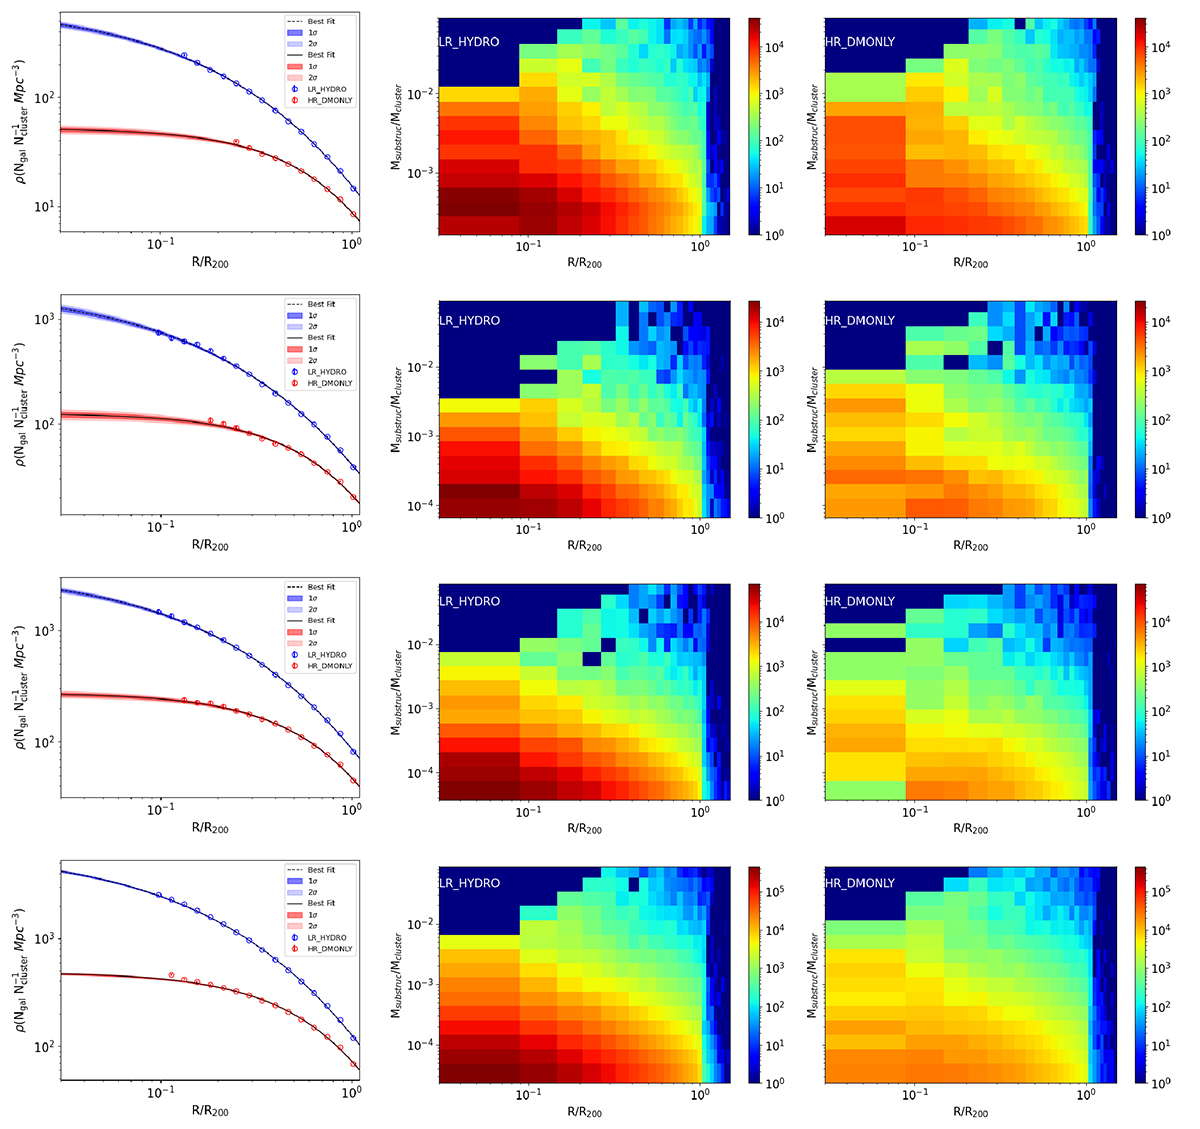
3D radial number density of galaxies for the four bins in mass defined in Table 1 (from top to bottom) at redshift zero. The left column gives the stacked profiles and uncertainties (dots and error bars) and the best-fit Einasto model with the 1σ and 2σ uncertainties (shaded regions) for the LR_HYDRO (blue) and HR_DMONLY (red) simulations. In the middle and right column we display the radial galaxy density distribution per galaxy-cluster relative mass for the LR_HYDRO and HR_DMONLY simulations, respectively. The color bars indicate the number density of galaxies.
Current usage metrics show cumulative count of Article Views (full-text article views including HTML views, PDF and ePub downloads, according to the available data) and Abstracts Views on Vision4Press platform.
Data correspond to usage on the plateform after 2015. The current usage metrics is available 48-96 hours after online publication and is updated daily on week days.
Initial download of the metrics may take a while.