| Issue |
A&A
Volume 684, April 2024
|
|
|---|---|---|
| Article Number | A107 | |
| Number of page(s) | 11 | |
| Section | Stellar structure and evolution | |
| DOI | https://doi.org/10.1051/0004-6361/202348528 | |
| Published online | 09 April 2024 | |
Optical tomography of the born-again ejecta of A 58
1
Instituto de Astrofísica de Andalucía, CSIC, Glorieta de la Astronomía s/n, Granada 18008, Spain
e-mail: This email address is being protected from spambots. You need JavaScript enabled to view it.
2
Department of Space, Earth, and Environment, Chalmers University of Technology, Onsala Space Observatory, 3992 Onsala, Sweden
3
Instituto de Radioastronomía y Astrofísica, Universidad Nacional Autónoma de México, Antigua Carretera a Pátzcuaro 8701, Ex-Hda San José de la Huerta, Morelia, 58089 Michoacán, Mexico
Received:
9
November
2023
Accepted:
26
January
2024
Abstract
In a born-again planetary nebula (PN), processed H-deficient material has been injected inside the old, H-rich nebula as a result of a very late thermal pulse (VLTP) event. Long-slit spectra have been used to unveil the chemical and physical differences between these two structures, but the ejection and shaping processes still remain unclear. To peer into the morpho-kinematics of the H-deficient ejecta in the born-again PN A 58, we present the first integral field spectroscopic observations of a born-again PN as obtained with GTC MEGARA. We detect emission from the Hα, He I, [O III], [N II] and [S II] emission lines, which help us unveil the expansion patterns of the different structures. In combination with ALMA and Hubble Space Telescope data we have been able to produce a complete view of the H-deficient ionized and molecular ejecta in A 58. We propose an hourglass structure for the ionized material, which embraces molecular high-velocity polar components and is simultaneously bisected by an expanding toroidal molecular and dusty structure. Our results leverage the role of a companion in shaping the VLTP ejecta in this born-again PN.
Key words: techniques: imaging spectroscopy / stars: evolution / stars: winds / outflows / planetary nebulae: general / planetary nebulae: individual: PN A66 58
© The Authors 2024
 Open Access article, published by EDP Sciences, under the terms of the Creative Commons Attribution License (https://creativecommons.org/licenses/by/4.0), which permits unrestricted use, distribution, and reproduction in any medium, provided the original work is properly cited.
This article is published in open access under the Subscribe to Open model. This email address is being protected from spambots. You need JavaScript enabled to view it. to support open access publication.
1. Introduction
Born-again planetary nebulae (PNe) are objects whose central stars (CSPNe) have experienced a very late thermal pulse (VLTP) when descending the white dwarf (WD) cooling track (Schönberner 1979; Iben et al. 1983). These thermonuclear explosive events are rare, given that the VLTP is produced when the outer He layer of the WD reaches unique conditions to ignite into C, engulfing the remnant H on the surface. As a consequence, this process injects H-deficient material inside an old, H-rich PN, creating double-shell structure (e.g., Toalá et al. 2021b; Rodríguez-González et al. 2023).
Models predict that the duration of the VLTP is short (10–200 yr; Miller Bertolami et al. 2006), which makes it difficult to identify born-again PNe. This would explain that only a handful of objects have been identified as born-again PNe, namely A 30, A 58, A78 and Sakurai’s Object the most studied cases (see, e.g., Jacoby 1979; Nakano et al. 1996; Clayton et al. 2006). Spectroscopic studies have helped unveil the extreme abundances differences between the born-again ejecta and those of the outer H-rich nebula (Jacoby & Ford 1983; Hazard et al. 1980; Manchado et al. 1988; Montoro-Molina et al. 2022, 2023; Wesson et al. 2008; Simpson et al. 2022).
The kinematics of the H-deficient ejecta is far from simple. High-dispersion optical spectroscopy works of the most evolved objects of this class, A 30 and A 78, found that the H-deficient material in these born-again PNe has velocities ranging from 40 km s−1 up to 500 km s−1 (Meaburn & Lopez 1996; Meaburn et al. 1998). In addition, Hubble Space Telescope (HST) observations show that the inner structures of the H-deficient ejecta in A 30, A 58 and A 78 exhibit a bipolar morphology consisting of a disk-like (or toroidal) structure and a pair of bipolar ejections (Borkowski et al. 1993, 1995; Clayton et al. 2013). The H-deficient clumps have a tadpole (clump-head and tail) morphology, which is indicative of the complex interactions of this material with the photoionization flux and the current fast wind from the CSPN (Fang et al. 2014; Rodríguez-González et al. 2022).
The disk-jet morphology of the H-poor ejecta in born-again PNe is suggestive of the action of binary systems. Moreover born-again PNe are listed among the PNe with the highest abundance discrepancy factor, whose cause has been interpreted as the evolution through a binary system (Wesson et al. 2018). The C/O abundance ratios of born-again ejecta also seems to be consistent with those of novae (Lau et al. 2011), although, once that the C trapped in dust is accounted for, the C/O ratio is actually more consistent with the predictions of a VLTP event of single stellar evolution models (see Toalá et al. 2021a, for the case of A 30). Although VLTP events and binary systems would seem unrelated, a common envelope phase with a binary companion after the VLTP event was recenlty invoked to explain the bipolar structures and their specific kinematic signatures (Rodríguez-González et al. 2022).
It is thus clear that an appropriate determination of the kinematics of the H-deficient ejecta is most needed to peer into the single versus binary scenarios. Thus far, the best determination for the youngest born-again PNe have been achieved studying the molecular emission. Atacama Large Milimeter/submillimeter Array (ALMA) observations of Sakurai’s Object and A 58 have shown that in both cases the molecular CO emission exhibit bipolar outflows protruding from an expanding toroidal structure; in Sakurai’s Object the deprojected disk velocity is 53 km s−1 and that of the bipolar outflow ∼1000 km s−1 (Tafoya et al. 2023), while in A 58 the disk is estimated to expand at a velocity of 90 km s−1 and its bipolar outflow at 280 km s−1 (Tafoya et al. 2022).
With this paper, we have initiated a series of works to study the morpho-kinematics of the H-deficient ejecta of a sample of born-again PNe using the unrivaled capabilities of high-dispersion integral field spectroscopic (IFS) observations obtained with the Multi-Espectrógrafo en GTC de Alta resolución para Astronomía (MEGARA; de Gil Paz et al. 2018) at the 10.4 m Gran Telescopio Canarias (GTC). Here, we present the results for A 58 that in conjunction with the available molecular emission detected by ALMA provide an unprecedented view of this born-again PN.
This paper is organized as follows. In Sect. 2 we describe our observations and their reduction. The analysis procedure of the data is presented in Sect. 3. The discussion of our results in presented in Sect. 4. Finally, our conclusions are presented in Sect. 5.
2. Observations and data reduction
2.1. Integral field spectroscopy
IFS observations of A 58 were obtained on 2022 June 21 (Program ID 24-GTC29/22A) using MEGARA at the GTC of the Observatorio de El Roque de los Muchachos (ORM, La Palma, Spain). The integral field unit (IFU) mode, also called Large Compact Bundle (LCB), was used. It consists of 567 hexagonal spaxels of 0 62 in diameter resulting in a field of view (FoV) of 12
 5 × 11
 3. The volume phase holographics VPH443-MR (MR-UB), VPH481-MR (MR-B), and VPH665-HR (HR-R) were used as dispersion elements. The details of the observations, the including spectral properties, exposure times, and observing conditions, are presented in Table 1.
Details of the GTC MEGARA observations of A 58 analyzed in this work.
The raw MEGARA data were reduced following the Data Reduction Cookbook (Pascual et al. 2019) using the megaradrp v0.10.1 pipeline released on 2019 June 29. This pipeline applies sky and bias subtraction, flat-field correction using halogen internal lamps, wavelength calibration, and spectra tracing and extraction. The final output is a FITS file that contains the science-calibrated row-stack-spectra (RSS) for each fiber, with metadata of the relative fiber positions to the IFU center. This RSS FITS file is converted into a 52 × 58 map of 0.2 arcsec pix−1 on the spatial dimension and 4300 spaxel along the spectral axis using the regularization grid task megararss2cube. The flux calibrations were performed using observations obtained immediately after those of A 58 of the spectrophotometric standard stars HR 7950, HR 7596, and HR 4963 for the VPH665-HR, VPH481-MR, and VPH443-MR, respectively.
2.2. Long-slit echelle spectroscopy
High-dispersion spectroscopic observations of A 58 were obtained on 2002 June 23 using the echelle spectrograph on the Cerro Tololo Interamerican Observatory (CTIO) 4 m Víctor Blanco (a.k.a. Blanco) telescope. The spectrograph was used in its long-slit mode with the 6563/75 narrow-band filter, whose ≈75 Å in FWHM bandwidth isolates the echelle order including the Hα and [N II] λλ6548,6584 emission lines. The 79 line mm−1 echelle grating and the long-focus red camera were used, resulting in a reciprocal dispersion of 3.4 Å mm−1. The data were recorded with the SITe 2K CCD #6, whose pixel size of 24 μm provides a spatial scale of 0 26 and a spectral sampling of 0.081 Å pixel−1 (i.e., 3.7 km s−1 pixel−1) along the dispersion direction. The slit has an unvignetted length of 3 arcmin and its width was set to 1
 4, resulting in an instrumental resolution of 9.1 km s−1. Two individual 750 s exposures were obtained with the slit oriented along a position angle (PA) of 50°, i.e., along the central ejecta. The angular resolution, determined by the seeing measured at the DIMM, was ≈1
 0.
0.
The spectra were reduced using standard IRAF (Tody 1993) routines for 2D spectra. The wavelength scale and geometrical distortion were corrected using a 2D fit to an arc exposure obtained using Th-Ar calibration lamps immediately after the science exposure. The deviation of the residuals of the 2D fit to the Th-Ar arc is found to be better than ≈0.004 Å (0.2 km s−1). The telluric emission lines, which includes mostly OH emission lines, but also the geocoronal Hα line, were removed by fitting and subtracting the background using low-order polynoms. Before this procedure, the telluric lines were used to confirm the accuracy of the wavelength calibration to be better than 0.3 km s−1 using their theoretical wavelengths (Osterbrock et al. 1996).
2.3. Milimeter/submillimeter interferometric observations
We retrieve high angular resolution (0 07 × 0
 1) observations obtained with the ALMA used to detect the continuum and molecular emission from A 58. These observations correspond to project 2019.1.01408.S (PI: D. Tafoya) and their details can be found in Tafoya et al. (2022).
3. Data analysis
3.1. Spectral line profiles
The GTC MEGARA observations detected emission from the [O III]λλ4363, 4959, 5007, [N II]λλ6548, 6584, [S II]λλ6716, 6731, He Iλ6678, He IIλ4686, Hβ, and Hα emission lines. We note that the C II 4267 Å emission line is not detected in the VPH433-MR observations at a 3-σ upper limit of 3.6 × 10⁻¹⁶ erg cm−2 s−1.
Spectral profiles of key emission lines of A 58 are presented in Fig. 1. The profiles of the H-poor ejecta (red dashed histograms in Fig. 1) have been extracted from a circular region 1 8 in radius around the brightest region. These spectra include significant contamination from the surrounding old, H-rich nebula. This emission is estimated by averaging four apertures located in each quadrant of MEGARA’s FoV with the same size as that used for the central ejecta. The emission line profiles from the surrounding nebula (gray solid histograms in Fig. 1) present a well-marked double-peak structure in the [N II] and H I Balmer lines, as well as in the fainter and noisier [S II] emission lines. The [O III] emission line seems to be consistent with a double-peak profile, but the components are broader and blended. Although this could be attributed to the lower spectral resolution of the blue MR-B VPH (R ≃ 13 200) that registered this line compared to the red HR-R VPH (R ≃ 20 050), the similarity of the Hβ (not shown here) and Hα nebular profiles implies that the components of the nebular [O III] emission line are truly broader. Finally the [O III] λ4363 and He lines do not present emission from the surrounding old nebula.
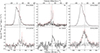 |
Fig. 1. GTC MEGARA emission line profiles of the central ejecta of A 58 (red dashed line) extracted from a 1 |

The blue component of the different emission lines from the outer nebula is consistently narrower and more intense than its red counterpart. If the expansion velocity of the nebula, Vexp, is assumed to be half the separation between the red and blue components, we derive velocities of 30 and 35 km s−1 for Hα and [N II], respectively, which are consistent with the expansion velocities of these emission lines derived from the CTIO long-slit echelle data.
Once the contribution of the old surrounding nebula is subtracted from the spectrum of the aperture encompassing the central ejecta, the remaining emission shall be attributed to net emission from that central ejecta (solid black lines in Fig 1). We note, however, that some residual emission subsists, as, for instance, the blue-shifted peak at VLSR ≈ 60 km s−1 in the [N II] emission line and the narrow components at VLSR ≈ 60 km s−1 and ≈130 km s−1 in Hα. These residuals most likely result from spatial variations of the emission of the surrounding old nebula (see, e.g., Fig. 2 in Guerrero & Manchado 1996).
The spectral profile from the central ejecta is asymmetric in all emission lines shown in Fig. 1. The emission peaks bluewards, very notably in the [N II] and [O III] emission lines at VLSR ≈ −20 km s−1. In these emission lines, the line profiles show wings that extends in the range −200 km s−1 ≲ VLSR ≲ +300 km s−1. The overall properties of these emission lines are very similar to those presented by Pollacco et al. (1992), although the data presented here have higher (S/N) and reveal the line wings more clearly. Otherwise only the blue component is detected in the Hα, [S II], and He I emission lines. We emphasize that the non-detection of the He IIλ4686 emission line discards the possible contribution of He IIλ6560 to the emission bluewards of Hα, which is thus confidently attributed to the ejecta. This is the first time that the Hα emission of the born-again ejecta is unambiguously detected, although a revision of Fig. 2 in Pollacco et al. (1992) reveals arguable evidence for its detection.
3.2. Systemic velocities of A 58 and its central ejecta
Considering the average of the nebular red and blue components to be the systemic velocity, Vsys, we derive velocities in the Local standard of rest (LSR) from the CTIO echelle data of 101.8 km s−1 and 104.4 km s−1 for the Hα and [N II] lines, respectively. An average of 103 km s−1 can thus be adopted for the systemic velocity of the old surrounding nebula, which is marked by a vertical dashed line in the different panels of Fig. 1. These values are found to be consistent to the observed dips in the GTC MEGARA Hα and [N II] λ6584 spectral profiles of the outer nebular shell shown in Fig. 1.
The only previous high-dispersion spectra of A 58, obtained with the Anglo-Australian Telescope Coudé échelle spectrograph (UCLES), implied a systemic velocity in the LSR of its outer nebula of 86 km s−1 (corresponding to a heliocentric velocity of 70 km s−1, Pollacco et al. 1992). This value is not associated to a specific emission line by the authors, neither there is a description of the slit position, besides the information on the 2″-wide slit. Due to the broad slit width, the nebular emission in the Hα and [N II] emission lines is more prominent than the profile shown in Fig. 1, making the double-peak quite noticeable. Later on, Clayton et al. (2013) analyzed the spectra presented by Pollacco et al. (1992) and derived a systemic velocity in the LSR of 96 km s−1 (or a heliocentric velocity of 80 km s−1).
The differences between the systemic velocity derived here and those reported by Pollacco et al. (1992) and Clayton et al. (2013) are 17 km s−1 and 7 km s−1, respectively. It is important to note that the original spectra presented by Pollacco et al. (1992) were not available to Clayton et al. (2013), who used a digitized version of the figures of the spectra and therefore adopted the same wavelength calibration. If we compare the dispersion of the UCLES and CTIO spectra, the spectral dispersion of the latter is approximately ten times higher than that of the UCLES spectra. The calibration and analysis of the CTIO data seems very reliable, as described in Sect. 2.2. Therefore the value of 103 km s−1 presented here is preferred for the systemic velocity of the outer shell of A 58.
Regarding the central ejecta of A 58, it is not possible to derive a systemic velocity from the optical emission lines as their profiles are highly asymmetric, most likely due to the strong extinction of this region (Montoro-Molina et al. 2022) preferentially absorbing the red component. On the other hand the radio emission of molecular material, which is mostly unaffected by the extinction, allows for more reliable determination of the systemic velocity of the recent ejecta. The spectral profile of the CO (J = 3 → 2) emission from the central region of A 58 detected by the 12 m Atacama Pathfinder Experiment (APEX) implied an average velocity in the LSR of 96 ± 11 km s−1, which was interpreted as the systemic velocity of the molecular gas around V605 Aql (Tafoya et al. 2017) in agreement with the value proposed by Clayton et al. (2013). We note, however, that the quality of the APEX spectral profile of the CO (J = 3 → 2) emission line is limited. The subsequent ALMA spectral profiles of the CO (J = 3 → 2), HCN (J = 4 → 3), and HCO+ (J = 4 → 3) emission line profiles presented by Tafoya et al. (2022) are of higher quality, but these were not used to derive new values of the systemic velocity. Instead, the authors concluded that the systemic velocity derived from APEX were consistent with the double-peak symmetric spectral profiles detected in the ALMA observations.
There is thus a difference of 7 km s−1 between the systemic velocity of the H-rich outer nebula derived from the CTIO optical data and that of the H-poor born-again ejecta derived from the APEX radio data, but these can be considered consistent given the uncertainties.
Indeed the dips between the blue and red components of the CO (J = 3 → 2) and HCO+ (J = 4 → 3) emission lines detected by ALMA are suggestive of a value of the systemic velocity slightly larger than that derived from APEX data. Hereafter, we consider the systemic velocity of A 58 and the H-poor ejecta around V605 Aql to be 103 km s−1. For this systemic velocity, the peaks of the H-poor ejecta [N II] and [O III] emission line profiles are shifted by ≈ − 120 km s−1 with respect to the systemic velocity, and their wings extend ≈ − 300 km s−1 and ≈ + 200 km s−1.
3.3. Channel maps
The GTC MEGARA data cube also allows us to obtain spatial information for each spectral channel. The channel maps of the bright [O III] λ5007 and [N II] λ6584 emission lines in the central ejecta of A 58 are shown in Fig. 2. Each map is obtained by combining channels within a velocity range of 50 km s−1, except those around the systemic velocity including the nebular emission that have been computed for a velocity range of 100 km s−1.
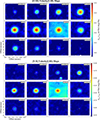 |
Fig. 2. GTC MEGARA VPH481-MR [O III] λ5007 (top) and VPH665-HR [N II] λ6584 (bottom) channel maps of A 58. Each map shows the integrated emission in the channles within the LSR velocity range labeled on the upper right corner of each map. Contours corresponding to 2.4%, 5%, 11%, 23%, and 48% of the emission peak (1.71 × 10⁻¹⁴ and 1.61 × 10⁻¹⁵ for [O III] and [N II], respectively) are overlaid in all maps (solid white lines). The approximate location of the central star is marked by a white star. |
Figure 2 reveals a trend in the spatial location of the emission from the born-again ejecta of A 58. The bluest velocity channels, in the range from −250 to −50 km s−1, show emission northeast of the CSPN, whereas the emission of the reddest velocity channels in the range from +50 to +350 km s−1 departs notably towards the southwest.
3.4. Relative location of V605 Aql and the optical outflow
The CSPN of A58, V605 Aql, has not been visible since 1923, when it underwent a brightening to fade away immediately afterwards (Seitter 1985; Harrison 1996). Ninety years later, Clayton et al. (2013) estimated its position at RA = 19h18m20s.538, Dec = +1°46′58 74 under the reasonable assumption that the HST F547M image was dominated by the C IV Wolf-Rayet emission feature in the spectrum of V605 Aql; therefore its peak emission revealing its position. The accuracy of these coordinates, however, is affected by the intrinsic limitations of HST to assign absolute positions. Indeed the comparison of the HST coordinates of V605 Aql with the position of the CO molecular emission derived from ALMA observations, which have higher absolute precision in establishing coordinates, revealed a notorious displacement between them.
At any rate there is no information on the absolute positioning of the MEGARA data cubes, which compromises a comparison of the spatial properties of the optical outflow with the HST and ALMA observations. To compensate this lack of information and to allow for a spatial comparison of the HST, ALMA and MEGARA observations, the stellar continuum in the MEGARA observations can be used to determine the position of V605 Aql. Continuum images were thus built from the VPH481-MR and VPH665-HR data cubes spectrally collapsing all channels with no line emission contribution, avoiding the noisiest ones as well. The position of V605 Aql was then determined by adjusting a 2D Gaussian to the stellar emission located near the center of the image. This procedure revealed an offset between the position of the star in the VPH481-MR and VPH665-HR data cubes of 1.3 pixels, i.e., 0 26, which is most likely due to irregularities in the surface and/or exact positioning of these two VPHs.
It is worth noting that we also explored the possibility of assigning the position of the centroid of the emission at the systemic velocity to V605 Aql. However, this method revealed a quite noticeable shift with the position of the stellar continuum. Apparently the emission at the systemic velocity does not correspond to the location of the CSPN, which reveals a 3D physical structure of the ejecta that is far from simple.
3.5. Boosting the tomography spatial resolution
The spatial resolution of the GTC MEGARA data is limited by the ≈0 9 seeing during the observations and the coarse 0
 62 in diameter spaxel sampling, which results in a spatial resolution ≈1
 1. Otherwise the spectral resolution allows for an investigation of the spatial location of the born-again ejecta at different velocities. The high S/N achieved in the MEGARA data actually allows for accuracy of the spatial location of the emission at each velocity channel to be increased by a factor ≈10 by the determining the position of the centroid of the optical emission through a 2D Gaussian fit (Condon 1997).
In the top panel of Fig. 3 we present both the centroids and the FWHMs (represented as ellipses) of the Gaussian resulting from the fittings for the [O III] (left) and [N II] (right) emission lines, with the position of V605 Aql marked using a ⋆ symbol. These fittings were conducted for channels within the LSR velocity range from −250 to +350 km s−1. Channels with associated centroids located more than 1″ away from the position of V605 Aql or with Gaussian FWHM exceeding 1 5 in any of its axes were excluded. The centroids and FWHMs are represented with a color code indicating their velocity with respect to the adopted systemic velocity of +103 km s−1.
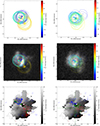 |
Fig. 3. Positions of the centroids and the FWHM (ellipses contours) of 2D Gaussian fits (top) to the emission of [O III] λ5007 (left panels) and [N II] λ6584 (right panels) at each spectral channel of the outflow of A 58 with a color-coded according to their velocity with respect to the Vsys (see text for details). The middle panel show the top panels superimposed over the HST [O III] λ5007 (left) and [N II] λ6584 (right) images of A 58 obtained in 2009 (PI: G. Clayton; Program ID: 11985). The bottom panel present the spatio-kinematic distribution of CO (J = 3 → 2) obtained with ALMA (see Fig. 5 in Tafoya et al. 2022). In these panels the centroids in the velocity range −100 km s−1 ≃ Voffset ≃ +100 km s−1 are plotted in green whereas centroids with velocities < − 100 km s−1 and > + 100 km s−1 are represented by blue and red filled dots, respectively. The approximate location of the central star is marked by a black, red and yellow stars in the top, middle and bottom panels, respectively. |
The spatial distribution of the centroids provides a clearer representation of the trend hinted in Fig. 2. The red-shifted emission shifts notably toward the southeast (SE) direction, while the blue-shifted emission moves toward the northeast (NE) direction, which is more pronounced for [O III] than for [N II]. Furthermore, the [O III] emission exhibits a much neater structure than that of [N II], with centroids of velocity channels ranging from −200 to +80 km s−1 with respect to the systemic velocity consistently oriented along a specific direction, whereas the centroids of the [N II] emission are more widely scattered, covering a slightly broader region around the central star. This dispersion cannot be completely attributed to the lower S/N ratio of this line, but more likely to a broader spatial distribution of the [N II] emission, may be located outside that of [O III].
The spatial behavior of the [O III] emission of the highest velocity channels is noteworthy. The centroids trace a peculiar loop, moving back toward the position of the CSPN first, shifting then to the northwest (NW) direction, and finally receding back to a lesser extent to the northeast (NE) direction. Similar trend is not observed for the red-shift emission, which seems to simply move away with increasing velocity. This is further discussed in Sect. 4.
The middle panels of Fig. 3 show the HST [O III] and [N II] images with the MEGARA centroids and FWHMs of the corresponding top panel superimposed for comparison. The location of the CSPN was set at the peak of the [O III] image as settled by Clayton et al. (2013) based on the HST F547M continuum image. The emission observed from the ejecta by MEGARA is consistent with the emission from the HST images, although the emission in the MEGARA maps appears to cover a slightly smaller region than in HST. This is somehow unexpected because the expansion of the ejecta ≃10 mas yr−1 (Clayton et al. 2013) implies an even larger size of the emission from the time lapse ≈13.3 years between the HST images (March 2009) and the MEGARA observations (June 2022).
Finally the lower panels of Fig. 3 show the CO (J = 3 → 2) first momentum image presented by Tafoya et al. (2022) overplotted by the MEGARA [O III] and [N II] centroids presented in the upper panels. To establish a morpho-kinematic parallelism between the centroids obtained and the disk-jet scenario described by this author, the color code was modified. Centroids with system velocities from −100 to +100 km s−1, in the range of the molecular material at the disk, are represented as filled green points, while centroids below −100 and above +100 km s−1 are shown in blue and red, respectively. The color code reveals that those centroids of the [O III] emission line presumed to belong to the disk are actually aligned along a distinct direction, PA = 60°, while those at higher velocities deviate from this orientation.
This pattern is more evident in Fig. 4, where the position-velocity diagrams of the centroids are displayed along two distinct directions: PA = 60° (parallel to the disk) and PA = 150° (perpendicular to it). A dashed horizontal line has been added at the position of the CSPN and a vertical line for Vsys = +103 km s−1. In the direction of PA = 60° (upper panel), it can be observed that, within the velocity range of −100 to +140 km s−1 in the LSR system, the centroids remain relatively flat around zero. For velocities below −140 and above +160 km s−1, there is only a minimal displacement of 0 2 relative to the position of the CSPN.
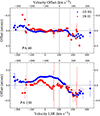 |
Fig. 4. Position-velocity (PV) plots in the [O III] λ5007 (red dots) and [N II] λ6584 (blue dots) of the CSPN of A 58 along the PA = 60° and PA = 150°. Positions have been obtained using a 2D Gaussian fit of the emission at each spectral channel (see text for details). The x-axis are showed in LSR system (bot) and respect to the systemic velocity (top) for both panels. The systemic velocity of the ejecta and the location of the CSPN are marked by vertical and horizontal dashed lines, respectively. |
4. Discussion
4.1. Physical structure of the H-poor ejecta of A 58
The physical structure of the H-poor ejecta of A 58 has been subject of different studies in the framework of the born-again phenomenon. Pollacco et al. (1992), Guerrero & Manchado (1996), and Clayton et al. (2013) investigated it from its optical emission, but these studies are hampered by the high and spatially inhomogeneous extinction. Otherwise the radio and sub-mm emission is much less prone to absorption (Tafoya et al. 2017, 2022).
Tafoya et al. (2022) proposed a model for the physical structure of the molecular gas based on the high-resolution CO (J = 3 → 2) emission detected with ALMA. The model consisted of a radially expanding disk-like or toroidal structure tilted along a PA of 63° with an inclination angle i ≈ 60° with the plane of the sky and an expansion velocity up to 80 km s−1, along with two high-velocity components (HVCs) orthogonal to the disk with velocities −140 ≲ Voffset ≲ −100 and +100 ≳ Voffset ≳ +140.
According to this model based on the CO (J = 3 → 2) spatio-kinematic information, the redshifted emission from the disk is found toward the NE of the CSPN, while the blueshifted emission is found toward the SW. This is exactly the opposite to the spatial distribution of the [O III] and [N II] emission (Fig. 3), thus indicating that the molecular disk is not emitting in the optical range, or at least, it is not the dominant structure. The spatial orientation of the CO HVCs is otherwise consistent with that of the [O III] and [N II] emission lines, but the CO HVCs exhibit noticeably lower velocities, in the range from −140 to +140 km s−1, to those revealed by the optical emission lines (see Fig. 1), in the velocity range from −300 up to +200 km s−1. The detailed spatial distributions of the CO HVCs and optical emission lines neither agree, with the redshifted optical emission being at the edge of the disk, further away from the CSPN than the corresponding CO HVC, whereas the blueshifted optical emission is generally located closer to the central star than the HVC. The velocity and spatial differences between the molecular and ionized components of the ejecta of A 58 suggest that they do not share the same physical structure.
Elaborating on the high-dispersion spatially-unresolved spectra presented by Pollacco et al. (1992) and using high-resolution multi-epoch HST WFPC2 images, Clayton et al. (2013) proposed a sketch for the physical structure of the optical ejecta of A 58. This model consisted of a central disk-like or torus and material moving away from the CSPN perpendicular to the disk, which is very similar to the model proposed for the molecular component by Tafoya et al. (2022). This structure was further geometrically simplified, assuming that the ejecta behaved as an expanding sphere and adopting an extinction that depended on the azimuthal coordinate within it with respect to the line of sight. Although the model reasonably reproduces the emission profile of the spectra, it does not provide information on the actual morphology of the ejecta. The variations in the MEGARA centroids of [O III] and [N II] (Fig. 3) do not follow that expected from a simple spherical model, although Clayton et al. (2013) noted variations in the profiles of these emission lines that attributed to small-scale dust inhomogeneities or material clumps. These indentations in the emission line profiles are otherwise not present in our higher-quality spectra (Fig. 1). Finally, the symmetric high-velocity ejecta arising from the innermost regions of A 58 sketched by Clayton et al. (2013) requires the spatial location of blue- and red-shifted velocity channels with similar offset velocity to be distributed symmetrically at both sides of the CSPN, with the systemic velocity at its position, which is not the case (Fig. 3).
The discrepancies of the predictions of the model presented by Clayton et al. (2013) with the MEGARA observations and the lack of correspondence between the molecular and ionized gas indicate that the physical structure of the latter is rather complex. Here, we propose a model (with schematic representation is shown in Fig. 5) that includes the different molecular and ionized gas components of the H-poor ejecta of A 58. The upper-left panel of this figure shows a spatio-kinematic model created with the software SHAPE (Steffen et al. 2011) consisting of a bipolar structure and a radially expanding disk inclined at an angle of i = 63° ±4° with respect to the line of sight. These structures, oriented along a PA of 63° (as proposed by Tafoya et al. 2022), produce the image shown in the upper-right panel of the figure. The mesh model shows the combination of the optical (blue and red) and molecular (green) emissions of A 58, where the geometrical model of the innermost molecular component presented by Tafoya et al. (2022) is shown for comparison. In this new approach, the optical outflows exhibit an hourglass-like morphology, instead of the high-velocity clumps used for the molecular gas. The bipolar lobes have a noticeable thickness, similar to the structure recently proposed for the young molecular ejecta of Sakurai’s object by Tafoya et al. (2023). The high-velocity components observed in the CO (J = 3 → 2) emission line are located within the cavities formed by the ionized gas, which is escaping around it, most likely transferring momentum to the molecular material and dragging it outwards.
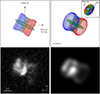 |
Fig. 5. SHAPE mesh model of V605 Aql and comparison with its HST F502N image of the [O III] λ5007 Å emission line. Top-left: edge-on view of the SHAPE mesh model consisting of a molecular disk (green) and collimated outflows and ionized bipolar outflows (blue and red). The inclination angle of the disk with the plane of the sky is 63°, as derived from the best-fit model. Top-right: projection onto the plane of the sky of the SHAPE mesh model. For comparison the right panel of Fig. 5 in Tafoya et al. (2022) is shown in the upper right corner of this panel. Bottom: HST [O III] image (left) and synthetic image (right). The [O III] synthetic image is computed from the ionized bipolar outflows. The molecular disk does not contribute to the emission, but it rather absorbs the optical emission behind it, which is accounted for adopting an ad hoc emission law for the ionized material. We refer to Sect. 4.1 for details. |
The molecular disk is not expected to emit in the optical emission line; rather, it causes the emission behind it to extinguish. In this sense it should be noted that SHAPE does not account for radiative transfer physics; thus the effects of the spatially varying extinction caused by the disk cannot be modeled. Instead an arbitrary emission law has been included in the model to simulate both the effects of extinction (emission decreasing with the optical depth along the line of sight and very particularly behind the molecular disk) and distance to the CSPN (emission decreasing with radial distance to the CSPN). The bottom panels show the HST [O III] image (left) and a synthetic image rendered from the SHAPE model (right). We remark that the bright “equatorial” band observed in the HST images does not arise from the molecular disk, rather it originates from the region of the hourglass structures closest to the disk, where they overlap.
Considering this physical structure for the ionized material and assuming a radial velocity vector with homologous expansion at each point, it is possible to interpret the behavior of the [O III] emission centroids shown in Fig. 3. The emission from the outflow, whose kinematics is best seen in the view from the plane of the sky shown in the left panel of Fig. 5, can be split into two components: one expanding close to the plane of the sky (1) and another one expanding mostly perpendicularly to it (2). The first component would correspond to those centroids of the emission in the low-velocity range from −100 to +100 km s−1. The spatial distribution of the emission at velocities within this range would be reasonably aligned with the direction of the outflow (PA of 63°) and would be more intense in the central regions for the blue emission, where the material thickness is maximal, and beyond the molecular disk for the red emission, where the extinction is minimal. These emissions would delineate the maximum spatial extent of the outflow. On the other hand, the emission expanding away on near- and far-side within the second (mostly along the line of sight) component, will have the highest projected velocities. It would be located closer to the CSPN star in the plane of the sky compared to the emission from the first component. This behavior is reflected in the centroids of gas with velocities > + 120 and < − 120 km s−1. We note that the traces of the centroids form a kind of loop, more evident in the less extincted emission heading toward us. This may suggest either density inhomogeneities within the structure or emission from the edge of the hourglass structure.
The proposed morphology for the H-deficient ionized and molecular components reveals an evolving physical structure, where the acceleration of material close to the CSPN by its sudden ionization and by the emerging stellar wind generates dynamical effects on the molecular material that has prevailed until now, thereby eroding the molecular disk and accelerating the bipolar molecular outflows. In addition to a high adf value in A 58, in the range ∼90 (Wesson et al. 2018)1, these characteristics support previous suggestions of the presence of a companion in born-again PNe (Soker 1997). A companion is definitely required to explain the formation of an equatorial disk and bipolar outflows, but the details of the (stellar or sub-stellar) companion and its orbital parameters are still unknown.
It is interesting to note that the abundances of the H-deficient material in A 58 obtained from optical spectroscopy are in agreement with the predictions from nova events and, thus, a nova-like event has been proposed to have taken place here (Lau et al. 2011). In such models the companion is of stellar origin, but we note that the velocity of the bipolar ejection in A 58 might actually offer up an alternative suggestion. The velocity of the molecular jet must be similar to the escape velocity (vesc) of the companion and, thus, the ≈280 km s−1 velocity of the molecular emission (Tafoya et al. 2022) seems to suggest the presence of a substellar object more massive than a Jupiter-like planet (vesc ≈ 60 km s−1) or a main-sequence stellar companion with spectral type later than M9 (vesc ≈ 600 km s−1; Kaltenegger & Traub 2009).
An alternative channel for the formation of disk/jet structures in born-again pNe has recently been proposed by Rodríguez-González et al. (2022). It is suggested that a WD in a binary system, after experiencing a VLTP, inflates its outer layers and enters a common envelope with its companion (which, in the case of A 58, would be a substellar companion). Even though the duration of the VLTP is short (≲200 yr; Miller Bertolami et al. 2006), these authors argue that it is sufficient to allow for the companion to shape the H-deficient ejecta into a disk plus a bipolar structure. We note that such claims will have to be put to the test with future numerical simulations following the specific evolution of a star experiencing a VLTP in a binary system.
4.2. Spatial distribution of the HCN and CO high-velocity components
The ALMA CO molecular emission of A 58 has been attributed to a radially expanding disk-like structure and orthogonal compact high-velocity components (Tafoya et al. 2022). This spatio-kinematical structure differs notably from that derived here from optical emission lines of ionized material. Interestingly the spectral profiles of emission lines of other molecules arising from the born-again ejecta, most notably the HCN (J = 4 → 3) shown in the left panel of Fig. 6, also present high-velocity components whose spatial distribution can be compared to those of CO (J = 3 → 2), [O III] and [N II].
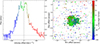 |
Fig. 6. Spatio-kinematical distribution of the HCN(J = 4 → 3) emission around V605 Aql. Left: ALMA HCN (J = 4 → 3) emission line profile from V605 Aql. Right: velocity field (first moment) of the HCN (J = 4 → 3) emission around V605 Aql in the velocity range of −100 < Voffset (km s−1) < 100 is shown as a color map, according to the color code of the emission line profile in the left panel. The pixels with emission below three times the rms noise level of 0.2 mJy beam−1 were masked. The gray contours show the velocity-integrated emission (zeroth moment) of the HCN (J = 4 → 3) in the velocity range −100 < Voffset (km s−1) < 100. The gray contours are drawn from 3σ on steps of 3σ (where σ = 6.5 mJy beam−1 km s−1 is the rms noise level of the zeroth moment image). The blue and red contours show the zeroth moment emission of the HCN (J = 4 → 3) in the velocity range −165 < Voffset (km s−1) < − 100 and +100 > Voffset (km s−1) > + 180, respectively. The red contours are drawn for 9, 12 and 15 mJy whereas blue contours are drawn for 7, 9 and 11 mJy. |
The ALMA observations have then been used to obtain the first moment image of the HCN (J = 4 → 3) emission line shown in the right panel of Fig. 6. Contrary to the CO molecule, the spatial distribution of the high-velocity component of HCN is not compact, but it is rather diffuse and more extended. While CO is well known for being an excellent tracer of molecular outflows, which could include a wide range of physical conditions, the HCN and HCO+ molecules are typically excited within high-density gas. The optical emission lines from ionized material and the HCN molecule would then trace the highly excited gas, expelled from regions closer to the central source, whereas the CO molecule would probe denser material from the expanding equatorial disk and molecular outflow.
5. Conclusions
We presented an analysis of IFS observations of the born-again PN A 58 obtained with GTC MEGARA. These observations helped us disclose the true kinematics of the optical emission from the born-again ejecta in this PNe. MEGARA’s high spectral resolution has allowed us to directly detect the H-alpha emission from the H-poor ejecta without any contamination, could only be estimated through limited methods thus far, for instance, those described by Wesson et al. (2008) and Montoro-Molina et al. (2022). Only the blue component is detected, whereas the red component is deemed to be completely absorbed behind a high-density molecular and dusty disk.
We used observations from CTIO to estimate an average systemic velocity of +103 km s−1 consistent with the MEGARA data. Previous measurements, both 96 km s−1 obtained by Clayton et al. (2013) and Tafoya et al. (2017) for the inner ejecta, are also consistent within the errors values. Nevertheless, the brightening of one side of A 58 and the blue components of the nebular emission lines being broader than the red ones seem to suggest the interaction of the PN with the ISM, which may result in different radial velocities of the old nebula and recent VLTP ejecta.
We have also performed a channel-by-channel Gaussian adjusting of the ejecta emission, improving the modest spatial resolution of our data. This has allowed us to refine the description of the morphology of the optical emission of the ejecta, which initially was assumed to be practically identical to the molecular emission. The high-velocity components now result in a hourglass structure, within which the high-velocity molecular components are located. The SHAPE model presented reasonably reflects the emission detected in the [O III] λ5007 line obtained with the HST. It is worth mentioning that the sketches presented by Montoro-Molina et al. (2022) are in good agreement both with the spectral variability observed in the ejecta and with the proposed spatio-kinematic structure.
Prior knowledge of the spatial distribution of the molecular content of the H-poor ejecta of A 58 has allowed us to interpret the results obtained in the optical range, which would have otherwise been nearly impossible. This insight reveals that molecular material may be playing a significant role in the rest of known born-again PNe, namely A 30, A 78, HuBi 1, and Sakurai’s Object.
Acknowledgments
The authors thanks the referee, Geoffrey Clayton, for his comments and suggestions to improve the presentation of the manuscript. B.M.M. and M.A.G. are funded by grants PGC2018-102184-B-I00 and PID2022-142925NB-I00 of the Ministerio de Educación, Innovación y Universidades (MCIU) cofunded with FEDER funds. J.A.T. thanks Dirección General de Asuntos del Personal Académico (DGAPA) of the Universidad Nacional Autónoma de México (UNAM, Mexico) project IA101622, and support from the Marcos Moshinksy Foundation and the Visiting-Incoming programme of the IAA-CSIC through the Centro de Excelencia Severo Ochoa (Spain). This work as made extensive use of the NASA’s Astrophysics Data System (ADS).
References
- Borkowski, K. J., Harrington, J. P., Tsvetanov, Z., & Clegg, R. E. S. 1993, ApJ, 415, L47 [NASA ADS] [CrossRef] [Google Scholar]
- Borkowski, K. J., Harrington, J. P., & Tsvetanov, Z. I. 1995, ApJ, 449, L143 [NASA ADS] [CrossRef] [Google Scholar]
- Clayton, G. C., Kerber, F., Pirzkal, N., et al. 2006, ApJ, 646, L69 [NASA ADS] [CrossRef] [Google Scholar]
- Clayton, G. C., Bond, H. E., Long, L. A., et al. 2013, ApJ, 771, 130 [NASA ADS] [CrossRef] [Google Scholar]
- Condon, J. J. 1997, PASP, 109, 166 [NASA ADS] [CrossRef] [Google Scholar]
- de Gil Paz, A., Carrasco, E., Gallego, J., et al. 2018, in Ground-based and Airborne Instrumentation for Astronomy VII, eds. C. J. Evans, L. Simard, & H. Takami, SPIE Conf. Ser., 10702, 1070217 [NASA ADS] [Google Scholar]
- Fang, X., Guerrero, M. A., Marquez-Lugo, R. A., et al. 2014, ApJ, 797, 100 [NASA ADS] [CrossRef] [Google Scholar]
- Guerrero, M. A., & Manchado, A. 1996, ApJ, 472, 711 [NASA ADS] [CrossRef] [Google Scholar]
- Harrison, T. E. 1996, PASP, 108, 1112 [NASA ADS] [CrossRef] [Google Scholar]
- Hazard, C., Terlevich, R., Morton, D. C., Sargent, W. L. W., & Ferland, G. 1980, Nature, 285, 463 [CrossRef] [Google Scholar]
- Iben, I., Jr, Kaler, J. B., Truran, J. W., & Renzini, A. 1983, ApJ, 264, 605 [NASA ADS] [CrossRef] [Google Scholar]
- Jacoby, G. H. 1979, PASP, 91, 754 [NASA ADS] [CrossRef] [Google Scholar]
- Jacoby, G. H., & Ford, H. C. 1983, ApJ, 266, 298 [NASA ADS] [CrossRef] [Google Scholar]
- Kaltenegger, L., & Traub, W. A. 2009, ApJ, 698, 519 [Google Scholar]
- Lau, H. H. B., De Marco, O., & Liu, X. W. 2011, MNRAS, 410, 1870 [Google Scholar]
- Manchado, A., Pottasch, S. R., & Mampaso, A. 1988, A&A, 191, 128 [NASA ADS] [Google Scholar]
- Meaburn, J., & Lopez, J. A. 1996, ApJ, 472, L45 [NASA ADS] [CrossRef] [Google Scholar]
- Meaburn, J., Lopez, J. A., Bryce, M., & Redman, M. P. 1998, A&A, 334, 670 [NASA ADS] [Google Scholar]
- Miller Bertolami, M. M., Althaus, L. G., Serenelli, A. M., & Panei, J. A. 2006, A&A, 449, 313 [NASA ADS] [CrossRef] [EDP Sciences] [Google Scholar]
- Montoro-Molina, B., Guerrero, M. A., Toalá, J. A., & Rodríguez-González, J. B. 2022, ApJ, 934, 18 [NASA ADS] [CrossRef] [Google Scholar]
- Montoro-Molina, B., Guerrero, M. A., & Toalá, J. A. 2023, MNRAS, 526, 4359 [NASA ADS] [CrossRef] [Google Scholar]
- Nakano, S., Sakurai, Y., Hazen, M., et al. 1996, IAU Circ., 6322, 1 [NASA ADS] [Google Scholar]
- Osterbrock, D. E., Fulbright, J. P., Martel, A. R., et al. 1996, PASP, 108, 277 [Google Scholar]
- Pascual, S., Cardiel, N., Gil de Paz, A., et al. 2019, in Highlights on Spanish Astrophysics X, eds. B. Montesinos, A. Asensio Ramos, F. Buitrago, et al., 227 [Google Scholar]
- Pollacco, D. L., Lawson, W. A., Clegg, R. E. S., & Hill, P. W. 1992, MNRAS, 257, 33P [NASA ADS] [CrossRef] [Google Scholar]
- Rodríguez-González, J. B., Santamaría, E., Toalá, J. A., et al. 2022, MNRAS, 514, 4794 [CrossRef] [Google Scholar]
- Rodríguez-González, A., Peña, M., Hernández-Martínez, L., et al. 2023, ApJ, 955, 151 [CrossRef] [Google Scholar]
- Schönberner, D. 1979, A&A, 79, 108 [Google Scholar]
- Seitter, W. C. 1985, Eur. Southern Obs. Conf. Workshop Proc., 21, 253 [NASA ADS] [Google Scholar]
- Simpson, J., Jones, D., Wesson, R., & García-Rojas, J. 2022, Res. Notes. Am. Astron. Soc., 6, 4 [Google Scholar]
- Soker, N. 1997, ApJS, 112, 487 [NASA ADS] [CrossRef] [Google Scholar]
- Steffen, W., Koning, N., Wenger, S., Morisset, C., & Magnor, M. 2011, IEEE Trans. Visual. Comput. Graph., 17, 454 [CrossRef] [Google Scholar]
- Tafoya, D., Toalá, J. A., Vlemmings, W. H. T., et al. 2017, A&A, 600, A23 [NASA ADS] [CrossRef] [EDP Sciences] [Google Scholar]
- Tafoya, D., Toalá, J. A., Unnikrishnan, R., et al. 2022, ApJ, 925, L4 [NASA ADS] [CrossRef] [Google Scholar]
- Tafoya, D., van Hoof, P. A. M., Toalá, J. A., et al. 2023, A&A, 677, L8 [NASA ADS] [CrossRef] [EDP Sciences] [Google Scholar]
- Toalá, J. A., Jiménez-Hernández, P., Rodríguez-González, J. B., et al. 2021a, MNRAS, 503, 1543 [CrossRef] [Google Scholar]
- Toalá, J. A., Lora, V., Montoro-Molina, B., Guerrero, M. A., & Esquivel, A. 2021b, MNRAS, 505, 3883 [CrossRef] [Google Scholar]
- Tody, D. 1993, in Astronomical Data Analysis Software and Systems II, eds. R. J. Hanisch, R. J. V. Brissenden, & J. Barnes, ASP Conf. Ser., 52, 173 [Google Scholar]
- Wesson, R., Barlow, M. J., Liu, X. W., et al. 2008, MNRAS, 383, 1639 [NASA ADS] [CrossRef] [Google Scholar]
- Wesson, R., Jones, D., García-Rojas, J., Boffin, H. M. J., & Corradi, R. L. M. 2018, MNRAS, 480, 4589 [Google Scholar]
All Tables
All Figures
|
Fig. 1. GTC MEGARA emission line profiles of the central ejecta of A 58 (red dashed line) extracted from a 1 |
| In the text | |
|
Fig. 2. GTC MEGARA VPH481-MR [O III] λ5007 (top) and VPH665-HR [N II] λ6584 (bottom) channel maps of A 58. Each map shows the integrated emission in the channles within the LSR velocity range labeled on the upper right corner of each map. Contours corresponding to 2.4%, 5%, 11%, 23%, and 48% of the emission peak (1.71 × 10⁻¹⁴ and 1.61 × 10⁻¹⁵ for [O III] and [N II], respectively) are overlaid in all maps (solid white lines). The approximate location of the central star is marked by a white star. |
| In the text | |
|
Fig. 3. Positions of the centroids and the FWHM (ellipses contours) of 2D Gaussian fits (top) to the emission of [O III] λ5007 (left panels) and [N II] λ6584 (right panels) at each spectral channel of the outflow of A 58 with a color-coded according to their velocity with respect to the Vsys (see text for details). The middle panel show the top panels superimposed over the HST [O III] λ5007 (left) and [N II] λ6584 (right) images of A 58 obtained in 2009 (PI: G. Clayton; Program ID: 11985). The bottom panel present the spatio-kinematic distribution of CO (J = 3 → 2) obtained with ALMA (see Fig. 5 in Tafoya et al. 2022). In these panels the centroids in the velocity range −100 km s−1 ≃ Voffset ≃ +100 km s−1 are plotted in green whereas centroids with velocities < − 100 km s−1 and > + 100 km s−1 are represented by blue and red filled dots, respectively. The approximate location of the central star is marked by a black, red and yellow stars in the top, middle and bottom panels, respectively. |
| In the text | |
|
Fig. 4. Position-velocity (PV) plots in the [O III] λ5007 (red dots) and [N II] λ6584 (blue dots) of the CSPN of A 58 along the PA = 60° and PA = 150°. Positions have been obtained using a 2D Gaussian fit of the emission at each spectral channel (see text for details). The x-axis are showed in LSR system (bot) and respect to the systemic velocity (top) for both panels. The systemic velocity of the ejecta and the location of the CSPN are marked by vertical and horizontal dashed lines, respectively. |
| In the text | |
|
Fig. 5. SHAPE mesh model of V605 Aql and comparison with its HST F502N image of the [O III] λ5007 Å emission line. Top-left: edge-on view of the SHAPE mesh model consisting of a molecular disk (green) and collimated outflows and ionized bipolar outflows (blue and red). The inclination angle of the disk with the plane of the sky is 63°, as derived from the best-fit model. Top-right: projection onto the plane of the sky of the SHAPE mesh model. For comparison the right panel of Fig. 5 in Tafoya et al. (2022) is shown in the upper right corner of this panel. Bottom: HST [O III] image (left) and synthetic image (right). The [O III] synthetic image is computed from the ionized bipolar outflows. The molecular disk does not contribute to the emission, but it rather absorbs the optical emission behind it, which is accounted for adopting an ad hoc emission law for the ionized material. We refer to Sect. 4.1 for details. |
| In the text | |
|
Fig. 6. Spatio-kinematical distribution of the HCN(J = 4 → 3) emission around V605 Aql. Left: ALMA HCN (J = 4 → 3) emission line profile from V605 Aql. Right: velocity field (first moment) of the HCN (J = 4 → 3) emission around V605 Aql in the velocity range of −100 < Voffset (km s−1) < 100 is shown as a color map, according to the color code of the emission line profile in the left panel. The pixels with emission below three times the rms noise level of 0.2 mJy beam−1 were masked. The gray contours show the velocity-integrated emission (zeroth moment) of the HCN (J = 4 → 3) in the velocity range −100 < Voffset (km s−1) < 100. The gray contours are drawn from 3σ on steps of 3σ (where σ = 6.5 mJy beam−1 km s−1 is the rms noise level of the zeroth moment image). The blue and red contours show the zeroth moment emission of the HCN (J = 4 → 3) in the velocity range −165 < Voffset (km s−1) < − 100 and +100 > Voffset (km s−1) > + 180, respectively. The red contours are drawn for 9, 12 and 15 mJy whereas blue contours are drawn for 7, 9 and 11 mJy. |
| In the text | |
Current usage metrics show cumulative count of Article Views (full-text article views including HTML views, PDF and ePub downloads, according to the available data) and Abstracts Views on Vision4Press platform.
Data correspond to usage on the plateform after 2015. The current usage metrics is available 48-96 hours after online publication and is updated daily on week days.
Initial download of the metrics may take a while.