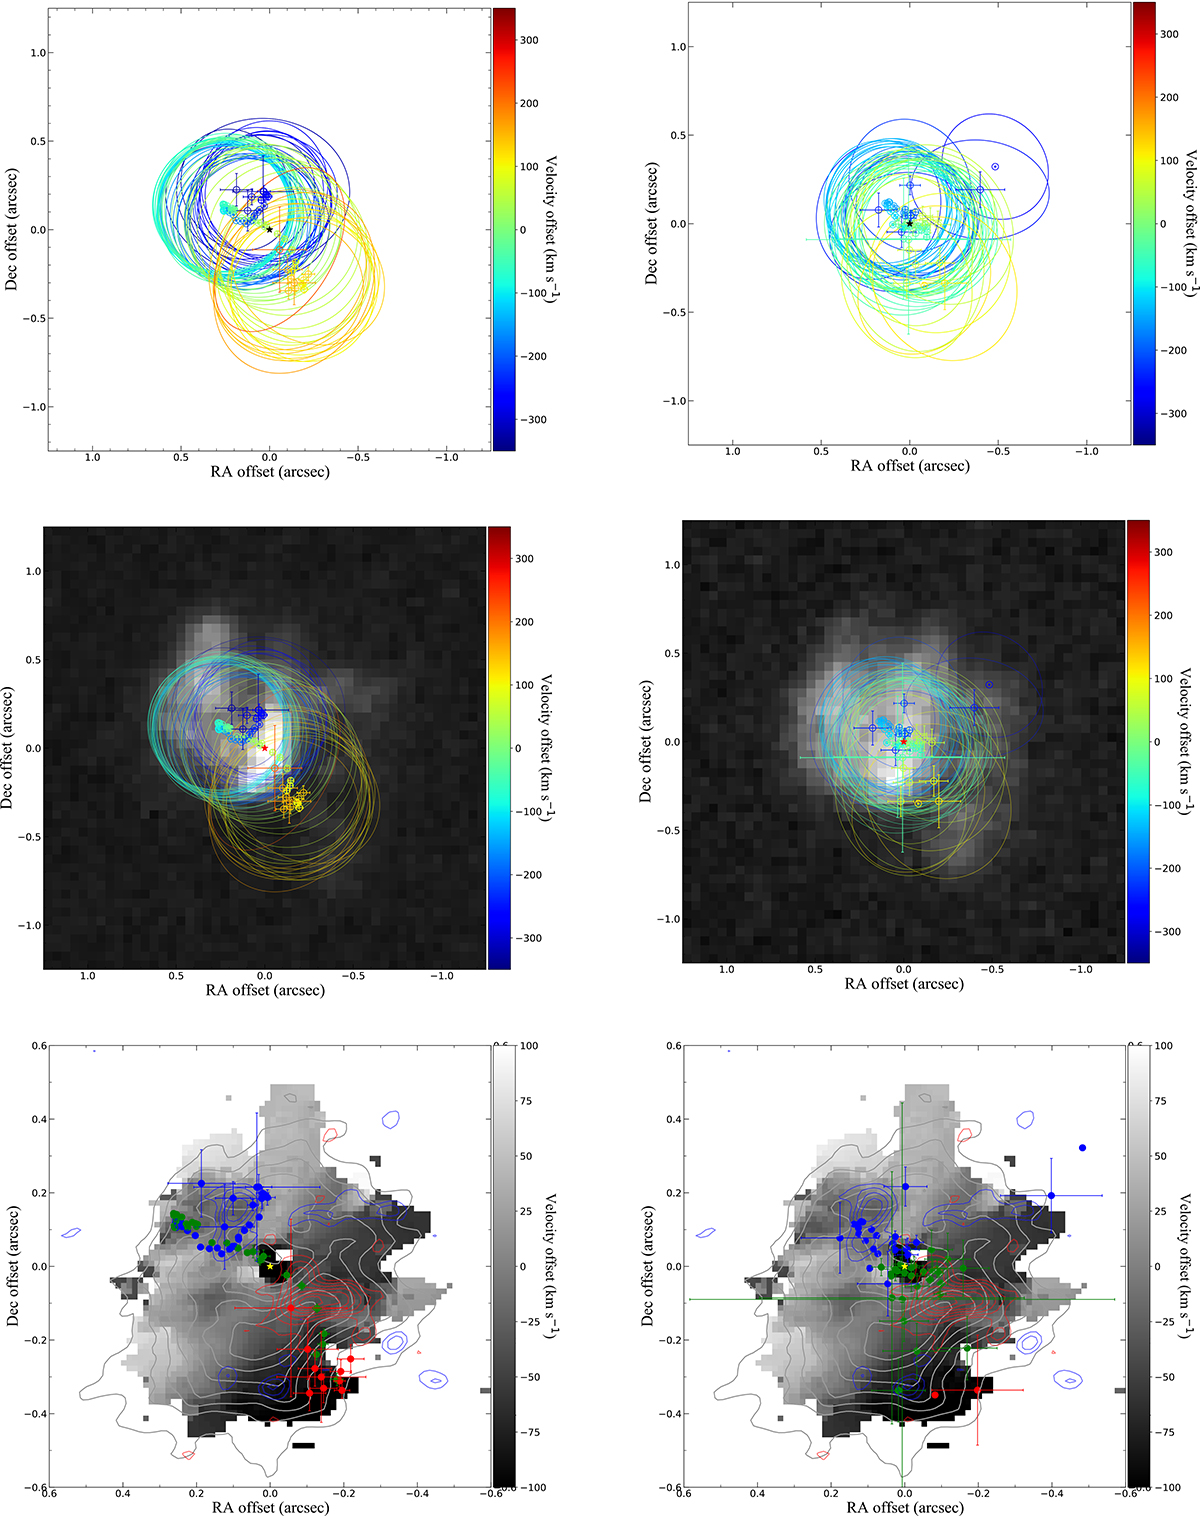
Fig. 3.
Download original image
Positions of the centroids and the FWHM (ellipses contours) of 2D Gaussian fits (top) to the emission of [O III] λ5007 (left panels) and [N II] λ6584 (right panels) at each spectral channel of the outflow of A 58 with a color-coded according to their velocity with respect to the Vsys (see text for details). The middle panel show the top panels superimposed over the HST [O III] λ5007 (left) and [N II] λ6584 (right) images of A 58 obtained in 2009 (PI: G. Clayton; Program ID: 11985). The bottom panel present the spatio-kinematic distribution of CO (J = 3 → 2) obtained with ALMA (see Fig. 5 in Tafoya et al. 2022). In these panels the centroids in the velocity range −100 km s−1 ≃ Voffset ≃ +100 km s−1 are plotted in green whereas centroids with velocities < − 100 km s−1 and > + 100 km s−1 are represented by blue and red filled dots, respectively. The approximate location of the central star is marked by a black, red and yellow stars in the top, middle and bottom panels, respectively.
Current usage metrics show cumulative count of Article Views (full-text article views including HTML views, PDF and ePub downloads, according to the available data) and Abstracts Views on Vision4Press platform.
Data correspond to usage on the plateform after 2015. The current usage metrics is available 48-96 hours after online publication and is updated daily on week days.
Initial download of the metrics may take a while.