| Issue |
A&A
Volume 688, August 2024
|
|
|---|---|---|
| Article Number | L21 | |
| Number of page(s) | 6 | |
| Section | Letters to the Editor | |
| DOI | https://doi.org/10.1051/0004-6361/202450496 | |
| Published online | 09 August 2024 | |
Letter to the Editor
Non-thermal radio emission in Sakurai’s Object
1
Department of Geodesy, Institute of Geodesy and Civil Engineering, Faculty of Geoengineering, University of Warmia and Mazury, ul. Oczapowskiego 2, 10-719 Olsztyn, Poland
2
Royal Observatory of Belgium, Ringlaan 3, 1180 Brussels, Belgium
3
Jodrell Bank Centre for Astrophysics, Alan Turing Building, University of Manchester, Manchester M13 9PL, UK
4
Universität Innsbruck, Institut für Astro- und Teilchenphysik, Technikerstr. 25/8, 6020 Innsbruck, Austria
5
Universidad Católica del Norte, Instituto de Astronomía, Av. Angamos 0610, Antofagasta, Chile
6
Universidad Central de Chile, Facultad de Ingeniería y Arquitectura, Av. Francisco de Aguirre 0405, La Serena, Coquimbo, Chile
7
Department of Space, Earth and Environment, Chalmers University of Technology, Onsala Space Observatory, 439 92 Onsala, Sweden
8
Instituto de Radioastronomía y Astrofísica, Universidad Nacional Autónoma de México, Morelia, 58089 Michoacán, Mexico
Received:
24
April
2024
Accepted:
25
July
2024
Abstract
Context. The very late thermal pulse (VLTP) affects the evolution of ∼20% of 1–8 M⊙ stars, repeating the last red giant phases within a few years and leading to the formation of a new, but hydrogen-poor, nebula within the old planetary nebula. The strong dust formation in the latter obscures the optical and near-infrared radiation of the star.
Aims. We aimed to determine the reheating timescale of the central star in Sakurai’s Object, which is an important constraint for the poorly understood VLTP evolution.
Methods. We observed the radio continuum emission of Sakurai’s Object for almost 20 years, from 2004 to 2023. Continuous, multi-frequency observations proved to be essential for distinguishing between phases dominated by photoionization and shock ionization.
Results. The flux density fluctuates by more than a factor of 40 within months to years. The spectral index remained negative between 2006 and 2017 and has been close to zero since 2019. The emission region has been only barely resolved since 2021.
Conclusions. Non-thermal radio emission observed from 2004 to 2017 traces shocks induced by wind interactions due to discrete mass-loss events. Thermal emission dominates from 2019 to 2023 and may indicate photoionization of the nebula by the central star.
Key words: stars: evolution / stars: jets / stars: mass-loss / stars: winds / outflows / planetary nebulae: general / planetary nebulae: individual: Sakurai’s Object
Corresponding author; This email address is being protected from spambots. You need JavaScript enabled to view it.
© The Authors 2024
 Open Access article, published by EDP Sciences, under the terms of the Creative Commons Attribution License (https://creativecommons.org/licenses/by/4.0), which permits unrestricted use, distribution, and reproduction in any medium, provided the original work is properly cited.
This article is published in open access under the Subscribe to Open model. This email address is being protected from spambots. You need JavaScript enabled to view it. to support open access publication.
1. Introduction
Low- and intermediate-mass stars (1 M⊙ < M⋆ < 8 M⊙) play a vital role in the chemical evolution of the Galaxy. Up to 90% of their initial mass is returned to the interstellar medium along with newly formed nucleosynthesis products, most of it during the asymptotic giant branch (AGB) phase of their evolution. AGB stars are the main source of s-process elements and interstellar carbon dust, and their contribution of C, N, and F is at least comparable to that of supernovae (Kobayashi et al. 2011).
The main site of carbon production at the end of the AGB phase is the helium-burning shell, which is separated from the hydrogen-burning shell by a small inter-shell region. Helium burning is activated in a thermal pulse (helium flash) after the helium has sufficiently accumulated during the rest phases of hydrogen burning. The synthesized nuclear material from the thermal pulse is then transported to the surface by the convective shell. Thermal pulses trigger heavy mass loss due to the increase in luminosity in conjunction with the higher opacity in the convective zone. When the envelope mass is reduced to 10−3 M⊙, the star evolves very quickly to higher effective temperatures. It ionizes the ejecta, and a planetary nebula (PN) becomes visible. The central star of the PN eventually evolves into a H-rich white dwarf.
Stellar evolutionary models predict that the last thermal pulse occurs after the extinction of the nuclear burning in the hydrogen shell on the white dwarf cooling track; this is now known as a very late thermal pulse (VLTP; Schoenberner 1979; Iben & Renzini 1983). As a result of the VLTP, the star retraces its evolution and becomes a ‘born-again’ red giant. The remaining hydrogen shell is consumed by the pulse-driven convective zone, leaving a hydrogen-free star surface that is now ∼50% C and up to 50% He by mass, reflecting the intershell abundances. Similar abundances are observed in [Wolf-Rayet] ([WR]) stars (central stars of PNe whose spectra mimic the population I Wolf-Rayet stars), which suggests that some of these objects might have formed via the VLTP (see Todt & Hamann 2015). The mass ejected due to the VLTP enriches the interstellar medium mainly with helium and carbon and is the main site for the production of carbon dust (Toalá et al. 2021) and some specific isotopes in the Universe, including 13C (Hajduk et al. 2005). Traces of VLTP ejecta have been identified in primitive meteorites (Amari et al. 2001).
Only two objects have been observed so far during this very short evolutionary period: Sakurai’s Object (Duerbeck & Benetti 1996) and V605 Aql (Wood & Faulkner 1973). Other PNe may have experienced a VLTP in the past. The best-known examples are A 30, A 78 (Toalá et al. 2021, and references therein), HuBi 1 (Guerrero et al. 2018), and WR 72 (Gvaramadze et al. 2020). In this Letter we focus on Sakurai’s Object, the first well-observed example of a VLTP.
2. Evolution of Sakurai’s Object
Sakurai’s Object (V4334 Sgr), the central star of a faint, old (and previously unknown) PN, erupted sometime between 1990 and 1996 (Pollacco 1999). Optical observations revealed the cooling and expanding photosphere of the star (Duerbeck et al. 1997). This was followed by hydrogen depletion and synthesis of s-process elements and lithium in the atmosphere (Asplund et al. 1999). The star eventually disappeared from view in the optical following an R CrB-like event. Infrared observations revealed the formation of hot dust and molecules (Eyres et al. 1998a). Since then, the source has been monitored in the infrared by several groups (see e.g. Hinkle et al. 2020; Evans et al. 2022, and references therein).
In 2001, soon after the star fully vanished in the optical, emission lines appeared (Kerber et al. 2002). The lines declined for a few years after the first detection, which was consistent with a cooling shock (van Hoof et al. 2007). Since 2008, the lines have been continuously brightening (van Hoof et al. 2018).
Sakurai’s Object was first observed at radio wavelengths in 1997 and 2002. The observations showed only the old, H-rich, extended (34 ″ in diameter) PN around the central star (Eyres et al. 1998b; Eyres 2002; Hajduk et al. 2008). Hajduk et al. (2005) observed a faint point source in the centre of the old nebula with the Karl G. Jansky Very Large Array (VLA) in New Mexico in 2004. The source was interpreted as free-free emission from the photoionized region but showed large variability in the following years, which suggested shock-emission instead (van Hoof et al. 2007).
Observations of Sakurai’s Object implied a born-again timescale of 5–10 yr, one to two orders faster than predicted by evolutionary models (Duerbeck & Benetti 1996). Different methods, which adopt the physics of convective processes as well as numerical schemes, have led to new, faster-evolving model predictions (Herwig 2001; Miller Bertolami et al. 2006). Lawlor & MacDonald (2003) predicted a double-loop evolution of Sakurai’s Object in the Hertzsprung-Russell diagram, which was later confirmed by Hajduk et al. (2005) and Miller Bertolami et al. (2006). According to the current understanding of this phenomenon, the remaining hydrogen from the envelope is mixed into the upper layers of the helium-burning shell and ignites separately in a hydrogen ingestion flash. The first loop from the hydrogen ingestion flash, with an extremely rapid return to high stellar temperatures, is followed by a much slower loop caused by the helium flash. According to these models, the temperature of the source should have returned to 100 kK by today, but current observations do not suggest such a rapid evolution (van Hoof et al. 2018). The strong dust formation that occurred during the mass-loss phase has hidden the core of Sakurai’s Object from direct optical and infrared observations very efficiently from early on (Kimeswenger & Koller 2002).
In this work we looked inside this dusty cocoon at radio wavelengths to indirectly infer the temperature evolution and mass-loss history.
3. Radio observations
3.1. VLA observations
The radio emission from Sakurai’s Object has been monitored since 2004 using the VLA (Table 1). While we used 3C286 for flux calibration, J1733−1304 was used as a phase calibrator.
Dates, frequency bands, and array configurations of VLA radio observations of Sakurai’s Object used in this work.
Observations before 2012 used two 64 MHz spectral channels and after 2012 64 64 MHz spectral channels, for an effective bandwidth of 4 GHz for the X/C band. 32 spectral channels were used in the L band, for an effective bandwidth of 2 GHz.
As one of the two spectral channels in 2004 and 2005 generated an artificial source in the phase centre, causing a weak interference pattern in the image, they were flagged. We created the image using the remaining spectral channel. The images were cleaned using the Common Astronomy Software Applications for Radio Astronomy (CASA; CASA Team 2022) using Briggs’ weighting.
We fitted a compact source in the centre of the old PN, at the position of the central star, with a 2D Gaussian model via CASA. The fitting yielded the peak flux density, integrated flux density, and source position of the Gaussian. We used the peak flux density in the cases where the source remained unresolved and the integrated flux density for configurations where the source was resolved. The peak value was less sensitive to a variable background in cases where the synthesized beam was relatively large and the source was contaminated by the old PN. The source was slightly resolved in the X band in 2021, 2022, and 2023, and in the C band in 2022. Due to the low elevation of the object at the VLA site (maximum elevation of 39 degrees), the synthesized beam is elongated in the N–S direction. This affected the size measurements (less resolved in the N–S direction) and in some cases the flux measurements (e.g. in the L band in 2017 and 2021, the integrated flux is much higher than the peak flux, although the source was unresolved).
An old, extended, optically thin nebula is present in the B configuration at 1.5 GHz as well as in the CnB and DnC configurations. The old nebula is resolved out in other observations and does not affect the measurements of the central source.
3.2. ATCA observations
Sakurai’s Object was observed with the Australia Telescope Compact Array (ATCA) on October 27, 2008. The rest frequencies were centred at 8.64 and 4.80 GHz. The flux calibrator was 1934 − 638, and the phase calibrator was 1752 − 225. We estimated the flux density of the phase calibrator to be 0.288 ± 0.014 Jy at 4.8 GHz and 0.344 ± 0.024 Jy at 8.46 GHz.
4. Radio evolution of Sakurai’s Object
We confirm the 2004 detection by Hajduk et al. (2005) but do not detect the source reported by van Hoof et al. (2007) in our reprocessed 2005 data. Consequently, we can state that the radio flux of Sakurai’s Object declined between 2004 and 2005 because an upper limit in 2005 was below the 2004 detection. Hence, the first maximum must have occurred between December 2002 and February 2005, but was unfortunately not covered by our observations.
The compact radio source reappeared in 2006 (Fig. 1). The flux density in 2007 continued to increase and was more than tenfold higher than in 2004. The 2008 observation yielded a four times lower flux density compared to 2007 at 4.8 GHz. This indicates that the second maximum occurred in 2007–2008.
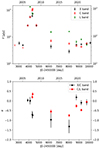 |
Fig. 1. Evolution of the radio continuum flux density and spectral index in Sakurai’s Object between 2002 and 2023. Top: flux density in the X, C, and L bands. Upsidedown triangles mark three-sigma upper limits. Bottom: X/C-band and C/L-band spectral indices. The error bars mark a one-sigma error. |
In 2012 the flux density returned to the 2004 level. Then it faded even further in 2017 in the X and C bands. The 2017 L-band flux density is affected by the old PN. The error bars are larger due to a lower flux density. Interestingly, the X/C-band spectral index, α, decreased from 0.03 ± 0.09 in 2006 to −1.31 ± 0.36 in 2017, and the C/L-band index decreased from 0.19 ± 0.09 in 2007 to −0.75 ± 0.07 in 2017 (Fig. 1).
The flux density intensified again in 2019. The X/C-band spectral index suddenly increased from −1.31 to 0.18 ± 0.15 at this time, which suggests that freshly ionized electrons appeared. The flux density and spectral index decreased in 2021 and remained at the same level in 2022–2023. This indicates that we missed the third maximum, which must have occurred between 2017 and 2019.
5. Discussion
Non-thermal emission is observed in proto-PNe. It is characterized by a variability timescale of the order of months and negative spectral indices. Cohen et al. (2006) detected non-thermal emission with a spectral index of α = −0.8 in OH 354.88−0.54, which was due to a shocked interaction between the fast stellar wind and the nebular shell. IRAS 15103−5754 intermittently showed non-thermal emission with a varying flux density and spectral index (Suárez et al. 2015). Bains et al. (2009) observed non-thermal emission in three proto-PNe. Cerrigone et al. (2017) monitored non-thermal emission in five proto-PNe, which was caused by magnetic fields induced in shocks due to interacting winds, analogous to the interacting winds in binary stars with WR components. Ortega et al. (2024) discovered a non-thermal jet in the proto-PN IRAS 18443-0231.
During the PN phase, synchrotron emission is either not present or is screened or suppressed by the thermal emission from the nebular shell (Hajduk et al. 2018). Spectral indices range from −0.1 for the optically thin frequency domain of the spectrum to +2.0 for the optically thick. Radio fluxes evolve on a timescale comparable to the evolutionary timescale of the central star and/or nebular expansion, which is typically too long to be observed. However, Zijlstra et al. (2008) managed to observe a slow evolution of radio flux in NGC 7027 due to the expansion of the nebula and the decrease in the number of ionizing photons from the central star.
The emission observed in Sakurai’s Object in 2004 was interpreted as thermal emission from freshly ionized ejecta by the central star (Hajduk et al. 2005). In such a case, optical and radio fluxes should increase with the increasing temperature and number of ionizing photons from the star, as predicted by evolutionary models. However, the observed decrease in the optical emission lines instead later indicated a shock origin (van Hoof et al. 2007). The decrease in the radio flux density after the 2007–2008 maximum rules out photoionization by the central star.
The negative X/C-band spectral index in 2006 and 2007 suggests synchrotron radiation from shocks (Figs. 1 and 2). The spectral index and flux decreased between 2007 and 2017. This suggests a decreasing contribution from free-free emission in the shock-ionized ejecta, which flattened the observed spectral index close to the maximum. Alternatively, it also suggests a loss of the energy of the electrons in the shock, causing a steepening of the radio spectrum.
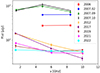 |
Fig. 2. Radio spectrum of Sakurai’s Object between 2006 and 2023. |
Radio emission from Sakurai’s Object between 2004 and 2017 showed similar properties to proto-PNe. It was non-thermal and highly variable. We attribute the observed maxima in the radio light curve to shocks induced by discrete mass ejection events. The photoionized shell, if present, had a much smaller contribution to the flux density than the non-thermal component. The timescale of the mass-loss variations is much shorter than the evolutionary timescale of the central star.
Sakurai’s Object bears some resemblance to young stellar objects. Their radio spectrum consists of a few components. The stellar jet has a positive spectral index (+0.6), while distant lobes show a synchrotron component (with an average spectral index of −0.55 determined by Purser et al. 2016). Similar behaviour to an outburst observed in 2006–2007 in Sakurai’s Object (increasing flux and decreasing spectral index) was recorded for a protostar by Obonyo et al. (2021) and was interpreted as an expanding bubble of gas. A similar effect is observed in supernova outbursts (Yadav et al. 2014).
Interestingly, the maxima of the radio light curve occurred close to dust formation episodes observed in the infrared observations of Sakurai’s Object. Evans et al. (2004) reported an increasing mass-loss rate between 2001 and 2003 marked by a dramatic increase in flux density at 450 and 850 μm, which may be related to the first maximum in radio between 2002 and 2004. A mass-loss event in 2008 was reported by Evans et al. (2020). The 2007–2008 maximum in radio flux could correspond to this mass-loss episode. Another mass-loss event was reported by Evans et al. (2022) between 2013 and 2020. This could correspond to the increase in the flux density between 2017 and 2019.
The radio emission of Sakurai’s Object became less variable between 2019 and 2023. In 2019 the spectral index reached a value of +0.18 ± 0.15. In 2021–2022 the spectral index was close to zero. The source became resolved in 2021. This suggests thermal emission and a low brightness temperature. The radio light curve does not show a decline after the 2017–2019 maximum, in contrast to the behaviour observed after the 2007–2008 and 2002–2004 maxima. This suggests that the ionized material is not recombining and that a stable source of ionizing photons may exist.
The position of the radio source changed. Radio emission during the strongest maximum in 2007 was centred to the east of the presumed position of the central star, inside the disk seen at 233 GHz by Tafoya et al.(2023, see our Fig. 3). The projected distance between the position of the source in September and October 2007 would require a tangential velocity of the order of 10 000 km s−1, which was not observed in Sakurai’s Object. Thus, we conclude that different regions contributed to the radio emission at different times.
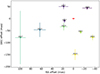 |
Fig. 3. Positions of the radio emission from the VLA X-band observations relative to the position of the 233 GHz radio emission from Tafoya et al. (2023), which is marked with the red symbol. The 2004 observation is ignored due to large errors. |
In 2012 and 2017 the emission appeared to originate farther away from the central star, where the density was lower and shock recombination took longer. In 2019–2023 the emission originated from a different region than in 2004–2017 and was centred south of the central star. The change in the position of the radio source between 2019 and 2023 corresponds to a tangential velocity of 440 km/s at a distance of 3 kpc. This indicates a possible increasing contribution of emission from more distant regions, or expansion.
The emission has been resolved since 2021. The 2023 image shows the largest extent: a deconvolved full width at half maximum (FWHM) of 0.40″ in 2023 compared to 0.28″ in 2021 and 0.20″ in 2022. However, the uncertainties are too large to determine the expansion rate precisely.
Tafoya et al. (2023) observed an H12CN bipolar emission extending more than 0.1″ from the star and an expanding disk. The radio source appears to be aligned with the bipolar outflow and perpendicular to the dusty disk. The radial velocities of the H12CN are between −350 and 300 km/s. Radio continuum emission may be the counterpart of this structure.
The extent of the radio emission appears to be more compact than the separation of the expanding blobs (0.6″) previously reported by Hinkle et al. (2020). However, radio emission may originate from the inner part of these blobs facing the central star. The centre of the radio continuum emission observed in 2019–2023 is moving to a position south of the central star (Fig. 3). This indicates that the southern blob may be exposed to the radiation from the central star.
Radio images do not show the structure of the source in detail. It may contain an unresolved and a resolved component. Thus, the vicinity of the central star may also contribute to radio emission. The inner part of the disk obscuring the central star may be photoionized by the central star.
It is not clear whether the episodes of mass ejection observed in the radio are related to the mass loss from the star itself or to the accretion processes in a disk or a torus around the central star. The latter option would favour a binary evolution scenario.
6. Conclusions
The VLA monitoring of Sakurai’s Object allowed us to characterize the radio emission evolution of a VLTP object. Sakurai’s Object showed non-thermal, highly variable emission in 2004–2017 and an increasing contribution of thermal emission in 2019–2023. We attribute the observed evolution to intermittent shocks due to discrete mass-loss events. The steepening spectral index between 2006 and 2017 indicates a diminishing contribution from the thermal component, possibly due to recombination occurring in the shocks. Alternatively, it may indicate a decreasing energy of the electrons in the shock. Further monitoring will unambiguously reveal thermal radio emission due to the photoionization of the ejecta by the reheating central star. Our observations can help us identify VLTP events, expected to occur at the rate of one per decade in our Galaxy, as transients in high-sensitivity radio surveys.
Acknowledgments
The National Radio Astronomy Observatory is a facility of the National Science Foundation operated under cooperative agreement by Associated Universities, Inc. The Australia Telescope Compact Array is part of the Australia Telescope National Facility (https://ror.org/05qajvd42) which is funded by the Australian Government for operation as a National Facility managed by CSIRO. We acknowledge the Gomeroi people as the Traditional Owners of the Observatory site. Computations were carried out using the computers of Centre of Informatics Tricity Academic Supercomputer & Network. D.B. acknowledges support by Fondecyt grant 11230261.
References
- Amari, S., Nittler, L. R., Zinner, E., Lodders, K., & Lewis, R. S. 2001, ApJ, 559, 463 [NASA ADS] [CrossRef] [Google Scholar]
- Asplund, M., Lambert, D. L., Kipper, T., Pollacco, D., & Shetrone, M. D. 1999, A&A, 343, 507 [NASA ADS] [Google Scholar]
- Bains, I., Cohen, M., Chapman, J. M., Deacon, R. M., & Redman, M. P. 2009, MNRAS, 397, 1386 [CrossRef] [Google Scholar]
- CASA Team (Bean, B., et al.) 2022, PASP, 134, 114501 [NASA ADS] [CrossRef] [Google Scholar]
- Cerrigone, L., Umana, G., Trigilio, C., et al. 2017, MNRAS, 468, 3450 [CrossRef] [Google Scholar]
- Cohen, M., Chapman, J. M., Deacon, R. M., et al. 2006, MNRAS, 369, 189 [NASA ADS] [CrossRef] [Google Scholar]
- Duerbeck, H. W., & Benetti, S. 1996, ApJ, 468, L111 [NASA ADS] [CrossRef] [Google Scholar]
- Duerbeck, H. W., Benetti, S., Gautschy, A., et al. 1997, AJ, 114, 1657 [CrossRef] [Google Scholar]
- Evans, A., Geballe, T. R., Tyne, V. H., et al. 2004, MNRAS, 353, L41 [NASA ADS] [CrossRef] [Google Scholar]
- Evans, A., Gehrz, R. D., Woodward, C. E., et al. 2020, MNRAS, 493, 1277 [NASA ADS] [CrossRef] [Google Scholar]
- Evans, A., Banerjee, D. P. K., Geballe, T. R., et al. 2022, MNRAS, 511, 713 [NASA ADS] [CrossRef] [Google Scholar]
- Eyres, S. P. S. 2002, Ap&SS, 279, 69 [NASA ADS] [CrossRef] [Google Scholar]
- Eyres, S. P. S., Evans, A., Geballe, T. R., Salama, A., & Smalley, B. 1998a, MNRAS, 298, L37 [NASA ADS] [CrossRef] [Google Scholar]
- Eyres, S. P. S., Richards, A. M. S., Evans, A., & Bode, M. F. 1998b, MNRAS, 297, 905 [CrossRef] [Google Scholar]
- Guerrero, M. A., Fang, X., Miller Bertolami, M. M., et al. 2018, Nat. Astron., 2, 784 [NASA ADS] [CrossRef] [Google Scholar]
- Gvaramadze, V. V., Kniazev, A. Y., Gräfener, G., & Langer, N. 2020, MNRAS, 492, 3316 [CrossRef] [Google Scholar]
- Hajduk, M., Zijlstra, A. A., Herwig, F., et al. 2005, Science, 308, 231 [NASA ADS] [CrossRef] [Google Scholar]
- Hajduk, M., Gesicki, K., van Hoof, P. A. M., Lopez, J. A., & Zijlstra, A. A. 2008, ASP Conf. Ser., 391, 163 [NASA ADS] [Google Scholar]
- Hajduk, M., van Hoof, P. A. M., Śniadkowska, K., et al. 2018, MNRAS, 479, 5657 [NASA ADS] [CrossRef] [Google Scholar]
- Herwig, F. 2001, ApJ, 554, L71 [NASA ADS] [CrossRef] [Google Scholar]
- Hinkle, K. H., Joyce, R. R., Matheson, T., Lacy, J. H., & Richter, M. J. 2020, ApJ, 904, 34 [NASA ADS] [CrossRef] [Google Scholar]
- Iben, I. Jr., & Renzini, A. 1983, ARA&A, 21, 271 [NASA ADS] [CrossRef] [Google Scholar]
- Kerber, F., Pirzkal, N., De Marco, O., et al. 2002, ApJ, 581, L39 [NASA ADS] [CrossRef] [Google Scholar]
- Kimeswenger, S., & Koller, J. 2002, Ap&SS, 279, 149 [NASA ADS] [CrossRef] [Google Scholar]
- Kobayashi, C., Karakas, A. I., & Umeda, H. 2011, MNRAS, 414, 3231 [Google Scholar]
- Lawlor, T. M., & MacDonald, J. 2003, ApJ, 583, 913 [NASA ADS] [CrossRef] [Google Scholar]
- Miller Bertolami, M. M., Althaus, L. G., Serenelli, A. M., & Panei, J. A. 2006, A&A, 449, 313 [NASA ADS] [CrossRef] [EDP Sciences] [Google Scholar]
- Obonyo, W. O., Lumsden, S. L., Hoare, M. G., Kurtz, S. E., & Purser, S. J. D. 2021, MNRAS, 501, 5197 [NASA ADS] [CrossRef] [Google Scholar]
- Ortega, M. E., Petriella, A., & Paron, S. 2024, MNRAS, 532, 4446 [NASA ADS] [CrossRef] [Google Scholar]
- Pollacco, D. 1999, MNRAS, 304, 127 [CrossRef] [Google Scholar]
- Purser, S. J. D., Lumsden, S. L., Hoare, M. G., et al. 2016, MNRAS, 460, 1039 [NASA ADS] [CrossRef] [Google Scholar]
- Schoenberner, D. 1979, A&A, 79, 108 [NASA ADS] [Google Scholar]
- Suárez, O., Gómez, J. F., Bendjoya, P., et al. 2015, ApJ, 806, 105 [CrossRef] [Google Scholar]
- Tafoya, D., van Hoof, P. A. M., Toalá, J. A., et al. 2023, A&A, 677, L8 [NASA ADS] [CrossRef] [EDP Sciences] [Google Scholar]
- Toalá, J. A., Jiménez-Hernández, P., Rodríguez-González, J. B., et al. 2021, MNRAS, 503, 1543 [CrossRef] [Google Scholar]
- Todt, H., & Hamann, W. R. 2015, in Wolf-Rayet Stars, eds. W. R. Hamann, A. Sander, & H. Todt, 253 [Google Scholar]
- van Hoof, P. A. M., Hajduk, M., Zijlstra, A. A., et al. 2007, A&A, 471, L9 [NASA ADS] [CrossRef] [EDP Sciences] [Google Scholar]
- van Hoof, P. A. M., Kimeswenger, S., Van de Steene, G., et al. 2018, Galaxies, 6, 79 [NASA ADS] [CrossRef] [Google Scholar]
- Wood, P. R., & Faulkner, D. J. 1973, ApJ, 181, 147 [NASA ADS] [CrossRef] [Google Scholar]
- Yadav, N., Ray, A., Chakraborti, S., et al. 2014, ApJ, 782, 30 [NASA ADS] [CrossRef] [Google Scholar]
- Zijlstra, A. A., van Hoof, P. A. M., & Perley, R. A. 2008, ApJ, 681, 1296 [NASA ADS] [CrossRef] [Google Scholar]
Appendix A: Details of the radio observations of Sakurai’s Object
Radio observations of Sakurai’s Object. The columns indicate the date of observation, central frequency, beam size and position angle, deconvolved FWHMs and position angle, peak and integrated flux density, and source coordinates. A ‘U’ in the deconvolved size column stands for an unresolved source.
All Tables
Dates, frequency bands, and array configurations of VLA radio observations of Sakurai’s Object used in this work.
Radio observations of Sakurai’s Object. The columns indicate the date of observation, central frequency, beam size and position angle, deconvolved FWHMs and position angle, peak and integrated flux density, and source coordinates. A ‘U’ in the deconvolved size column stands for an unresolved source.
All Figures
|
Fig. 1. Evolution of the radio continuum flux density and spectral index in Sakurai’s Object between 2002 and 2023. Top: flux density in the X, C, and L bands. Upsidedown triangles mark three-sigma upper limits. Bottom: X/C-band and C/L-band spectral indices. The error bars mark a one-sigma error. |
| In the text | |
|
Fig. 2. Radio spectrum of Sakurai’s Object between 2006 and 2023. |
| In the text | |
|
Fig. 3. Positions of the radio emission from the VLA X-band observations relative to the position of the 233 GHz radio emission from Tafoya et al. (2023), which is marked with the red symbol. The 2004 observation is ignored due to large errors. |
| In the text | |
Current usage metrics show cumulative count of Article Views (full-text article views including HTML views, PDF and ePub downloads, according to the available data) and Abstracts Views on Vision4Press platform.
Data correspond to usage on the plateform after 2015. The current usage metrics is available 48-96 hours after online publication and is updated daily on week days.
Initial download of the metrics may take a while.