Open Access
Fig. 1.
Download original image
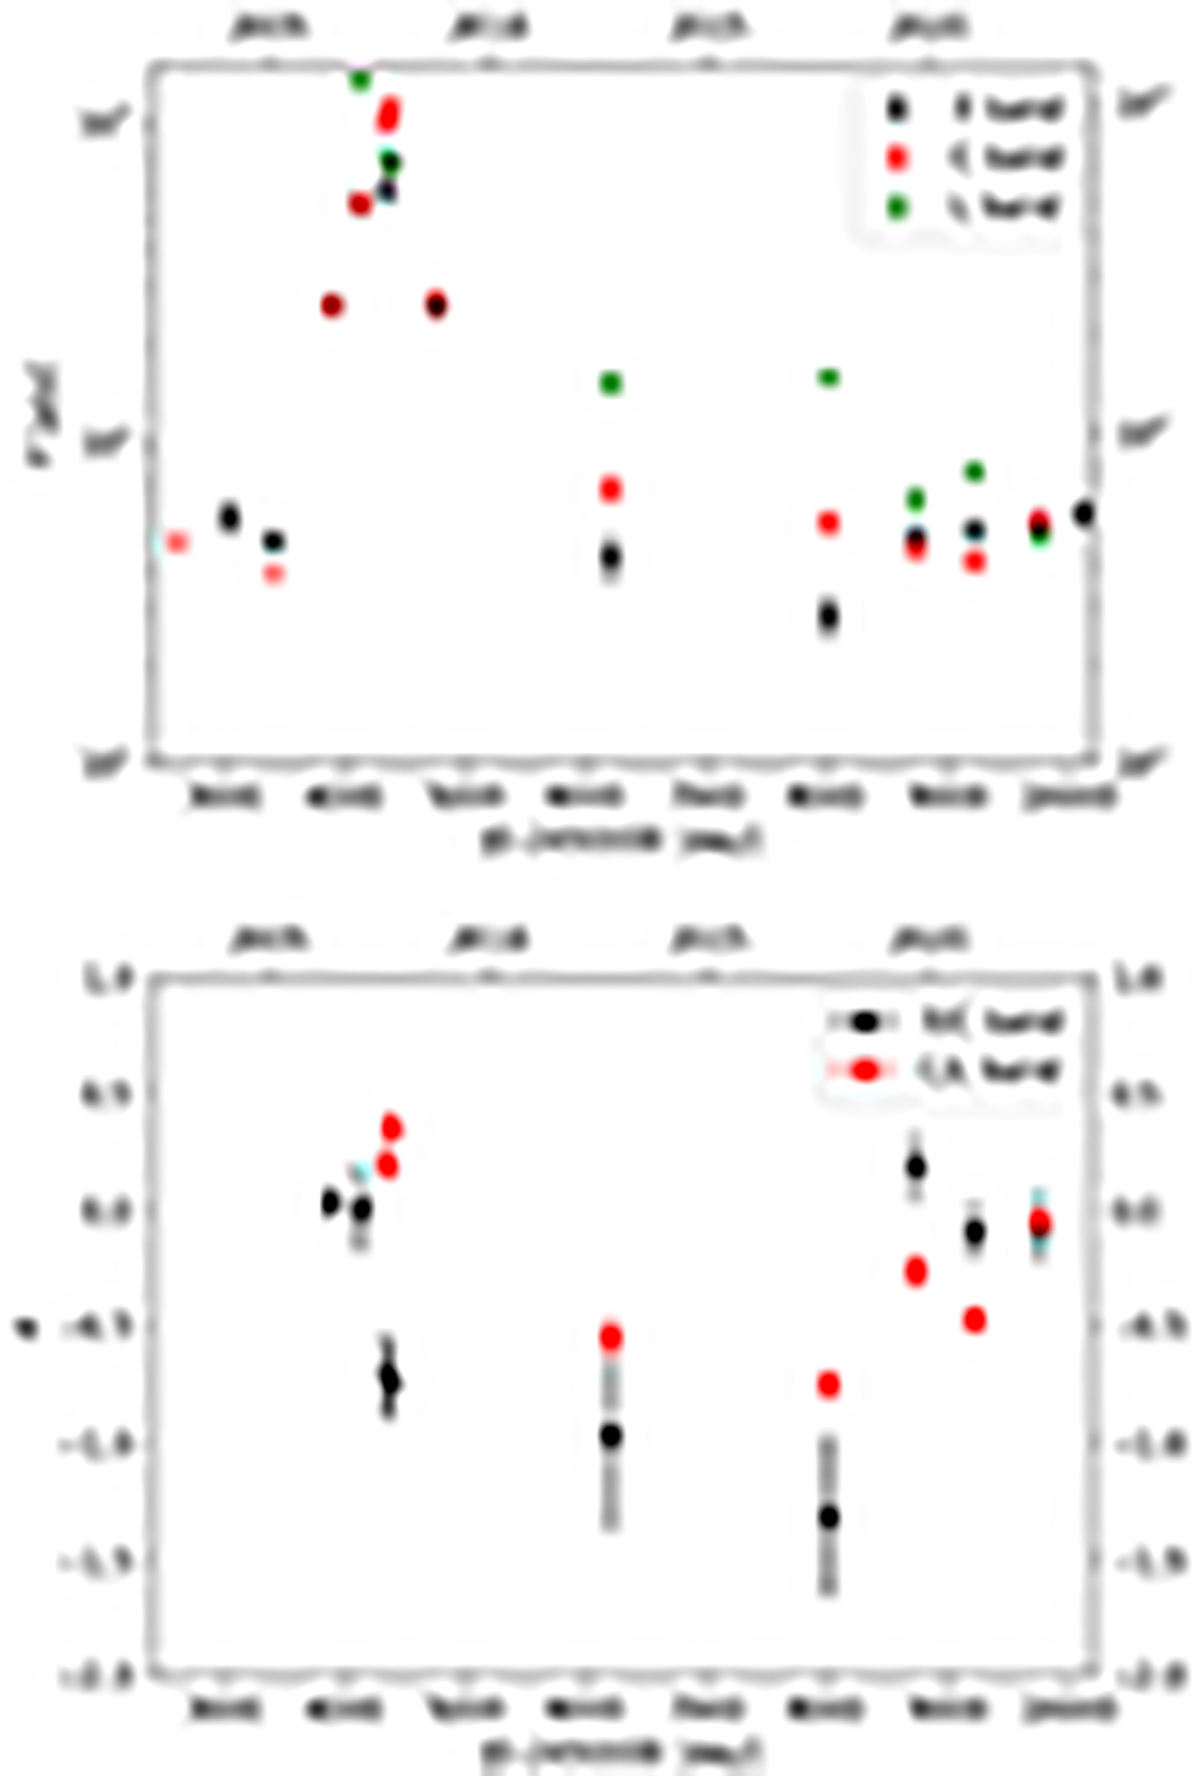
Evolution of the radio continuum flux density and spectral index in Sakurai’s Object between 2002 and 2023. Top: flux density in the X, C, and L bands. Upsidedown triangles mark three-sigma upper limits. Bottom: X/C-band and C/L-band spectral indices. The error bars mark a one-sigma error.
Current usage metrics show cumulative count of Article Views (full-text article views including HTML views, PDF and ePub downloads, according to the available data) and Abstracts Views on Vision4Press platform.
Data correspond to usage on the plateform after 2015. The current usage metrics is available 48-96 hours after online publication and is updated daily on week days.
Initial download of the metrics may take a while.