Fig. 2.
Download original image
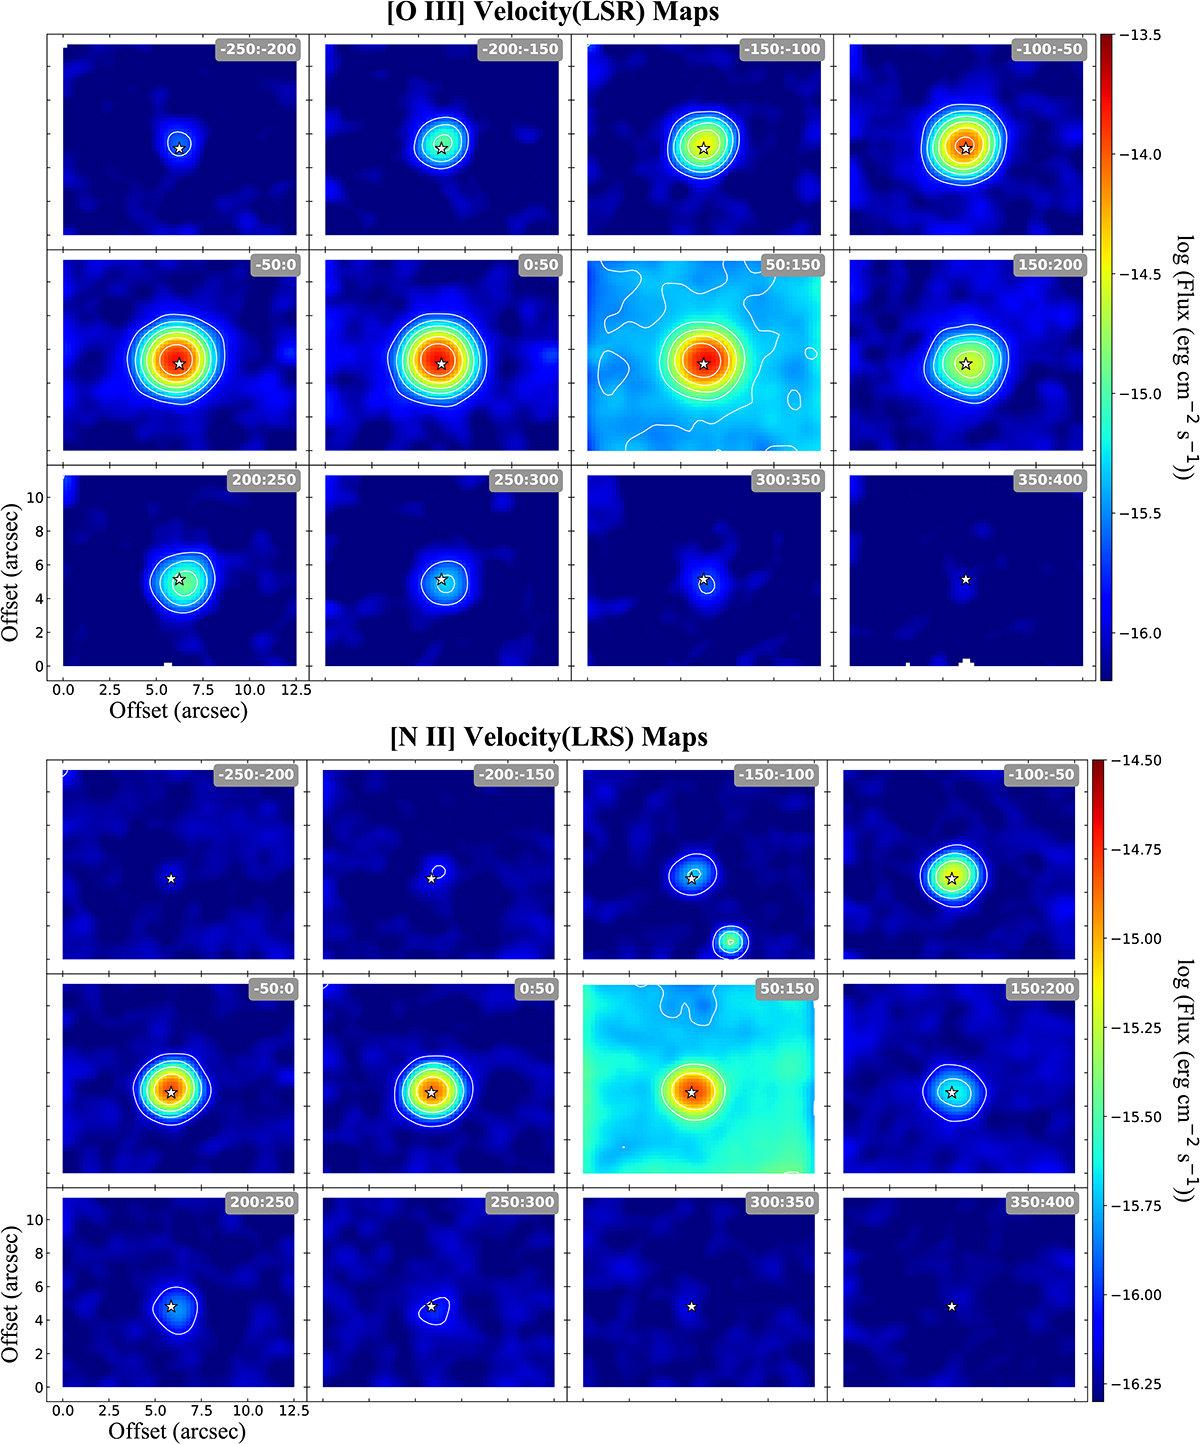
GTC MEGARA VPH481-MR [O III] λ5007 (top) and VPH665-HR [N II] λ6584 (bottom) channel maps of A 58. Each map shows the integrated emission in the channles within the LSR velocity range labeled on the upper right corner of each map. Contours corresponding to 2.4%, 5%, 11%, 23%, and 48% of the emission peak (1.71 × 10⁻¹⁴ and 1.61 × 10⁻¹⁵ for [O III] and [N II], respectively) are overlaid in all maps (solid white lines). The approximate location of the central star is marked by a white star.
Current usage metrics show cumulative count of Article Views (full-text article views including HTML views, PDF and ePub downloads, according to the available data) and Abstracts Views on Vision4Press platform.
Data correspond to usage on the plateform after 2015. The current usage metrics is available 48-96 hours after online publication and is updated daily on week days.
Initial download of the metrics may take a while.