Fig. 1.
Download original image
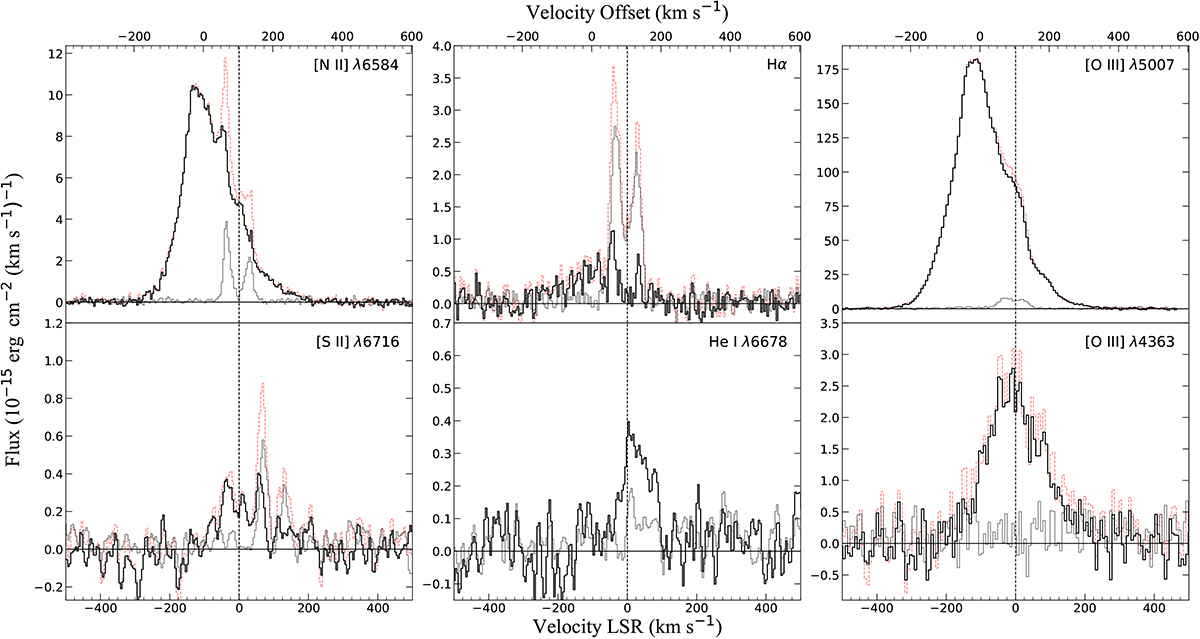
GTC MEGARA emission line profiles of the central ejecta of A 58 (red dashed line) extracted from a 1![]() 8 in radius circular region, and surrounding nebula (grey solid line) averaged from four regions of the same size located at the corners of the MEGARA FoV. The [N II] λ6584, Hα, [O III] λ5007, and [S II] λ6716 emission line profiles of the central ejecta include notable contribution from the surrounding nebula. The surrounding nebula emission profiles of these lines have been subsequently subtracted to obtain the net emission line profiles of the central ejecta (black solid line), whereas for the He Iλ6678 and [O III] λ4363 emission line profiles only a constant level representative of the continuum emission has been subtracted. As described in the text the subtraction of the emission from the surrounding nebula is not perfect most likely given its non-uniform surface brightness. The horizontal line marks the continuum level, while the vertical line marks the systemic velocity of +103 km s−1 of the surrounding nebula.
8 in radius circular region, and surrounding nebula (grey solid line) averaged from four regions of the same size located at the corners of the MEGARA FoV. The [N II] λ6584, Hα, [O III] λ5007, and [S II] λ6716 emission line profiles of the central ejecta include notable contribution from the surrounding nebula. The surrounding nebula emission profiles of these lines have been subsequently subtracted to obtain the net emission line profiles of the central ejecta (black solid line), whereas for the He Iλ6678 and [O III] λ4363 emission line profiles only a constant level representative of the continuum emission has been subtracted. As described in the text the subtraction of the emission from the surrounding nebula is not perfect most likely given its non-uniform surface brightness. The horizontal line marks the continuum level, while the vertical line marks the systemic velocity of +103 km s−1 of the surrounding nebula.
Current usage metrics show cumulative count of Article Views (full-text article views including HTML views, PDF and ePub downloads, according to the available data) and Abstracts Views on Vision4Press platform.
Data correspond to usage on the plateform after 2015. The current usage metrics is available 48-96 hours after online publication and is updated daily on week days.
Initial download of the metrics may take a while.