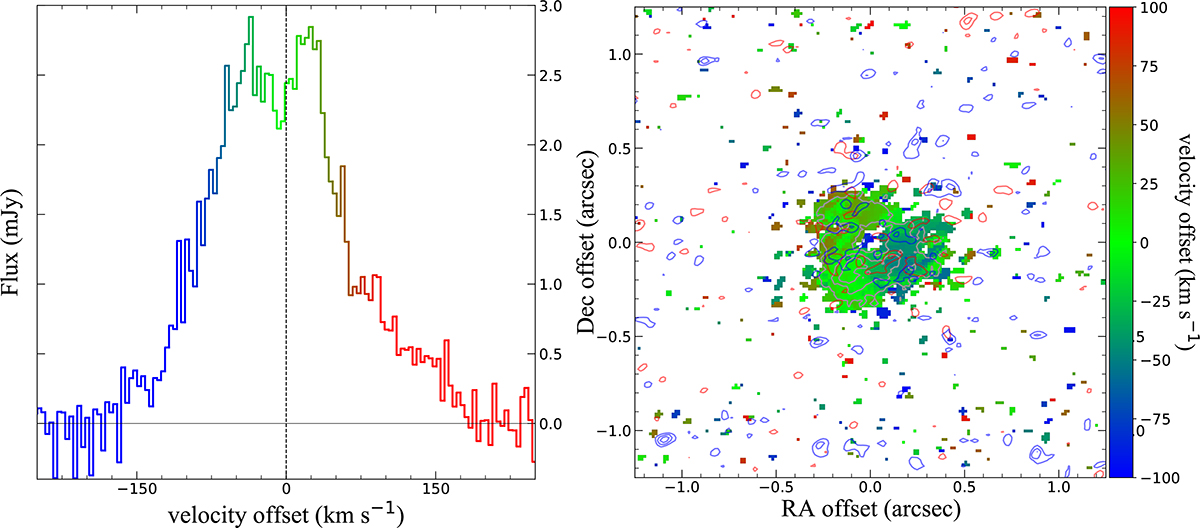
Fig. 6.
Download original image
Spatio-kinematical distribution of the HCN(J = 4 → 3) emission around V605 Aql. Left: ALMA HCN (J = 4 → 3) emission line profile from V605 Aql. Right: velocity field (first moment) of the HCN (J = 4 → 3) emission around V605 Aql in the velocity range of −100 < Voffset (km s−1) < 100 is shown as a color map, according to the color code of the emission line profile in the left panel. The pixels with emission below three times the rms noise level of 0.2 mJy beam−1 were masked. The gray contours show the velocity-integrated emission (zeroth moment) of the HCN (J = 4 → 3) in the velocity range −100 < Voffset (km s−1) < 100. The gray contours are drawn from 3σ on steps of 3σ (where σ = 6.5 mJy beam−1 km s−1 is the rms noise level of the zeroth moment image). The blue and red contours show the zeroth moment emission of the HCN (J = 4 → 3) in the velocity range −165 < Voffset (km s−1) < − 100 and +100 > Voffset (km s−1) > + 180, respectively. The red contours are drawn for 9, 12 and 15 mJy whereas blue contours are drawn for 7, 9 and 11 mJy.
Current usage metrics show cumulative count of Article Views (full-text article views including HTML views, PDF and ePub downloads, according to the available data) and Abstracts Views on Vision4Press platform.
Data correspond to usage on the plateform after 2015. The current usage metrics is available 48-96 hours after online publication and is updated daily on week days.
Initial download of the metrics may take a while.