Fig. 4.
Download original image
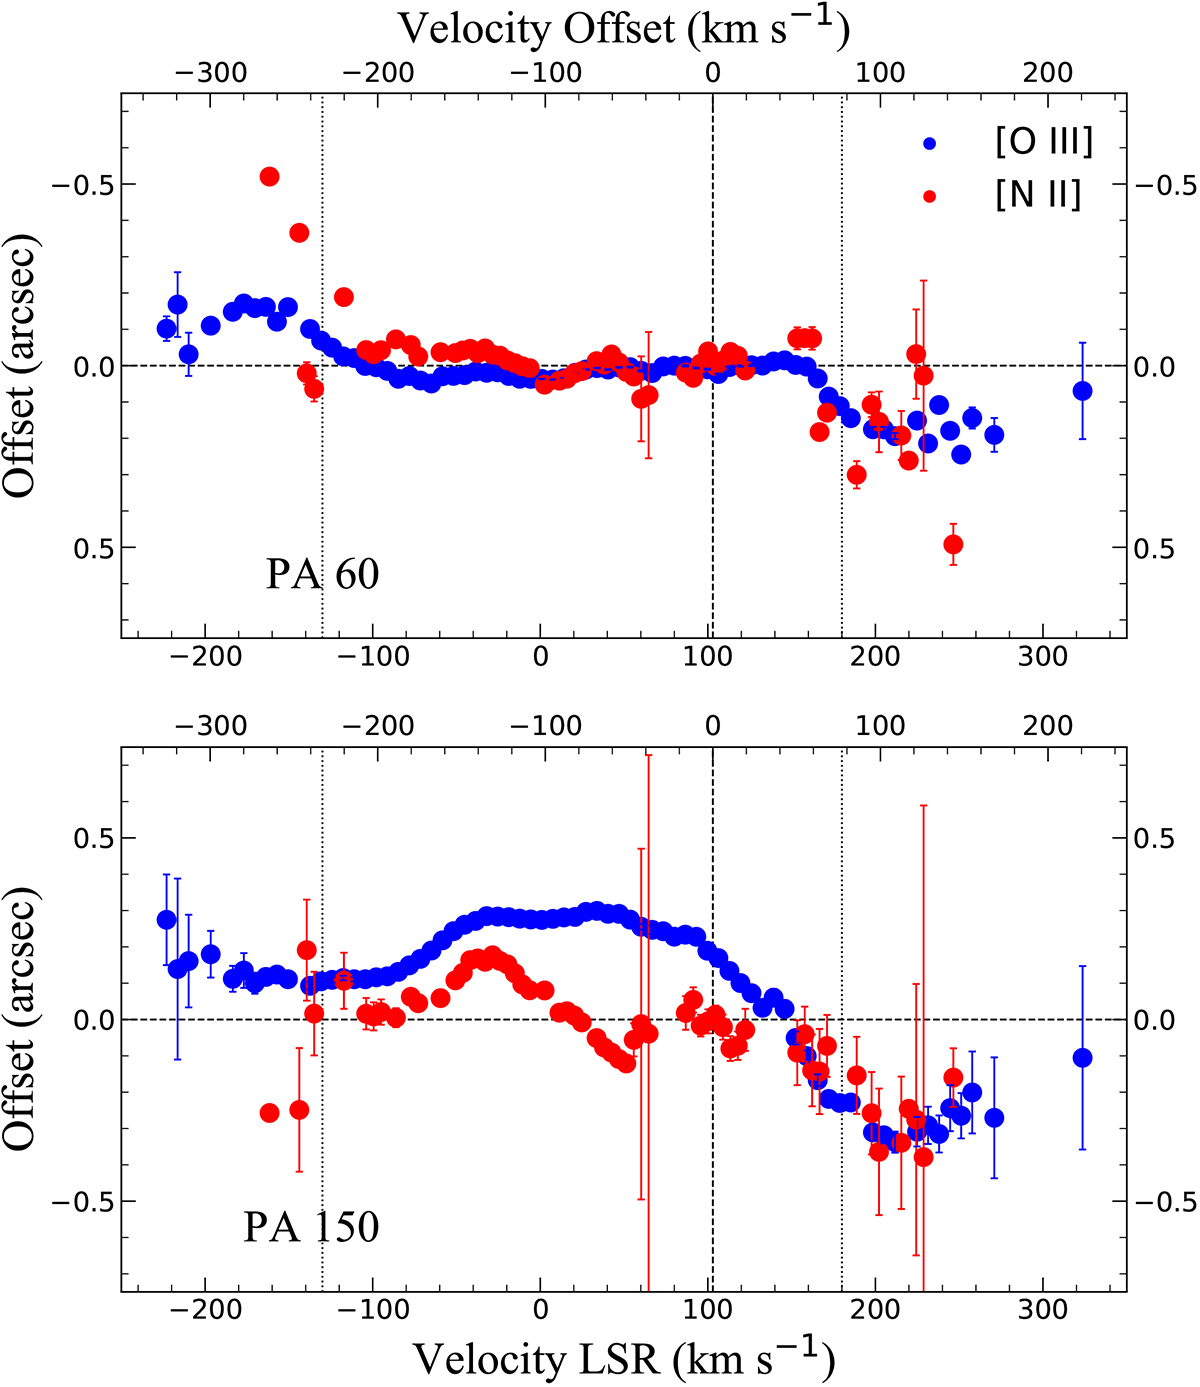
Position-velocity (PV) plots in the [O III] λ5007 (red dots) and [N II] λ6584 (blue dots) of the CSPN of A 58 along the PA = 60° and PA = 150°. Positions have been obtained using a 2D Gaussian fit of the emission at each spectral channel (see text for details). The x-axis are showed in LSR system (bot) and respect to the systemic velocity (top) for both panels. The systemic velocity of the ejecta and the location of the CSPN are marked by vertical and horizontal dashed lines, respectively.
Current usage metrics show cumulative count of Article Views (full-text article views including HTML views, PDF and ePub downloads, according to the available data) and Abstracts Views on Vision4Press platform.
Data correspond to usage on the plateform after 2015. The current usage metrics is available 48-96 hours after online publication and is updated daily on week days.
Initial download of the metrics may take a while.