| Issue |
A&A
Volume 684, April 2024
|
|
|---|---|---|
| Article Number | A186 | |
| Number of page(s) | 10 | |
| Section | Astronomical instrumentation | |
| DOI | https://doi.org/10.1051/0004-6361/202347773 | |
| Published online | 23 April 2024 | |
Satellite-based atmospheric characterization for sites of interest in millimeter and sub-millimeter astronomy
1
Centro Para la Instrumentación Astronómica (CePIA), Departamento de Astronomía, Universidad de Concepción,
Chile
e-mail: This email address is being protected from spambots. You need JavaScript enabled to view it.
; This email address is being protected from spambots. You need JavaScript enabled to view it.
2
Geospace Physics Laboratory, NASA Goddard Space Flight Center,
Greenbelt,
MD,
USA
e-mail: This email address is being protected from spambots. You need JavaScript enabled to view it.
3
Catholic University of America,
Washington,
DC,
USA
Received:
21
August
2023
Accepted:
8
February
2024
Abstract
Context. Water vapor is the main source of atmospheric opacity for millimeter and sub-millimeter astronomy. Hence, several studies seek to effectively characterize it for site-testing purposes. In this task, reanalysis databases are quickly becoming a popular alternative to on-site measurements due to easy accessibility and the versatility of the data they provide.
Aims. In the framework of validating the use of reanalysis data as a site-testing oriented tool, we perform a statistical comparison of atmospheric water vapor values obtainable from the MERRA-2 database with ground-based microwave radiometer measurements taken at two astronomical sites in Chile: Llano de Chajnantor, Atacama, and Cerro Paranal, Antofagasta.
Methods. The MERRA-2 data were interpolated both vertically (across pressure levels) and geographically (latitude-longitude). For each site, different plots were generated: a direct temporal variation plot (to visually compare the data variation over time between both sources); a PWV versus PWV plot, fitting a linear fit through robust linear regression and calculating both the Pearson (r) and Spearman (ρ) correlation coefficients in order to look for correlations between both data sources; a histogram showing the distribution of the differences between the MERRA-2 data and the water vapor measurements (defined as APWV = PWVMERRA-2 − PWVsite), along with its standard deviation (σ), mean (µ), and median values, with the aim of better appreciating the similarities of the data sources over time; and a CDF plot to compare both data distributions disregarding time stamps. Finally, millimeter and sub-millimeter transmittance curves were created through the am atmospheric modeling software, which uses ozone and temperature data along with the verified water vapor data for the two studied sites as well as three other sites of interest for the next-generation Event Horizon Telescope: Las Campanas Observatory near La Serena, Chile; Valle Nevado, located near Santiago, Chile; and the General Bernardo O’Higgins base, located in Antarctica.
Results. The interpolated MERRA-2 PWV values are highly correlated with the ground-based PWV values, with a Pearson coefficient greater than 0.9 and a Spearman coefficient higher than 0.85. However, their dependence is not linear, as PWVAPEX = m * PWV, with m being higher than 0.9 in both cases. The difference histograms show an almost zero-centered distribution for Llano de Chajnantor, with a µ value of −0.021 and a median value of −0.007. On the other hand, in Cerro Paranal, the difference histogram is slightly offset toward positive values, with µ value of 0.171 and a median value of 0.256. This offset is most likely due to the strong winds present in the site’s location, close to the Pacific Ocean. The transmittance curves show different performances depending on the site studied, with Cerro Chajnantor being the highest overall transmittance and Antarctica the lowest. Additionally, the transmittance profiles estimated for Cerro Chajnantor and Cerro Paranal were scaled using the PWV measurements, providing differences of less than 12% to the model data profiles. Results obtained at the Valle Nevado site suggest promising atmospheric conditions for stronomic observations in the millimeter and sub-millimeter range.
Conclusions. The results we obtained show that the atmospheric water vapor estimation using MERRA-2 data can be used for site testing of new sites by evaluating the millimeter–sub-millimeter transmittance profile through vertical pressure correction and averaging the closest grid points to the site. This new method opens the door for future site-testing studies using MERRA-2 and potentially other reanalysis databases (e.g., ERA5) as reliable sources of information.
Key words: radiative transfer / atmospheric effects / methods: data analysis / site testing
© The Authors 2024
 Open Access article, published by EDP Sciences, under the terms of the Creative Commons Attribution License (https://creativecommons.org/licenses/by/4.0), which permits unrestricted use, distribution, and reproduction in any medium, provided the original work is properly cited.
This article is published in open access under the Subscribe to Open model. This email address is being protected from spambots. You need JavaScript enabled to view it. to support open access publication.
1 Introduction
Water vapor is the main source of opacity in the Earth’s atmosphere at infrared and millimeter and sub-millimeter wavelengths. Hence, water vapor concentration is commonly considered one of the most relevant selection criteria to evaluate a potential site for a sub-millimeter telescope, apart from accessibility, radio frequency interference, and wind profile (Li et al. 2020). In general, there is an exponential decrease of atmospheric water vapor density with altitudes up to 2000 m (Starr & White 1955). Therefore, to obtain very low water vapor concentrations, radio observatories are commonly installed at high altitudes in very dry zones. However, in contrast to the majority of atmospheric gases, which are well mixed in the whole atmospheric extension and are in near pressure equilibrium, water vapor concentration varies over time as well as with altitude and geographic location (Kerber et al. 2014). Moreover, water vapor variability is also directly related to weather conditions (Smette et al. 2015). Consequently, to determine the atmospheric quality of a site of interest, long-term and continuous site monitoring of precipitable water vapor (PWV) must be performed, which is defined as the depth of the equivalent condensed water (in units of millimeters) that would result if the total atmospheric water vapor column above the site was condensed.
Well-known areas with PWV conditions suitable for millimeter and sub-millimeter astronomy are the Chajnantor area in northern Chile, Dome A and Dome C in Antarctica, Mauna Kea in Hawaii, Summit Camp in Greenland, and Yangbajing in Tibet (Tremblin et al. 2012). Hitherto, there is a continuous interest in determining new candidates for radio astronomy sites; thus new sites are constantly being evaluated in terms of PWV, such as the Qitai Telescope (QTT) in China (Li et al. 2020) and the Big Telescope Alt-Azimuthal (BTA) region in Russia (Shikhovtsev et al. 2022). Moreover, there is a high amount of interest in the inclusion of new telescopes in global-scale Very Large Baseline Interferometry (VLBI) networks, such as the Event Horizon Telescope (EHT).
The EHT is a global cooperation network with radio telescopes all over the world that aims to study supermassive black holes (SMBH) located in galaxy centers. This project has successfully observed M87’s central SMBH and Sgr A*, observing in two frequency bands (227.1 and 229.1 GHz). The original EHT was formed by eight observatories at six locations: the Ata-cama Large Millimeter/submillimeter Array (ALMA) and the Atacama Pathfinder Experiment (APEX) at the Llano de Chaj-nantor in Chile; the Large Millimeter Telescope Alfonso Serrano (LMT) on Volcán Sierra Negra in Mexico; the James Clerk Maxwell Telescope (JCMT) and Submillimeter Array (SMA) on Mauna Kea in Hawai'i; the IRAM 30 m telescope on Pico Veleta (PV) in Spain; the Submillimeter Telescope (SMT) on Mt. Graham in Arizona; and the South Pole Telescope (SPT) in Antarctica (The Event Horizon Telescope Collaboration 2019). Additionally, recent incorporations to the EHT association are the Greenland Telescope (GLT; Matsushita et al. 2017), a 12-m radio telescope located in the Greenland ice sheet; the Kitt Peak Observatory (KPT), a 12-m telescope located in Arizona, United States; and the Northern Extended Millimeter Array (NOEMA), composed of twelve 12-m dishes, located in Plateau de Bure, France (Johnson et al. 2023). Nonetheless, currently, there is an active effort to further expand the network by including new sites and observing new frequency bands (e.g., 230 and 345 GHz) for the so-called next-generation EHT (ng-EHT).
Traditional site-testing methods to determine the PWV for a specific location rather than an extended geographic area include the use of expensive microwave or infrared radiometers physically located at the site of interest that provide continuous measurements. Additionally, another common method is the deployment of radiosondes, which provide complete information of the atmospheric column but lack sufficient temporal resolution. Alternative methods to estimate PWV use the wet delay of the signals received from the global navigation satellite systems (GNSS; e.g., Özdemir et al. 2018), GOES satellite data (e.g., Marín et al. 2015), and the MODIS on the NASA Terra and Aqua satellites (e.g., Zhu et al. 2021), among others.
Recent site-testing studies have suggested the use of reanal-ysis datasets to evaluate the atmospheric water vapor in an area. Raymond et al. (2021) identified a set of possible candidates for the ng-EHT using surface-level PWV historical data from the NASA Modern-Era Retrospective analysis for Research and Applications, Version 2 (MERRA-2; Gelaro et al. 2017). In another recent study, Xu et al. (2022) used measurements from a 183 GHz radiometer along with a site-testing methodology based on the use of reanalysis data obtained from the ECMWF (Li et al. 2020) to evaluate the Muztagh-ata site in China. Iserlohe et al. (2021) compared data obtained from the Far Infrared Field-Imaging Line Spectrometer (FIFI-LS) of the Stratospheric Observatory for Infrared Astronomy (SOFIA), with PWV data extracted from the European Centre for Medium-Range Weather Forecasts (ECMWF). Shikhovtsev et al. (2022) presented a method to evaluate the BTA region using PWV data from the ERA-5 reanalysis dataset. Kuo (2017) used MERRA-2 data to evaluate five sites of interest in millimeter-wave observations: South Pole and Dome A in Antarctica, Chajnantor in Atacama, Ali in Tibet, and Summit Camp in Greenland. In their study, values for precipitable water vapor, sky brightness temperature, ice water path, and liquid water path were calculated to analyze the atmosphere in terms of stability for sky temperature and water vapor content through time. Zhao et al. (2022) used datasets from MERRA-2 and an atmospheric reanalysis produced by ECMWF’s ERA-5 (Hersbach et al. 2020) to evaluate the Lenghu site, a recently discovered site on the Tibetan Plateau.
In contrast, some studies have used atmospheric radiative transfer models to complement their site-testing evaluation. Matsushita et al. (2017) used MERRA-2 meteorological data for water vapor and ozone mixing along with the am model (Paine 2022) and measurements of a 225 GHz tipper radiometer to estimate the transmission spectra up to 1.6 THz over the Greenland Summit Camp site of the GLT. Cortés et al. (2016) used MERRA-2 data and the am model to simulate atmospheric opacity at 350 µm while aiming to correlate opacity measurements from tipper radiometers with atmospheric water vapor in the Chajnantor area in Atacama, Chile.
Additionally, several studies have validated the accuracy of the PWV data obtained from atmospheric reanalyses using ground-based radiometric measurements (e.g., Ssenyunzi et al. 2020; Ermakov et al. 2021). Moreover, Mo et al. (2021) compared four reanalysis databases, among them MERRA-2 and ERA5, with GNSS-derived PWV measurements over Antarctica. Indeed, in their study, according to the GNSS-based measurements, MERRA-2 and ERA-5 perform better than the rest of datasets analyzed in terms of PWV estimation.
Nevertheless, although several studies have used PWV data from reanalysis datasets for site-testing purposes, these works are limited by the provided grid and altitude resolution of the dataset. In the present work, a new site-testing method using PWV data from the atmospheric reanalysis dataset MERRA-2 is proposed. Additionally, the PWV data obtained from this methodology is compared to ground-based 183 GHz radiometer measurements located at two world-class Chilean astronomical sites: APEX, located in Llano de Chajnantor, and LHATPRO, located in Cerro Paranal. The results of this study provide a verification of the accuracy of this reanalysis-based site characterization in terms of water vapor estimation. Moreover, transmittance profiles are generated for the cumulative 50% of cases between 2019 and 2022 over both sites of study as well as for the three additional sites of interest for the ng-EHT in Chile, previously suggested near La Serena and Base General Bernardo O’Higgins (GARS) in Antarctica. Indeed, this study is motivated by the determination of new sites for the ng-EHT project, but the methods presented here can be directly applied to the site testing of any future radio telescope.
In Sect. 2, the radiometric instruments and sites, the MERRA-2 dataset, the am model, and the data analysis and comparison methods used are specified. In Sect. 3, the results are presented and discussed, both in the validation process and the subsequent atmospheric analysis. Finally, in Sect. 4, conclusions are made based on the presented results.
2 Methods
2.1 Water vapor measurements
The Atacama Pathfinder Experiment (APEX; Güsten et al. 2006) is a 12-m submillimeter telescope located at 5107 m altitude at Llano de Chajnantor in the Chilean High Andes (−23.01°, −67.759°) (Fig. 1 (top)) that works as the pathfinder for other sub-millimeter missions, specifically the Atacama Large Millimeter Array (ALMA). APEX is a modified prototype from ALMA made for single-dish operations. A 183 GHz water vapor radiometer built by Radiometer Physics GmbH (Meckenheim, Germany) is located in the Cassegrain cabin of the APEX telescope and provides PWV observations since 2006. The measurements are made only when the telescope is operating, obtaining the PWV at the elevation the dish is pointing, and are later corrected to an equivalent zenith value. The measurements are publicly available through the APEX Weather Query Form1. In our data analysis approach, an averaging process was applied to the raw data to match with MERRA-2 time stamps (obtained every 3 h) by averaging all the data with a temporal window of ±1.5 h.
The Low Humidity and Temperature Profiling (LHATPRO) (Querel & Kerber 2014) is a microwave radiometer used to monitor sky conditions over ESO’s Paranal Observatory (−24.627°, −70.404°) Fig. 1 (bottom) in Cerro Paranal, Antofagasta, Chile, at an altitude of 2635 meters. It consists of a humidity profiler that measures PWV in the ranges of 0–20 mm using the strong H2O line (183 GHz) and obtains temperature profiles using the O2 line (51–58 GHz) as well as an infrared camera (~10 µm) for cloud coverage detection. This instrument was commissioned between October and November 2011. Its measurements started in January 2014, and they are publicly available through the LHATPRO Query Form2. The same averaging process applied to APEX was applied to the raw data provided by the LHAT-PRO query in order to match the LHATPRO time stamps with the MERRA-2 time stamps.
In this study, the data analyzed at both sites corresponds to a period of four years, which ranges from 2019-01-01 to 202212-31. It is relevant to highlight that during this period, only weak-moderate El Niño climatic events have been observed. Additionally, a set of incorrectly calibrated PWV data from APEX was not included in the analysis process and negative PWV values were filtered from LHATPRO. The deleted period from APEX ranges from 14-11-2018 to 06-04-2019, and it was determined through an intercalibration study of several radiometers located at the Chajnantor area (in prep.).
2.2 Reanalysis model data
The Modern-Era Retrospective Analysis for Research and Applications, Version 2 (MERRA-2; Gelaro et al. 2017) is the latest atmospheric reanalysis produced by NASA’s Global Modeling and Assimilation Office (GMAO). It combines the observations made by the GMAO satellite era with the Goddard Earth Observing System (GEOS) atmospheric data assimilation system.
MERRA-2 stores data in a 0.625° longitude × 0.5° latitude horizontal grid that extends across the globe, consisting of 580 values in the longitudinal direction and 360 values in the latitudinal direction. There are four different formats of vertical grid configuration: horizontal-only, which does not provide vertical information; pressure-grid, interpolating data in 42 fixed pressure values; model-level, interpolating data in 72 surface-dependent levels; and model-edge, using the pressure thickness (DELP) to calculate the upper edges of the layers. Horizontal-only gives variables as three-dimensional fields (x, y, time), while the other configurations give variables as four-dimensional fields (x,y,z, time). The grid (horizontal and vertical) configuration is defined when retrieving data files from the GES DISC page3.
The data are distributed over a series of file collections storing different types of data according to the researcher’s objective. Each file has a unique index that specifies the data contained and its respective attributes. In this study, the format M2T3NVASM (Office & Pawson 2015) was selected, providing 3-h time-averaged assimilated meteorological fields over the model-level vertical grid, in particular a specific humidity (QV) variable, which can be converted to PWV, along with a pressure thickness (DELP) variable are also present in this format. The conversion process from QV to PWV is shown below. A more in-depth description of the contents of this file format as well as other formats can be found in the MERRA-2 file specification document (Bosilovich et al. 2016).
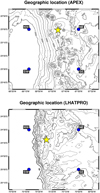 |
Fig. 1 Topographic maps of the study sites indicated in Table 1. The yellow star represents the location of APEX (top panel) and LHATPRO (bottom panel) sites, and the blue circles are the nearest MERRA-2 grid points used for the PWV analysis. |
2.3 Data extraction and processing
Both APEX and LHATPRO provide integrated PWV values through time. While MERRA-2 also has the option to deliver integrated PWV values over its grid points (in the horizontal-only format used in Raymond et al. 2021), the grid resolution used in its calculus makes the use of these values not recom-mendable. APEX is located at an average surface pressure of 555 mbar, while LHATPRO is at an average surface pressure of 742 mbar, and none of these pressures are exactly matched by the surface pressure of MERRA-2. This pressure difference is of major relevance in PWV studies due to the exponential decrease of water vapor with altitude. Therefore, this surface pressure divergence may contribute to an overestimation and possibly a systematic offset when characterizing the PWV. Additionally, the latitudinal-longitudinal grid resolution of MERRA-2 has a coarse resolution, preventing its direct usage for the determination of particular locations. The closest MERRA-2 grid point for LHATPRO is located at the northwest (NW), with a distance of 26.42 km, while the one for APEX is located at the northeast (NE), with a distance of 26.53 km (Table 1). Therefore, neither of the MERRA-2 grid points is closer than 26 km from their respective site. To solve these issues, in this study, model-level pressure-stratified data were chosen over integrated data, and the site PWV was calculated using a tridimensional interpolation process on this data, which is explained below.
The variables we used from the MERRA-2 file are the specific humidity (QV), the pressure thickness (DELP) of each pressure level, and the mid-level pressure (PL), which is required to locate the vertical model-level layers with their corresponding atmospheric layers. We determined the PWV with the following equation (Li et al. 2020):
 (1)
(1)
where q is the specific humidity and g is the gravitational acceleration of the Earth. Specific humidity values (QV) along with the pressure thickness (DELP) were used to retrieve the PWV per layer; summing these values over all layers provided the total value of the integrated PWV at the surface pressure levels defined by the model.
Since the native grid points of the MERRA-2 reanalysis data do not exactly match the coordinates or pressure level of the sites under investigation on its native grid, an interpolation process was carried out consisting of two consecutive operations: (1) a vertical one-dimensional interpolation throughout the pressure layers, with the goal of determining the cumulative water vapor content at the exact pressure of the APEX or LHATPRO site and disregarding any additional component due to altitude misalignment, and (2) a geographical two-dimensional linear interpolation, taking the pressure-corrected PWV values from the four closest grid points surrounding the site location and their respective distances to obtain the integrated PWV value at the site’s surface pressure on its exact geographical location. In our study, these interpolated values are compared to the measured PWV values obtained by the microwave radiometers of APEX and LHATPRO4.
Geographic location of the sites of interest for the ng-EHT.
2.4 Data analysis
In addition to estimating the PWV values using MERRA-2’s data, several plots were generated with the data obtained using the Python code previously mentioned. To conduct a visual assessment of the data and identify any data voids, we first generated a time plot comparing the site’s radiometer PWV with MERRA-2’s data. Simultaneously, the difference between MERRA-2’s data and the site’s measurements, defined as ΔPWV = PWVMERRA-2 − PWVsite, was also shown in order to provide a visual representation of the data dispersion.
A more direct comparison was made through PWV versus PWV plots over all of the matching time stamps of measurements at the site and MERRA-2. A linear fit was applied with a robust linear regressor (using SciPy’s HuberRegressor library, which implements the Huber loss function, Huber 1964) to determine the general trend and minimize outlier effects. Additionally, both the Pearson (ρ) and Spearman (r) coefficients were calculated (Xiao et al. 2016) to see how MERRA-2 data could linearly fit to the site’s measurements and how monotonic their correlation is, respectively.
A series of histograms based on the previously defined difference Δ PWV were generated to show the distribution of the differences. These histograms are intended to identify any possible inconsistencies from the interpolated result. Along with these histograms, the mean, median, and standard deviation are also provided for easier analysis and comparison.
Finally, a cumulative distribution function (CDF) plot was generated showing the probability distribution of the PWV values over the year regardless of the time stamp. Additionally, a CDF difference plot was also provided in order to obtain a visual representation of MERRA-2’s CDF dispersion in comparison to the site’s CDF measurements.
2.5 Radiative transfer evaluation
In our study, to complement the site-testing evaluation, we made a radiative transfer analysis process for the sites studied (APEX and LHATPRO) as well as for three additional sites of interest for the ng-EHT. Two of the additional sites are located in Chile, and is one located in the Antarctica, as indicated in Table 2. This process consisted of using the radiative transfer model am to calculate a site’s transmission given the previously explained interpolated analysis of MERRA-2 data of ozone, temperature, pressure, and verified water vapor data using the radiative transfer model am.
The am atmospheric model (Paine 2022) is an open-access and open-source software developed by Scott Paine at the Smithsonian Center of Astrophysics at Harvard University, Cambridge, USA. This model solves radiative transfer computations that involve propagation through the atmosphere at microwave wavelengths. It is based on configuration files that determine the different layers of the atmospheric model and the propagation path.
For this study, pressure-level mixing ratio values for both water vapor and ozone (QV and O3, respectively) as well as layer temperature values (T) extracted from the MERRA-2 interpolated data were used to make a configuration file for the 50th percentile of the data from 2019 to 2022, organized in 65-75 pressure levels, depending on the site’s elevation. Each layer is defined by its base pressure (represented as Pbase), its temperature (Tbase), and the columns of the atmospheric species to be analyzed in the model. These columns need to be defined by their volume mixing ratio (vmr), according to the software’s manual (Paine 2022). Pressure and temperature values were obtained from MERRA-2 data, and the columns used are as follows: (a) dry_air, which was predefined by the software and includes the standard concentration of the different dry air components; (b) o3, which was obtained from the MERRA-2 O3 values and allows one to manually define the ozone concentration; and (c) h2o, which was obtained from the MERRA-2 QV values and defines the amount of water vapor present in the layer.
The am model generates an output file with frequencies and the associated requested transmittance values. In this case, the transmittance values were obtained over a frequency range of 200 [GHz] to 400 [GHz].
3 Results and discussion
Figure 2 shows the temporal variation plot obtained during the study period for both study sites. At APEX, the time interval starts in June 2019, and it has visible data voids during half of 2020, the first quarter of 2021, and the first quarter of 2022. These data gaps are attributed to the operation of the radiometer, which measures only when observations are made and the telescope’s shutter is open. It is relevant to note that this seasonal period corresponds to the so-called Andes altiplanic winter (Otarola et al. 2019), which generates a large increase in PWV levels and prevents astronomical observations. In contrast, LHATPRO (shown in Fig. 2 (bottom)) does not present large data gaps because its operation is independent of astronomic observations. The time plots shown in this figure serve as a visual representation of the data dispersion over the years. Additionally, these plots allow for an easier appreciation of the measurement data outliers, which are mainly attributed to shutdowns of the device due to extreme weather conditions and/or technical issues. It is relevant to highlight that these plots show that the MERRA-2 interpolated data provides a similar PWV response to the radiometric measurements, as observed in the PWV difference plots.
The results suggest that both sites show quite a good correlation that is linear and monotonous based on the calculated correlation coefficients. The PWV versus PWV plots shown in Fig. 3 represent the relationship between the PWV data at equal time stamps for MERRA-2 and the measurements at each respective site. Additionally, a robust linear fit and the 1:1 line are plotted. The overall response of the MERRA-2 interpolated data at both sites and their corresponding linear fits showed a slope greater than 0.9, (mAPEX = 0.946 and mLHATPRO = 0.927). Additionally, the Pearson correlation coefficient (r) is greater than 0.9 in both cases (rAPEX = 0.913 and rLHATPRO = 0.928). Lastly, the Spearman coefficient, which is aimed at measuring monotonic correlations regardless of their linearity, resulted in ρAPEX = 0.898 for APEX’s case and ρLHATPRO = 0.906 for LHATPRO’s case. For convenience, these six values are shown in Table 3.
Histograms of the differences between the MERRA-2 interpolated data and the site’s measurements is provided in Fig. 4 for each of the studied sites along with histograms of each of the MERRA-2 grid points used for the interpolation. The mean, median, and standard deviation of these differences are listed in Table 4. For APEX, the difference histograms for all grid points and the interpolated values are highly similar, as seen in Fig. 4 (top). Alternatively, in the case of LHATPRO (shown in Fig. 4 (bottom)), the histograms obtained at the NE and SE points have central values that are clearly offset toward positive values. However, the difference histograms for the NW and SW grid points and the interpolated data, while more centered, are still not centered at zero.
When looking at the statistical values shown in Table 4, it can be seen that in the APEX study case, the interpolated data has a lower value for σ and the µ value closest to zero. Nevertheless, the median value closest to zero was obtained by the data from the SE grid point, with medianSE = −0.004, and is followed by the interpolated point, with medianMERRA-2 = −0.007. On the other hand, in the LHATPRO dataset, SE has the lowest value for σ, NW has the lowest value for µ, and SW has the lowest median value.
The results obtained at APEX suggest a very good agreement between the MERRA-2 reanalysis model interpolation method and the measurements. Nevertheless, at LHATPRO, larger differences are obtained. These discrepancies of the method can be explained by the relatively large histogram center offset at two of the four grid points used (NE and SE), which biased the interpolation process. The cause of these offsets is still unknown, but an initial analysis suggests that it can be attributed to the large variability of the winds present in that area (close to the Pacific Ocean). Figure 5 shows the average wind velocity and direction during different seasons at the same pressure level of each of the study sites obtained from the MERRA-2 reanaly-sis model dataset for the year 2019. In particular, Fig. 5 (top) shows the winds present at the pressure of the APEX site. Very strong winds, up to 14 m s−1, with a regular direction pattern toward the southeast are present during all seasons except summer. In the summer period, which is the period of higher water vapor concentration, the wind direction is not well defined, but the average wind speed is significantly lower. Figure 5 (bottom) shows the winds present at Cerro Paranal, Antofagasta, Chile. In this case, the strongest winds are found during autumn, but these have lower speeds than in the case of APEX (i.e., 4 m s−1 maximum wind speed). In general, the overall winds at the LHATPRO pressure level head toward the east, but large directional changes can be seen near the location of the site. This effect could be associated with what was shown in the histograms of Fig. 4 (bottom), in which only the eastward points (NE and SE) present their distribution offset toward positive values. This effect can be attributed to wind interactions with the topography of the area. It is suggested that LHATPRO shows a response similar to western grid points because it is located on the summit of Cerro Paranal, where eastern winds have no interaction with the surrounding topography. Alternatively, the eastern grid points are impacted by the wind changes produced by the nearby mountain structures. Therefore, the coarse spatial resolution of the MERRA-2 grid does not provide enough representability of the distribution of the atmospheric parameters found within this area. We note that in the APEX case, the surrounding mountains have a lower altitude than the observatory, but much higher topographic elevations are obtained at the LHATPRO pressure.
Figure 6 shows the geographical distribution for both the median and standard deviation (σ) of the difference between the data obtained from MERRA-2 and the site measurements. Figure 6 (top) shows that the APEX site is near the median zero value (represented by the white line) and also near the area with the lowest standard deviation values. Figure 6 (bottom) shows the LHATPRO case. In this case, the median zero value white line is closer to SW and NW, located west of the site. On the other hand, the standard deviation of the distribution is similar in the NE, NW, and SE grid points, indicating that they have similar variabilities. These results also support the assumption that the distribution is biased due to the topographic impact on the winds within the area.
To provide a useful measure of each site’s observability, we analyzed the cumulative distribution function (CDF) in both study sites. Figure 7 shows the data distribution without constraining it to time-stamp matching, ensuring the usage of most of the radiometric measurements. The plots showing the differences of the CDFs are also provided to help identify the differences and similarities obtained by the distribution at the two study sites.
In APEX’s case, shown in Fig. 7 (top), all the MERRA-2 grid points and the interpolated data present some degree of overes-timation compared to the site measurements. This effect can be seen in the difference plot, where all of the curves show positive values. It is important to note that NE provides the most similar distribution to the measurements, followed by the interpolated data.
In LHATPRO’s case, both NW and SW present an over-estimation of PWV in comparison to the site’s data, which is noticeable in both the CDF plot and the CDF difference plot in Fig. 7 (bottom). Meanwhile, both NE and SE show a similar distribution compared to the site’s data, as can be seen in the CDF difference plot. However, the interpolated data CDF has a rather noticeable deviation from the site data, specifically between 0 and ~3.5, most likely due to the strong deviation that two of the four grid points have previously shown. This strong offset would unavoidably apply a bias to the interpolation process, and it is clearly more noticeable in the CDF difference plot. Although this result is related to the histogram difference result previously indicated, a more detailed analysis would be required to identify the origin of the MERRA-2 data disparities, but this is beyond the scope of this study.
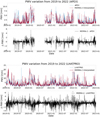 |
Fig. 2 Temporal plots of PWV for the APEX (top panel) and LHAT-PRO (bottom panel) study sites through the years 2019-2022. The upper plot shows (in blue) the radiometric measurements and (in red) the MERRA-2 bidimensionally interpolated data. The lower plots (black line) show the numerical differences between the MERRA-2 interpolated estimate and the site measurements. |
Values of the slope (m) of the linear fit (using a robust linear regression) and the Pearson (r) and Spearman (ρ) correlation coefficients obtained by the comparison to the MERRA-2 interpolated data at both study sites.
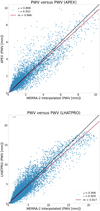 |
Fig. 3 PWV versus PWV plots (blue dots) comparing the site measurements and the data obtained by the interpolation of MERRA-2 data at APEX (bottom panel) and LHATPRO (bottom panel) sites. The red line represents the robust linear regression, and the black line represents the 1:1 line. The legend values indicate the Spearman correlation coefficient (ρ), the Pearson correlation coefficient (r), and the slope of the linear regression (m; defined by the equation PWVsite = m* PWVmerra-2). |
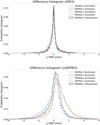 |
Fig. 4 Difference histograms for every MERRA-2 grid point for both APEX (top panel) and LHATPRO (bottom panel) sites along with the interpolated data over both sites. The difference is defined as PWVMERRA-2 − PWVsite. |
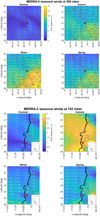 |
Fig. 5 MERRA-2 winds (top) at the pressure of the APEX site (555 mbar) and (bottom) at the pressure of the LHATPRO site (742 mbar) at different seasons of 2019. The color gradient represents the wind speed magnitude, while the arrows represent the direction of the wind. The red star indicates the respective site location. |
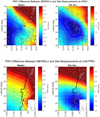 |
Fig. 6 Maps of the median and standard deviation of the difference between site measurements and MERRA-2 values (top) at the pressure of the APEX site (555 mbar) and (bottom) at the pressure of the LHATPRO site (742 mbar) during the year 2019. The black dots represent MERRA-2 grid point locations, and the red star indicates the respective site location. |
Transmittance values at 230 and 345 GHz for all five of the sites of interest.
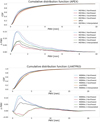 |
Fig. 7 Cumulative distribution functions obtained from 2019 to 2022 by the radiometric measurements at APEX (bottom panel) and LHATPRO (bottom panel), the nearby MERRA-2 grid points indicated in Table 1, and the MERRA-2 bidimensionally interpolated data (black line). The bottom plot shows the difference between the site measurements and the corresponding MERRA-2 model CDF values. |
Transmittance forecast
The atmospheric transmittance was evaluated using the am model over the two studied sites and also over the three sites in Chile with interest for the ng-EHT project mentioned in Table 2. The transmittance was evaluated from 200 GHz to 400 GHz, covering the two frequencies of interest for the ng-EHT: 230 GHz and 345 GHz. To provide a statistically significant representation of the sites, this evaluation was made based on the 50th percentile of all the time stamps available from 2019 to 2022, and the resulting plot can be seen in Fig. 8. Additionally, to provide a clearer visualization, the obtained values of transmittance at both frequencies of interest are also indicated in Table 5.
An additional analysis was made to determine the impact on the transmittance due to the PWV estimation discrepancy obtained by the MERRA-2 interpolated data and the site measurements. The water vapor content on the pressure column was scaled to match the respective median values of PWV measurements for both LHATPRO and APEX using the Nscale troposphere h2o configuration parameter in am. This scaling process allows the overall concentration of water vapor in the model to be adjusted and determines the impact of the measurement discrepancies of the model. The additional transmittance curves that show the instrument approximation calculated using this process are represented by dashed lines in Fig. 8.
As seen in Fig. 8, APEX presents very good transmittances along the frequency range considered despite the presence of the water vapor emission line at 325 GHz, the carbon monoxide (CO) emission line at 386.5 GHz, and the oxygen (O) emission line at 370 GHz. Regarding LHATPRO, VALLE, and LCO, they have similar but progressively worse transmittances, most probably because of their elevation above sea level. These three sites show a slightly steeper decrease in transmittance between 200 and 325 GHz. On the other hand, GARS (in Antarctica) shows a much lower overall performance due to its low altitude, thus presenting a much higher atmospheric water vapor content. In this case, it is not even possible to identify the CO and O lines because of the large attenuation, and there is no transmittance from approximately 370 GHz onward.
Regarding the calculated transmittance for the instrument approximations, the MERRA-2 estimation differs by 1.39% at 230 GHz and by 5.56% at 345 GHz for APEX. In the case of LHATPRO, the values differ by 2.9% at 230 GHz and by 11.19% at 345 GHz, showing a larger transmittance difference than the one seen in APEX for both frequencies of interest. These results indicate that the obtained PWV discrepancies provide a small impact on the site-testing evaluation, suggesting that MERRA-2 is an accurate resource for atmospheric transmittance determination.
The APEX, LHATPRO, and LCO sites provide results that were expected and previously studied in the literature, as observatories are already present at these locations. However, the results obtained at VALLE are promising due to their better overall transmittance when compared to LCO. Indeed, the results at VALLE are similar to LHATPRO, although their altitudes are different. This makes VALLE a promising candidate for a new ng-EHT telescope.
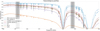 |
Fig. 8 Transmittance profiles for the 50th percentile. The profiles were obtained with the am software using interpolated MERRA-2 atmospheric data for both APEX and LHATPRO as well as the three new sites of interest for the ng-EHT, shown in Table 2, located in Chile and Antarctica (Raymond et al. 2021). The dashed lines represent the estimated transmittance obtained by scaling the water content profile to the measurements for both APEX and LHATPRO. The two black lines along with their gray bands are the two new frequencies of interest: 230 GHz and 345 GHz, respectively. The bands have an arbitrary width of ±4 GHz from the frequency value of interest. |
4 Conclusions
In this paper, we provide a new methodology to perform site testing using data from the MERRA-2 reanalysis model. The PWV data of the sites we studied were obtained from the MERRA-2 dataset and interpolated in pressure as well as spatially in order to match the surface pressure and location of the sites. We compared the results from this analysis to microwave radiometer water vapor measurements at two world-class astronomical sites in Chile: APEX, in Llano de Chajnantor, and LHATPRO, in Cerro Paranal. Additionally, the atmospheric millimeter-sub-millimeter transmittance was calculated using the am model and MERRA-2 interpolated data at five different sites in Chile with interest for the ng-EHT project.
The results we obtained show that the estimation of PWV values at the study sites of APEX and LHATPRO are robust enough to complement the evaluation of the site’s atmospheric quality in terms of PWV concentration over time. This method allows for the analysis of an extensive number of sites without the need for an on-site measuring system. Additionally, this method allows for expansion to a full opacity evaluation system using MERRA-2 not only based on PWV but on more variables provided by the MERRA-2 dataset, such as the liquid water path or cloud coverage.
The evaluation of this new site-testing method on the proposed ng-EHT sites in Chile showed favorable atmospheric performance in Valle Nevado, a touristic place located in Lo Barnechea, Santiago, Chile, that currently does not host any astronomical observatories. This suggests the existence of more potential sites for the ng-EHT that currently do not host astronomical observations and encourages more site-testing analyses at different locations that could be useful while disregarding the presence of observatories and taking advantage of the free and open-access quality of the MERRA-2 reanalysis model dataset. However, more studies are required to provide a more robust use of MERRA-2 as an alternative for atmospheric quality evaluation. Additionally, future studies need to be done to verify the use of other reanalysis model databases in site-testing applications (i.e., ERA5).
Acknowledgements
The authors would like to thank the MERRA-2 project which is funded through the NASA’s Modeling, Analysis, and Prediction program. MERRA-2 products are accessible online through the NASA Goddard Earth Sciences Data Information Services Center (GES DISC). This work was funded by ANID, BASAL, FB210003. M.M.-L. acknowledges the support of ANID/FONDECYT Postdoctorado 3220581 and Comité Mixto ESO-Chile ORP061/19. The team acknowledges the support of Dr. Neil Nagar and the Núcleo Milenio TITANS ANID NCN2023_002 through the realization of this research. The code used to analyze the data and produce the figures within this publication can be found at this website (https://doi.org/18.5281/zenodo.8221437). Please contact the corresponding author with any question regarding the software or data shown in this publication. The authors declare that they have no competing interests.
References
- Bosilovich, M. G., Lucchesi, R., & Suarez, M. J. 2016, MERRA-2: File Specification [Google Scholar]
- Cortés, F., Reeves, R., & Bustos, R. 2016, Radio Sci., 51, 1166 [CrossRef] [Google Scholar]
- Ermakov, D., Kuzmin, A., Pashinov, E., et al. 2021, Remote Sensing, 13, 1639 [NASA ADS] [CrossRef] [Google Scholar]
- Gelaro, R., McCarty, W., Suárez, M. J., et al. 2017, J. Climate, 30, 5419 [NASA ADS] [CrossRef] [Google Scholar]
- Güsten, R., Nyman, L. A., Schilke, P., et al. 2006, A&A, 454, L13 [NASA ADS] [CrossRef] [EDP Sciences] [Google Scholar]
- Hersbach, H., Bell, B., Berrisford, P., et al. 2020, Q. J. Roy. Meteorol. Soc., 146, 1999 [NASA ADS] [CrossRef] [Google Scholar]
- Huber, P. J. 1964, Ann. Math. Stat., 35, 73 [CrossRef] [Google Scholar]
- Iserlohe, C., Fischer, C., Vacca, W. D., et al. 2021, PASP, 133, 055002 [NASA ADS] [CrossRef] [Google Scholar]
- Johnson, M. D., Akiyama, K., Blackburn, L., et al. 2023, Galaxies, 11, 61 [NASA ADS] [CrossRef] [Google Scholar]
- Kerber, F., Querel, R. R., Rondanelli, R., et al. 2014, MNRAS, 439, 247 [NASA ADS] [CrossRef] [Google Scholar]
- Kuo, C.-L. 2017, ApJ, 848, 64 [NASA ADS] [CrossRef] [Google Scholar]
- Li, M.-S., Li, R., Wang, N., & Zheng, X.-W. 2020, Res. Astron. Astrophys., 20, 200 [CrossRef] [Google Scholar]
- Marín, J. C., Pozo, D., & Curé, M. 2015, A&A, 573, A41 [NASA ADS] [CrossRef] [EDP Sciences] [Google Scholar]
- Matsushita, S., Asada, K., Martin-Cocher, P. L., et al. 2017, PASP, 129, 025001 [NASA ADS] [CrossRef] [Google Scholar]
- Mo, Z., Zeng, Z., Huang, L., et al. 2021, Remote Sensing, 13, 3901 [NASA ADS] [CrossRef] [Google Scholar]
- Office, G. M. A. A., & Pawson, S. 2015, M2T3NVASM [Google Scholar]
- Otarola, A., De Breuck, C., Travouillon, T., et al. 2019, PASP, 131, 045001 [NASA ADS] [CrossRef] [Google Scholar]
- Özdemir, S., YesUyaprak, C., Aktug, B., et al. 2018, Exp. Astron., 46, 323 [CrossRef] [Google Scholar]
- Paine, S. 2022, Zenodo Version Number: 12.2 [Google Scholar]
- Querel, R. R., & Kerber, F. 2014, Proceedings of the SPIE, 9147, 914792 [NASA ADS] [CrossRef] [Google Scholar]
- Raymond, A. W., Palumbo, D., Paine, S. N., et al. 2021, ApJS, 253, 5 [Google Scholar]
- Shikhovtsev, A. Y., Kovadlo, P. G., Khaikin, V. B., & Kiselev, A. V. 2022, Remote Sensing, 14, 6221 [NASA ADS] [CrossRef] [Google Scholar]
- Smette, A., Sana, H., Noll, S., et al. 2015, A&A, 576, A77 [NASA ADS] [CrossRef] [EDP Sciences] [Google Scholar]
- Ssenyunzi, R. C., Oruru, B., D’ujanga, F. M., et al. 2020, Adv. Space Res., 65, 1877 [NASA ADS] [CrossRef] [Google Scholar]
- Starr, V. P., & White, R. M. 1955, J. Mar. Res., 217 [Google Scholar]
- The Event Horizon Telescope Collaboration et al 2019, ApJ, 875, L2 [Google Scholar]
- Tremblin, P., Schneider, N., Minier, V., Durand, G. A., & Urban, J. 2012, A&A, 548, A65 [NASA ADS] [CrossRef] [EDP Sciences] [Google Scholar]
- Xiao, C., Ye, J., Esteves, R. M., & Rong, C. 2016, Concurrency and Computation: Practice and Experience, 28, 3866 [CrossRef] [Google Scholar]
- Xu, J., Li, M., Esamdin, A., et al. 2022, PASP, 134, 015006 [NASA ADS] [CrossRef] [Google Scholar]
- Zhao, Y., Yang, F., Chen, X., et al. 2022, A&A, 663, A34 [NASA ADS] [CrossRef] [EDP Sciences] [Google Scholar]
- Zhu, D., Zhang, K., Yang, L., Wu, S., & Li, L. 2021, Remote Sensing, 13, 2761 [NASA ADS] [CrossRef] [Google Scholar]
The Python code developed to automatically evaluate the PWV of sites using MERRA-2 data is available at https://doi.org/10.5281/zenodo.8221437
All Tables
Values of the slope (m) of the linear fit (using a robust linear regression) and the Pearson (r) and Spearman (ρ) correlation coefficients obtained by the comparison to the MERRA-2 interpolated data at both study sites.
All Figures
|
Fig. 1 Topographic maps of the study sites indicated in Table 1. The yellow star represents the location of APEX (top panel) and LHATPRO (bottom panel) sites, and the blue circles are the nearest MERRA-2 grid points used for the PWV analysis. |
| In the text | |
|
Fig. 2 Temporal plots of PWV for the APEX (top panel) and LHAT-PRO (bottom panel) study sites through the years 2019-2022. The upper plot shows (in blue) the radiometric measurements and (in red) the MERRA-2 bidimensionally interpolated data. The lower plots (black line) show the numerical differences between the MERRA-2 interpolated estimate and the site measurements. |
| In the text | |
|
Fig. 3 PWV versus PWV plots (blue dots) comparing the site measurements and the data obtained by the interpolation of MERRA-2 data at APEX (bottom panel) and LHATPRO (bottom panel) sites. The red line represents the robust linear regression, and the black line represents the 1:1 line. The legend values indicate the Spearman correlation coefficient (ρ), the Pearson correlation coefficient (r), and the slope of the linear regression (m; defined by the equation PWVsite = m* PWVmerra-2). |
| In the text | |
|
Fig. 4 Difference histograms for every MERRA-2 grid point for both APEX (top panel) and LHATPRO (bottom panel) sites along with the interpolated data over both sites. The difference is defined as PWVMERRA-2 − PWVsite. |
| In the text | |
|
Fig. 5 MERRA-2 winds (top) at the pressure of the APEX site (555 mbar) and (bottom) at the pressure of the LHATPRO site (742 mbar) at different seasons of 2019. The color gradient represents the wind speed magnitude, while the arrows represent the direction of the wind. The red star indicates the respective site location. |
| In the text | |
|
Fig. 6 Maps of the median and standard deviation of the difference between site measurements and MERRA-2 values (top) at the pressure of the APEX site (555 mbar) and (bottom) at the pressure of the LHATPRO site (742 mbar) during the year 2019. The black dots represent MERRA-2 grid point locations, and the red star indicates the respective site location. |
| In the text | |
|
Fig. 7 Cumulative distribution functions obtained from 2019 to 2022 by the radiometric measurements at APEX (bottom panel) and LHATPRO (bottom panel), the nearby MERRA-2 grid points indicated in Table 1, and the MERRA-2 bidimensionally interpolated data (black line). The bottom plot shows the difference between the site measurements and the corresponding MERRA-2 model CDF values. |
| In the text | |
|
Fig. 8 Transmittance profiles for the 50th percentile. The profiles were obtained with the am software using interpolated MERRA-2 atmospheric data for both APEX and LHATPRO as well as the three new sites of interest for the ng-EHT, shown in Table 2, located in Chile and Antarctica (Raymond et al. 2021). The dashed lines represent the estimated transmittance obtained by scaling the water content profile to the measurements for both APEX and LHATPRO. The two black lines along with their gray bands are the two new frequencies of interest: 230 GHz and 345 GHz, respectively. The bands have an arbitrary width of ±4 GHz from the frequency value of interest. |
| In the text | |
Current usage metrics show cumulative count of Article Views (full-text article views including HTML views, PDF and ePub downloads, according to the available data) and Abstracts Views on Vision4Press platform.
Data correspond to usage on the plateform after 2015. The current usage metrics is available 48-96 hours after online publication and is updated daily on week days.
Initial download of the metrics may take a while.