Fig. 7
Download original image
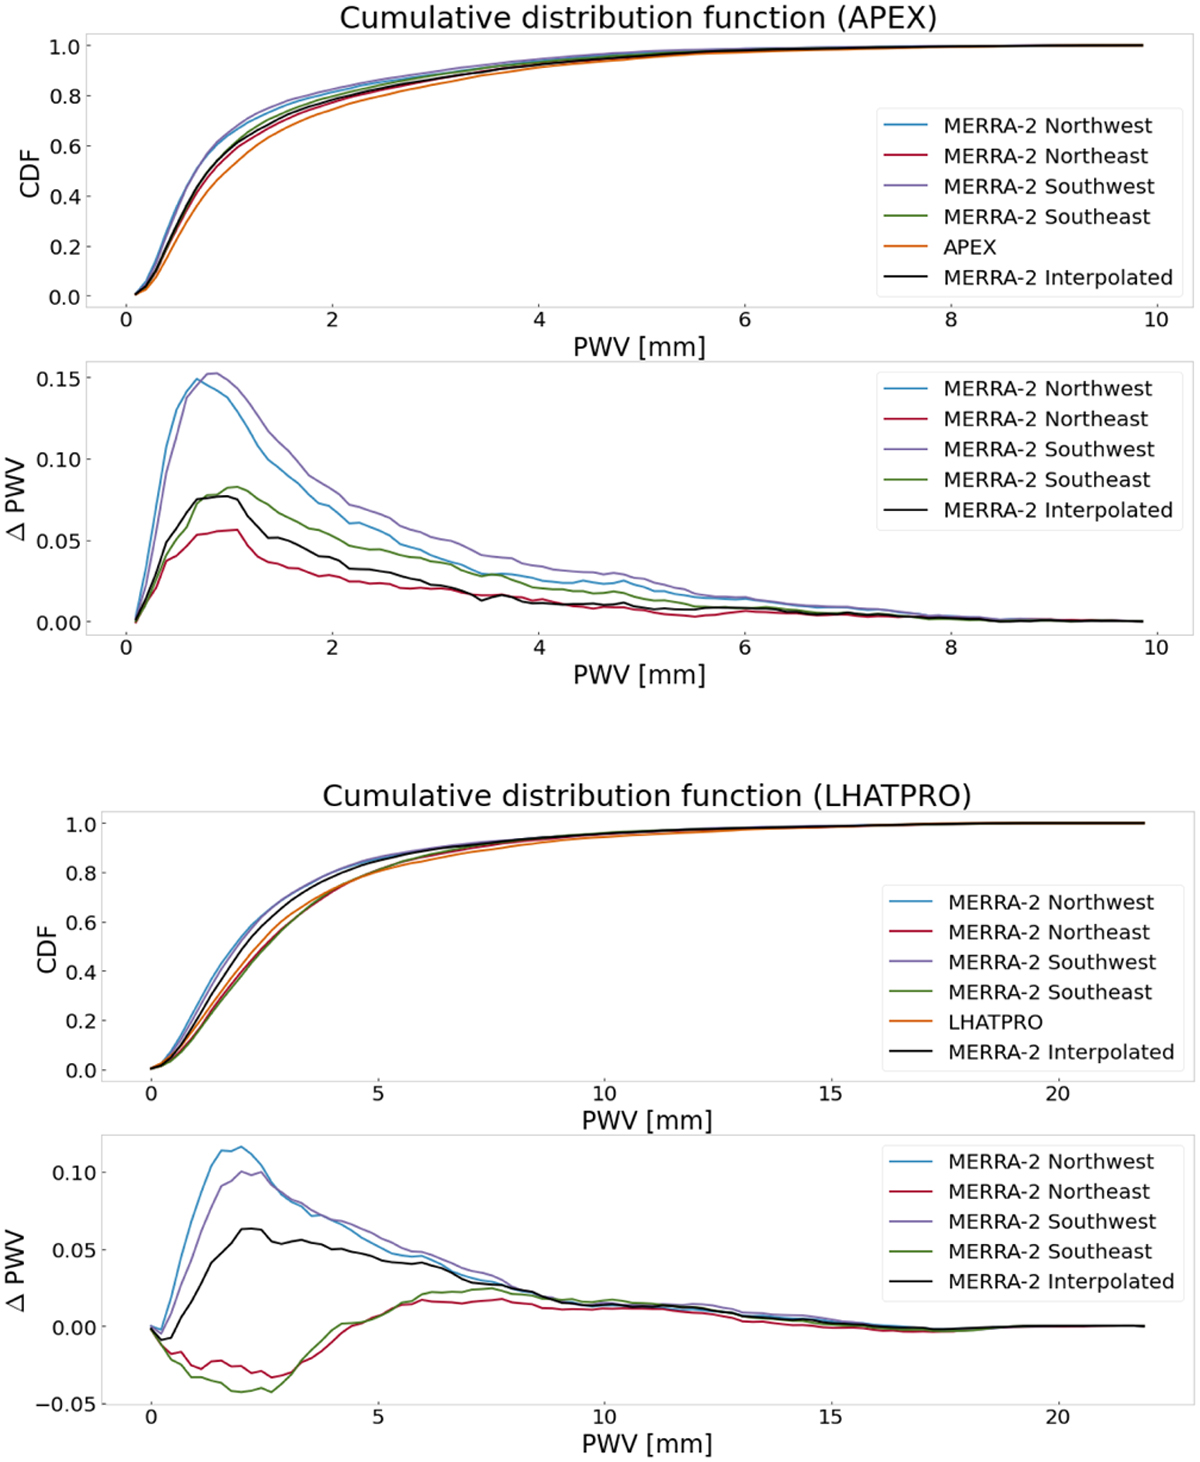
Cumulative distribution functions obtained from 2019 to 2022 by the radiometric measurements at APEX (bottom panel) and LHATPRO (bottom panel), the nearby MERRA-2 grid points indicated in Table 1, and the MERRA-2 bidimensionally interpolated data (black line). The bottom plot shows the difference between the site measurements and the corresponding MERRA-2 model CDF values.
Current usage metrics show cumulative count of Article Views (full-text article views including HTML views, PDF and ePub downloads, according to the available data) and Abstracts Views on Vision4Press platform.
Data correspond to usage on the plateform after 2015. The current usage metrics is available 48-96 hours after online publication and is updated daily on week days.
Initial download of the metrics may take a while.