| Issue |
A&A
Volume 663, July 2022
|
|
|---|---|---|
| Article Number | A34 | |
| Number of page(s) | 7 | |
| Section | Astronomical instrumentation | |
| DOI | https://doi.org/10.1051/0004-6361/202243735 | |
| Published online | 08 July 2022 | |
Long-term variations in precipitable water vapor and temperature at Lenghu Site
1
CAS Key Laboratory of Earth and Planetary Physics, Institute of Geology and Geophysics, Chinese Academy of Sciences,
Beijing, PR China
e-mail: This email address is being protected from spambots. You need JavaScript enabled to view it.
2
CAS Key Laboratory of Optical Astronomy, National Astronomical Observatories, Chinese Academy of Sciences,
Beijing, PR China
e-mail: This email address is being protected from spambots. You need JavaScript enabled to view it.
3
School of Physics and Astronomy, China West Normal University,
Nanchong, PR China
4
Haixi Meteorological Bureau,
Delingha, PR China
5
Nansen-Zhu International Research Centre, Institute of Atmospheric Physics, Chinese Academy of Sciences,
Beijing, PR China
6
Purple Mountain Observatory, Chinese Academy of Sciences,
Nanjing, PR China
Received:
8
April
2022
Accepted:
29
April
2022
Abstract
Context. A high-quality astronomical observing site, the Lenghu site, was recently discovered on the Tibetan Plateau. The statistical analysis of site quality monitor data collected so far have indicated that the precipitable water vapor (PWV) is lower than 2 mm for 55% of the night. The nighttime temperature is also very stable; the median of the intranight variation amplitude is only 2.4 °C.
Aims. The long-term trend of the PWV and temperature variations, which is essential for future facilities operating at infrared, millimeter, and submillimeter wavelengths, is investigated in this work.
Methods. Here we used the atmospheric reanalysis datasets of the Modern-Era Retrospective analysis for Research and Applications, Version 2 (MERRA-2) and ERA5, the fifth major atmospheric reanalysis produced by the European Centre for Medium-Range Weather Forecasts (ECMWF), as well as the measurements from the weather station at the site to conduct a long-term (22 yr) comparative analysis of PWV and temperature at the Lenghu site.
Results. The weighted annual mean nighttime temperature and PWV increase at rates of 0.17 °C decade−1 and 0.12 ~ 0.13 mm decade−1, respectively. The nighttime temperature and PWV slightly both decrease during the winter with rates of −0.04 °C decade−1 and −0.05 ~ −0.07 mm decade−1, respectively.
Conclusions. These results indicate that the variation patterns of PWV and temperature at the Lenghu site are quite stable, especially during the winter; it is projected that the nighttime average PWV will be below 1 mm and the nighttime average temperature will be below −13 °C toward the end of this century. These conditions are ideal for large optical, infrared, millimeter, and submillimeter facilities where great scientific discoveries will be made that address the ultimate questions of humankind.
Key words: site testing / telescopes / methods: statistical / atmospheric effects
e-mail: This email address is being protected from spambots. You need JavaScript enabled to view it.
© Y. Zhao et al. 2022
 Open Access article, published by EDP Sciences, under the terms of the Creative Commons Attribution License (https://creativecommons.org/licenses/by/4.0), which permits unrestricted use, distribution, and reproduction in any medium, provided the original work is properly cited.
This article is published in open access under the Subscribe-to-Open model. This email address is being protected from spambots. You need JavaScript enabled to view it. to support open access publication.
1 Introduction
When planning very large aperture ground-based telescopes and the subsidiary instrumentations, strict qualification of the site is essential. Among other fundamental site quality parameters, small enough total seeing and low enough precipitable water vapor are particularly critical to guarantee that the huge investments are rewarded with the commitments of the big science goals that can only be done at these mega facilities (Schöck et al. 2009).
The astronomical observing site at the northern edge of the Tibetan Plateau, Lenghu, has been identified as an excellent site for optical–infrared observations (Deng et al. 2021). The site is located at a local summit on Saishiteng Mountain near Lenghu Town in Qinghai Province. The site testing data collected so far reveal that the median seeing at the site is 0.75 arcseconds, and 70% of the nights are clear with photometric conditions. The PWV is lower than 2 mm for 55% of the nighttime. To date, the dataset deriving these parameters has covered over three full annual cycles. Based on the current site quality assessments (natural observing conditions, accessibility, and existing infrastructure), a number of research projects have already started construction at the site, including telescopes with apertures larger than 2.5 m. A 6.5 m telescope is also planned to come to the site. The longitudinal coordinate of this site is very attractive for research campaigns in time-domain sciences. This makes the site a future international target for developing new ground-based mega projects.
Developing a new astronomical observatory from scratch that is good for large observing facilities at a rural location involves a number of issues in the decision-making process. Sustainability over a long timescale in the future, especially with regard to light pollution (Green et al. 2022), and long-term variations in the critical site parameters are obviously very important. This is especially true for the Lenghu site, although the current quality is well constrained. The qualification of the Lenghu site is based on more than three years of study, and high duty cycle monitoring data for the early establishment of an observatory has started; however, the long-term trends and inter-annual variability for the site parameters are yet to be studied.
The future behaviors of the parameters of an observing site can usually be predicted by historical records, but this is not possible for a new site. For the Lenghu site this difficulty is due to the absence of ground-based meteorological stations in this sparsely inhabited region with an elevation generally higher than 3000 m above sea level. Fortunately, we can trace the critical weather data from archived satellite data. In this work we make use of the long-term high spatiotemporal climate datasets, including satellite remote sensing data, for example near-infrared measurements from the Moderate Resolution Imaging Spectrometer (MODIS; Gao & Goetz 1990), and reanalysis datasets, such as ERA5 (Hersbach et al. 2020) and the Modern-Era Retrospective analysis for Research and Applications, Version 2 (MERRA-2; Gelaro et al. 2017). Since most remote sensing satellites operate in low-Earth orbits, the spatial and temporal coverage cannot be well balanced, and it is difficult to obtain high-resolution continuous time series of PWV and temperature. Therefore, in this study we used the reanalysis datasets to evaluate the long-term variations of PWV and temperature at the Lenghu site. Benefitting from the unprecedented uniformity, fidelity, and completeness of the reanalysis data, they have already been reliably used to assess the PWV at different sites, such as the South Pole, Chajnantor, and Cerro Chajnantor (e.g., Kuo 2017; Cortés et al. 2020). The data used in this work and the algorithm to derive PWV are presented in Sect. 2. The analyzing process and results are given in Sect. 3.
2 Data
The MERRA-2 reanalysis data are provided by NASA’s Global Modeling and Assimilation Office (GMAO), and follow the previous version of MERRA. The horizontal grid is 0.625° × 0.5°, corresponding to a spatial resolution of ~50 km. Variables are provided at 72 model layers. Detailed information of the data can be found in the MERRA-2 file specification document1. In this study we use the instantaneous 3-dimensional 3-hourly (inst3_3d_asm_Nv) dataset.
The ERA5 is the latest reanalysis by the European Centre for Medium Range Weather Forecast (ECMWF). The data is the follow-up product of ERA-Interim provided by the ECMWF. The horizontal grid of the atmospheric component is 0.25° × 0.25°, corresponding to a spatial resolution of ~25 km. Variables are provided at 37 model layers with temporal resolution of one hour. Detailed information of the data can be found in the ERA5 file specification document2.
The Lenghu site is on the northern edge of the Tibetan Plateau; it is large, and is at a summit rising up from Qaidam basin (average altitude 3000 m) with a relative altitude of 1200 m in a distance of less than 20 km. To assess the variation patterns of the climate properties on a long-term basis, more geographic information is needed and can be expressed as follows: the site is located to the east of the Altyn Mountains and on the northern edge of the Qaidam Basin (Pullen et al. 2011; Deng et al. 2021), which is a complex of several summits on the peak ridge of the Saishiteng mountain (Fig. 1); the site test campaign was carried out at Lenghu-C (38.6068° N, 93.8961° E), as shown by the red star in Fig. 1. The site parameter measurements were taken at an elevation of ~4200 m above sea level (~607 hPa). The nearest grid in the reanalysis dataset is adopted. For both MERRA-2 and ERA5 the grid is 38.5° N and 93.75° E, as indicated by the white rectangles in Fig. 1. In addition, to better compare the results of MERRA-2 and ERA5, the three-hour MERRA-2 data are interpolated to one-hour resolution in our calculations.
The PWV in the whole atmosphere at a specified elevation can be calculated as (Qian et al. 2019; Wang et al. 2019; Deng et al. 2021)
 (1)
(1)
where ρ is the density of liquid water, g is the acceleration of gravity, pc and pz are the lower and upper pressure levels for the integration, and q is the specific humidity. The parameters pz and q are available from the data of MERRA-2 and ERA5. The lower boundary of the integration pc = 607 hPa is the pressure at Lenghu-C, and the upper boundary of the integration pz is that of the reanalysis data. Since the model levels do not exactly match the pressure level at Lenghu-C, extra pressure correction is necessary. Assuming the pressure level that is nearest to the pressure at Lenghu-C is pm (the mth pressure level in the dataset with a minimum of zero) with a pressure thickness of ∆pm in the reanalysis data, the equation can be revised as
 (2)
(2)
where qm and qm−1 is the specific humidity in the mth and (m-1)th levels, respectively. For the temperature in the reanalysis data, we use interpolation to get the exact temperature at pc. In the following sections, the PWV and temperature calculated from MERRA-2 and ERA5 are first compared with the ground weather station measurements at Lenghu-C to verify the accuracy of reanalysis data and its applicability to Lenghu. Then the nighttime variations, seasonal variations, long-term trends of PWV and temperature at the Lenghu site are be analyzed and investigated in detail.
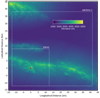 |
Fig. 1 Elevation map of Lenghu site. The ground weather station at Lenghu-C (38.6068° N, 93.8961° E) is indicated by the red star. The grids of MERRA-2 and ERA5 used in our analysis are denoted by the white rectangles. |
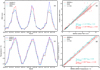 |
Fig. 2 Monthly mean changes in PWV (panel a) and temperature (panel c). Panels b and d: correlation of MERRA-2 and ERA5 data with weather station data in PWV and temperature. The shaded areas in (b) and (d) define the 95% confidence intervals. |
3 Results
3.1 Comparison between observational and modeling results
In order to check the accuracy and consistency of the PWV and temperature derived from MERRA-2 and ERA5, we compared PWV and temperature with respect to those of the ground weather station at Lenghu-C. The comparison was made in a time window from January 2019 to December 2021 for which we have a complete weather dataset on the ground; the results are shown in Fig. 2. Figure 2 demonstrates the monthly mean changes in PWV and temperature, as well as the correlations of MERRA-2 and ERA5 data with weather station data (Lenghu-C). It can be seen from the figure that the fitting goodness is very fine, with the adjusted R2 being 0.92 or higher. The mean systematic difference in PWV between MERRA-2 and Lenghu-C is 0.24 mm, and that for ERA5 is 0.33 mm. The temperature values from MERRA-2 and EAR5 are lower than Lenghu-C by 0.77 °C and 1.62 °C, respectively. Such good agreements between the datasets suggest that both MERRA-2 and ERA5 can reliably be used to analyze the long-term trend at the Lenghu site. These small systematic differences are then subtracted from the MERRA-2 and ERA5 data to mimic the ground level situation. In the following sections, MERRA-2 and ERA5 data from 2000 to 2021 (22 yr), covering two solar cycles, are used to reveal the seasonal and interannual variations of PWV and temperature at the Lenghu site.
3.2 Interannual variations
We analyzed the seasonal changes in PWV and temperature at the Lenghu site between 2000 and 2021 using MERRA-2 and ERA5, respectively. For PWV, we also analyzed seasonal variations during the daytime and nighttime (determined according to astronomical night). Figures 3 and 4 show annual means of daytime and nighttime PWVs at the Lenghu site obtained from MERRA-2 and ERA5, respectively. The decadal change rates for all the profiles are also shown in the legends. The variations of PWV have the following characteristics:
The seasonal variation trends from MERRA-2 and ERA5 agree closely with each other.
The site is very seasonal in terms of PWV. The basic pattern is high in summer (June-August), and low in winter (December-February); the value in autumn (September-November) is slightly higher than in spring (March-May). The difference between daytime and nighttime is very small.
PWVs during daytime and nighttime at the Lenghu site are stable in spring, autumn, and winter over the past two decades, with mean values of 2.22, 2.66, and 1.08 mm, respectively. For MERRA-2, the interannual fluctuation amplitudes during spring, summer, autumn, and winter are 0.35, 1.42, 0.63, and 0.20 mm for daytime, and 0.43, 1.45, 0.62, and 0.21 mm for nighttime, respectively. For ERA5, the interannual fluctuation amplitudes during the four seasons are 0.35, 1.33, 0.62, and 0.21 mm for daytime, and 0.40, 1.54, 0.56, and 0.19 mm for nighttime, respectively.
The decadal change rates in the three seasons are around 0.1 mm decade−1. A minor descending trend is seen in winter from our analysis, with a decrease rate of −0.07 mm decade−1 for MERRA-2 and −0.05 mm decade−1 for ERA5 during nighttimes. In summer, however, both MERRA-2 and ERA5 indicate an obvious growing trend, with an increased rate of 0.63 mm decade−1 and 0.41 mm decade−1 at night, and 0.54 mm decade−1 and 0.28 mm decade−1 during the day, respectively.
The variations of nighttime temperatures in Fig. 5 have the following characteristics:
Both MERRA-2 and ERA5 show the same variation trend in all seasons, but the temperature in ERA5 is about 1 °C lower than that in MERRA-2.
The average nighttime temperatures are 6 °C in summer, −5 °C in spring and autumn, and −13 °C in winter. Generally, the nighttime temperatures at the Lenghu site are below zero except in summer. The nighttime temperatures are not as stable as PWV over the last two decades. The maximum annual variation is as large as ~6 °C (e.g., there is a sudden decrease of ~6 °C from 2017 to 2018).
In the past two decades the nighttime temperatures at the Lenghu site appear to be relatively stable. The interannual fluctuation amplitudes during the four seasons are 1.41 °C, 1.46 °C, 1.23 °C, and 1.81 °C for MERRA-2, and 1.30 °C, 1.47 °C, 1.17 °C, and 1.91 °C for ERA5, respectively.
The average nighttime temperatures in summer are nearly constant, MERRA-2 has a very weakly decreasing trend of −0.05 °C decade−1, and ERA5 is −0.03 °C decade−1. In winter, MERRA-2 and ERA5 show a decreasing trend of −0.04 °C decade−1. Clearly, increasing trends occur in spring and autumn, respectively 0.38 °C decade−1 and 0.25 °C decade−1 for MERRA-2, and 0.38 °C decade−1 and 0.18 °C decade−1 for ERA5.
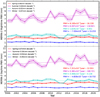 |
Fig. 3 Seasonal changes in PWV at the Lenghu site obtained from MERRA-2, including the nighttime (upper panel) and daytime (lower panel). The shaded area shows the mean values of the daily standard deviation of PWV. |
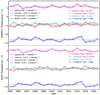 |
Fig. 5 Seasonal changes in nighttime temperature at Lenghu site obtained from MERRA-2 (upper panel) and ERA5 (lower panel). The shaded area shows the mean values of the daily standard deviation of temperature. |
3.3 Weighted annual mean variations
To assess the long-term projected observing conditions at the Lenghu site, we calculated the annual mean nighttime PWV and temperature weighted by astronomical night to further investigate the long-term variations during astronomical nights. On each day we assume the beginning and end of astronomical night to be tbeg and tend, and the corresponding mean PWV and temperature during the astronomical night are PWVtwi and Ttwi, respectively. The total time of astronomical night ttotal in a year is
 (3)
(3)
Then, the annual mean weighted by astronomical night PWVwam and Twam are calculated as
 (4)
(4)
 (5)
(5)
The standard deviations of PWVwam and Twam are calculated as
 (6)
(6)
 (7)
(7)
where δPWVtwi and δTtwi are the standard deviations of PWVtwi and Ttwi during each astronomical night. We note that only the whole hours during each astronomical night are considered; the fractional hours at both ends are not included. This will induce an uncertainty of 0.27% in PWVwam and Twam, which will not affect the results presented below. Finally, the long-term trends of PWVtwi and Ttwi are shown in Fig. 6. As shown in Fig. 6, both the PWV and temperature show an increasing trend over the past two decades. On an annual scale, the PWV increases at a rate of 0.07 ~ 0.15 mm decade−1, and the temperature increases at a rate of 0.17 °C decade−1. If we refer to Figs. 3–5, it can be found that the increasing trend in PWV is primarily contributed by the summer, while the increasing trend in temperature is primarily contributed by spring and autumn, while both PWV and temperature are very low and stable in winter.
The percentage of the observing time with PWV of less than 2 mm is a measure to assess the quality of a site, which is set as one of the critical parameters for both Ε-ELT and TMT (Schöck et al. 2009). To accurately evaluate the time with PWV less than 2 mm, the hourly PWV during the astronomical night is used. First, the total time of astronomical night (the theoretical observing time) is calculated as tyear, which is the sum of integrated time in hours during each night. Then we count the total time in hours with PWV < 2 mm during each night to get the total time during each year (tpwv < 2) The percentage is calculated as tPWV < 2/tyear. We also calculated the corresponding percentage during daytime since there are solar telescopes at the Lenghu site. According to the longitude of Lenghu, the daytime refers to universal time (UT) of 1–7 h, corresponding to local solar time of 11–17 h at Lenghu. The results are shown in Fig. 7. It is shown that the percentage generally been decreasing during the past two decades at a rate of ~1% per decade during both daytime and nighttime. This decreasing trend is anti-proportional to the increasing trend in the annual mean variations shown in Fig. 6. It is also clear that the percentage of daytime is generally smaller than that of nighttime. It is worth noting that the decreasing trends of the percentages are mainly contributed by the increasing trends of PWV during summer, as shown in Figs. 3 and 4.
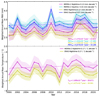 |
Fig. 6 Weighted annual mean changes of PWV (upper panel) and temperature (lower panel) at Lenghu site using MERRA-2 and ERA5. respectively. The shaded area shows the standard deviations of PWVwam and Twam. |
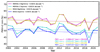 |
Fig. 7 Variation in the proportion of PWV at Lenghu site of less than 2 mm using the data of MERRA-2 and ERA5. |
3.4 Intranight variations of PWV and temperature
In this section we investigate the annual variations of the intranight amplitudes (peak to valley) of both PWV and temperature. First the intranight amplitude variation for each day is calculated. Then a superposed epoch analysis is performed to obtain the annual profiles shown in Fig. 8. The gray region in each panel shows the standard deviation of the intranight variation amplitudes during 2000 and 2021. Both MERRA-2 and ERA5 show similar trends. For PWV, the variation amplitudes are the largest (~1.5 mm) in summer at the Lenghu site and the smallest (~0.5 mm) in winter. For temperature, the intranight variation amplitudes are generally smaller than 2 °C, indicating very stable air temperatures at night throughout the year.
Figure 9 shows the annual variations of the intranight amplitudes of PWV and temperature in winter. It is shown that the annual mean of the amplitudes of PWV has slowly decreased over the past two decades, at a rate of −0.02 −0.05 mm decade−1, while the annual mean of the amplitudes of temperature has slightly increased at a speed of 0.06 ~ 0.07 °C decade−1. The large interannual fluctuations might be related to the change in climate on a larger scope, which needs further investigation.
4 Summary and conclusion
Among all the quality parameters characterizing the site of a ground-based astronomical observatory, the PWV and temperature at the elevation of the instruments are two key factors. The PWV determines the total extinction of photons coming from celestial objects at infrared and millimeter-submillimeter wavelengths. The smaller the PWV, the higher the transmission at these wavelengths. The amplitude of the temperature variation at night is a measure of the stability of the local air at the ground level and above the site, and thus the ground layer contribution can be linked to the total seeing at the site. The previous investigation of site quality demonstrated that the Lenghu site has very low PWV and stable temperature at night (Deng et al. 2021) based on the site testing dataset. In this work we explored the long-term trend of PWV and temperature changes.
We combined the local weather station data with long-term data from MERRA-2 and ERA5, and analyzed in detail the PWV and temperature changes at the Lenghu site over the past two decades. The PWV at the Lenghu site remains basically stable in all seasons except summer. In summer an increasing trend has been observed. No sensible trend of temperature change was found for summer and winter, but there is a trend of increasing temperature in spring and autumn. The long-term trend of the annual mean nighttime temperature has an increasing tendency at a rate of about 0.17 °C decade−1. This rate is lower than the observed and projected warming rates of both the Tibetan Plateau and the globe (Zhang et al. 2013; Lu et al. 2015; Kuang & Jiao 2016; Guo & Tang 2021). The long-term growth trend of annual mean nighttime PWV is nearly the same for the two datasets (MERRA-2: 0.13 mm decade−1, ERA5: 0.12 mm decade−1). For daytime PWV at the Lenghu site, however, there is also a growth trend (MERRA-2: 0.15 mm decade−1, ERA5: 0.07 mm decade−1). The main conclusions are as follows:
The nighttime PWV and temperature retrieved from long-term reanalysis datasets confirm the observed results presented in Deng et al. (2021), which is characterized by very low PWV (~1.0 mm with intranight variation amplitude smaller than 0.5 mm), very low and stable temperature in winter (~−13 °C with intranight variation amplitude smaller than 2 °C), further confirming that the local region at the Lenghu site and surroundings are quite dry and cold.
According to the long-term variation trend of nighttime PWV during winter over the past two decades (−0.05 ~ −0.07 mm decade−1), it is projected that the nighttime PWV will be at the level of ~0.5 mm toward the end of this century.
For the nighttime temperature in winter, the decreasing rate of −0.04 °C decade−1 over the past two decades indicates that the nighttime temperature at the Lenghu site would be lower than −13 °C toward the end of this century.
The current work will be a reference for the projects that are currently being built at the site, and can be used as a guideline for future large telescopes, instrumentations, and scientific programs.
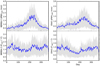 |
Fig. 8 Daily nighttime PWV and temperature variation patterns in 2000-2021 from the MERRA-2 and ERA5. The upper panel is for PWV, while the lower is for temperature. The gray region in each panel shows the standard deviation of the intranight variation amplitudes from 2000 to 2021. |
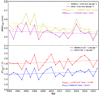 |
Fig. 9 Annual variations of the intranight amplitudes of PWV (upper panel) and temperature (lower panel) in winter. |
Acknowledgements
This work is supported by the Major Science and Technology Project of Qinghai Province (2019-ZJ-A10), the Youth Innovation Promotion Association of the Chinese Academy of Sciences (Y2021027), the Key Research Program of the Institute of Geology and Geophysics, CAS (Grant IGGCAS-201904). The elevation data used in Fig. 1 are provided by AW3D of the Japan Aerospace Exploration Agency (JAXA) available from https://www.eorc.jaxa.jp/ALOS/en/aw3d38/data/index.html, and one can register a username and password to freely access the data.
References
- Cortés, F., Cortés, K., Reeves, R., Bustos, R., & Radford, S. 2020, A&A, 640, A126 [NASA ADS] [CrossRef] [EDP Sciences] [Google Scholar]
- Deng, L., Yang, F., Chen, X., et al. 2021, Nature, 596, 353 [CrossRef] [Google Scholar]
- Gao, B.-C., & Goetz, A. F. H. 1990, J. Geophys. Res., 95, 3549 [NASA ADS] [CrossRef] [Google Scholar]
- Gelaro, R., McCarty, W., Suarez, M. J., et al. 2017, J. Clim., 30, 5419 [NASA ADS] [CrossRef] [Google Scholar]
- Green, R. F., Luginbuhl, C. B., Wainscoat, R. J., & Duriscoe, D. 2022, A&ARv, 30, 1 [NASA ADS] [CrossRef] [Google Scholar]
- Guo, T., & Tang, Y. 2021, J. Appl. Meteorol. Climatol., 60, 829 [NASA ADS] [Google Scholar]
- Hersbach, H., Bell, B., Berrisford, P., et al. 2020, Q. J. R. Meteorol. Soc., 146, 1999 [NASA ADS] [CrossRef] [Google Scholar]
- Kuang, X., & Jiao, J. J. 2016, J. Geophys. Res. Atmos., 121, 3979 [NASA ADS] [CrossRef] [Google Scholar]
- Kuo, C.-L. 2017, ApJ, 848, 64 [NASA ADS] [CrossRef] [Google Scholar]
- Lu, N., Trenberth, K. E., Qin, J., Yang, K., & Yao, L. 2015, J. Clim., 28, 1707 [NASA ADS] [CrossRef] [Google Scholar]
- Pullen, A., Kapp, P., McCallister, A. T., et al. 2011, Geology, 39, 1031 [NASA ADS] [CrossRef] [Google Scholar]
- Qian, X., Yao, Y., Zou, L., Wang, H., & Yin, J. 2019, PASP, 131, 125001 [NASA ADS] [CrossRef] [Google Scholar]
- Schöck, M., Els, S., Riddle, R., et al. 2009, PASP, 121, 384 [Google Scholar]
- Wang, Z., Zhou, X., Xing, Z., et al. 2019, Theor. Appl. Climatol., 137, 1541 [NASA ADS] [CrossRef] [Google Scholar]
- Zhang, D., Huang, J., Guan, X., Chen, B., & Zhang, L. 2013, J. Quant. Spec. Radiat. Transf., 122, 64 [NASA ADS] [CrossRef] [Google Scholar]
All Figures
|
Fig. 1 Elevation map of Lenghu site. The ground weather station at Lenghu-C (38.6068° N, 93.8961° E) is indicated by the red star. The grids of MERRA-2 and ERA5 used in our analysis are denoted by the white rectangles. |
| In the text | |
|
Fig. 2 Monthly mean changes in PWV (panel a) and temperature (panel c). Panels b and d: correlation of MERRA-2 and ERA5 data with weather station data in PWV and temperature. The shaded areas in (b) and (d) define the 95% confidence intervals. |
| In the text | |
|
Fig. 3 Seasonal changes in PWV at the Lenghu site obtained from MERRA-2, including the nighttime (upper panel) and daytime (lower panel). The shaded area shows the mean values of the daily standard deviation of PWV. |
| In the text | |
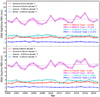 |
Fig. 4 Same as Fig. 2, but for ERA5. |
| In the text | |
|
Fig. 5 Seasonal changes in nighttime temperature at Lenghu site obtained from MERRA-2 (upper panel) and ERA5 (lower panel). The shaded area shows the mean values of the daily standard deviation of temperature. |
| In the text | |
|
Fig. 6 Weighted annual mean changes of PWV (upper panel) and temperature (lower panel) at Lenghu site using MERRA-2 and ERA5. respectively. The shaded area shows the standard deviations of PWVwam and Twam. |
| In the text | |
|
Fig. 7 Variation in the proportion of PWV at Lenghu site of less than 2 mm using the data of MERRA-2 and ERA5. |
| In the text | |
|
Fig. 8 Daily nighttime PWV and temperature variation patterns in 2000-2021 from the MERRA-2 and ERA5. The upper panel is for PWV, while the lower is for temperature. The gray region in each panel shows the standard deviation of the intranight variation amplitudes from 2000 to 2021. |
| In the text | |
|
Fig. 9 Annual variations of the intranight amplitudes of PWV (upper panel) and temperature (lower panel) in winter. |
| In the text | |
Current usage metrics show cumulative count of Article Views (full-text article views including HTML views, PDF and ePub downloads, according to the available data) and Abstracts Views on Vision4Press platform.
Data correspond to usage on the plateform after 2015. The current usage metrics is available 48-96 hours after online publication and is updated daily on week days.
Initial download of the metrics may take a while.