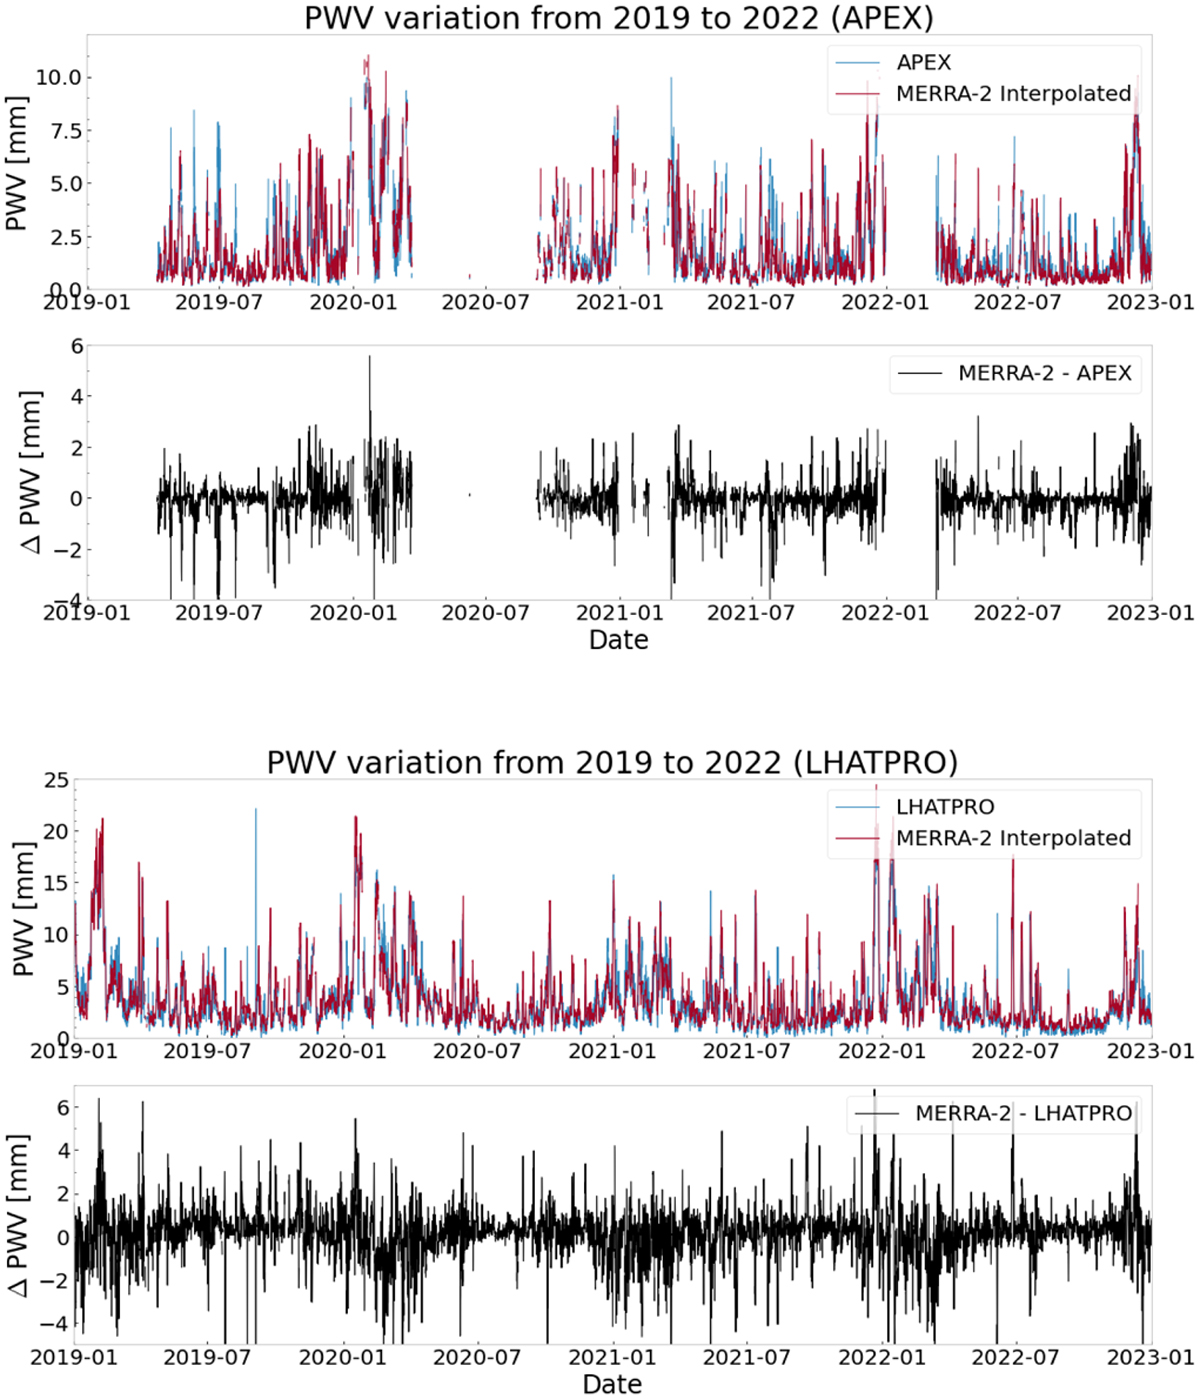
Fig. 2
Download original image
Temporal plots of PWV for the APEX (top panel) and LHAT-PRO (bottom panel) study sites through the years 2019-2022. The upper plot shows (in blue) the radiometric measurements and (in red) the MERRA-2 bidimensionally interpolated data. The lower plots (black line) show the numerical differences between the MERRA-2 interpolated estimate and the site measurements.
Current usage metrics show cumulative count of Article Views (full-text article views including HTML views, PDF and ePub downloads, according to the available data) and Abstracts Views on Vision4Press platform.
Data correspond to usage on the plateform after 2015. The current usage metrics is available 48-96 hours after online publication and is updated daily on week days.
Initial download of the metrics may take a while.