Fig. 6
Download original image
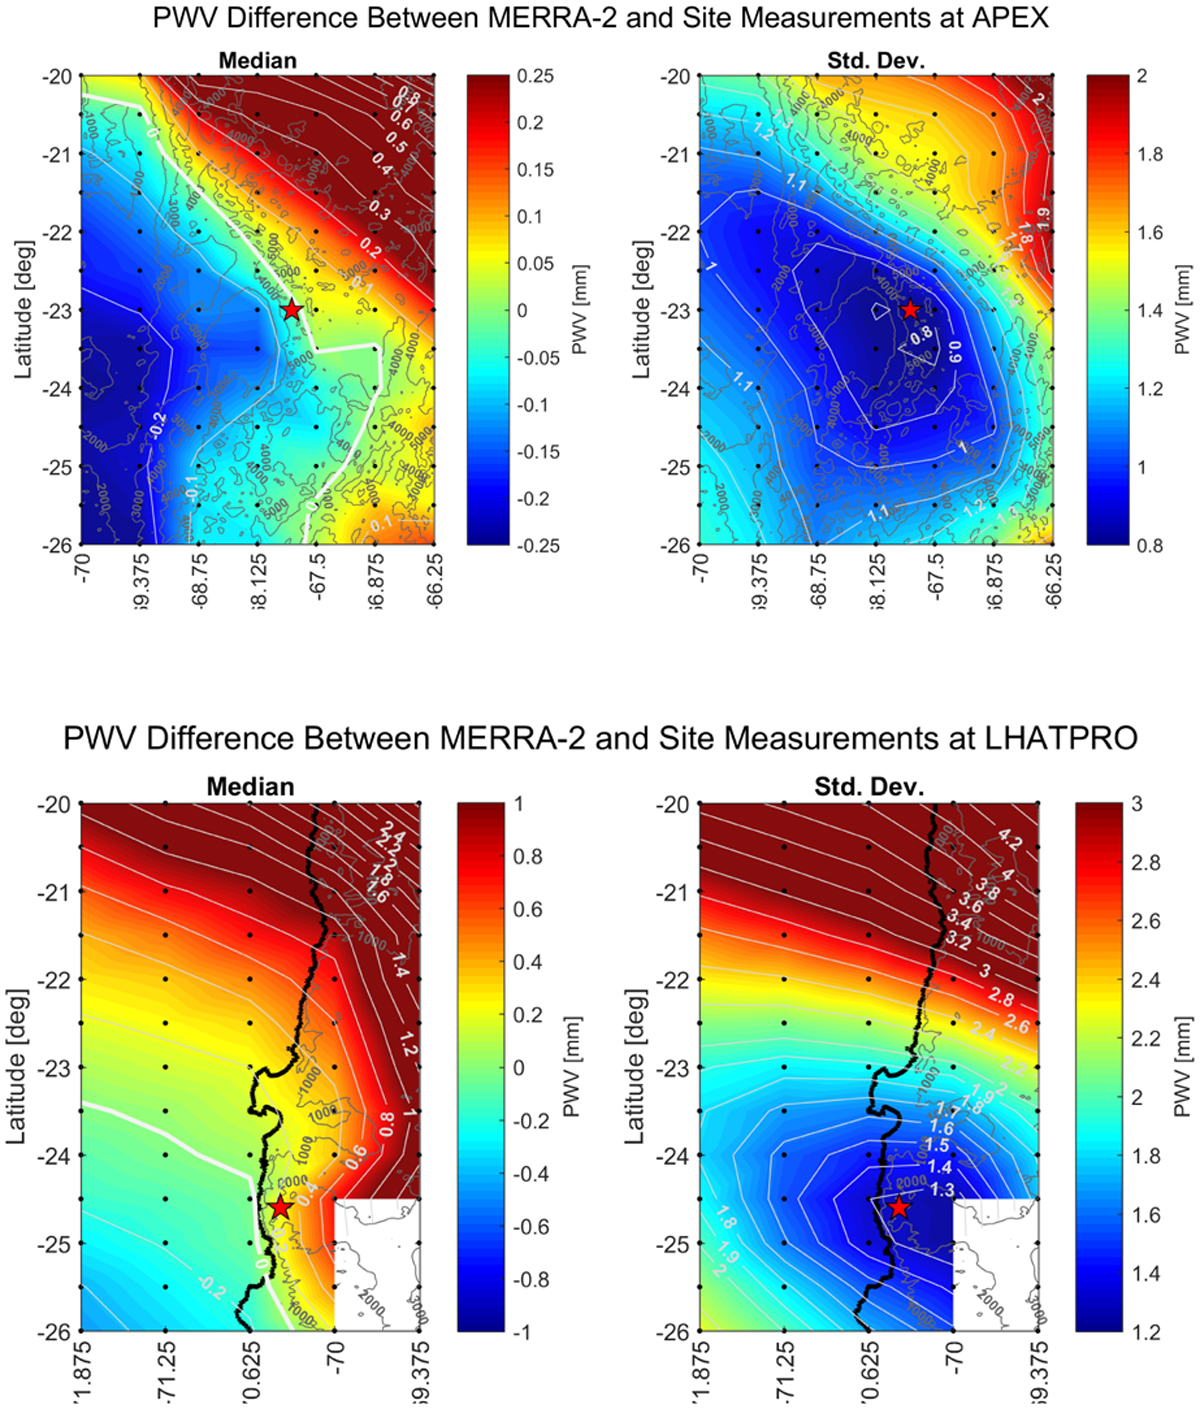
Maps of the median and standard deviation of the difference between site measurements and MERRA-2 values (top) at the pressure of the APEX site (555 mbar) and (bottom) at the pressure of the LHATPRO site (742 mbar) during the year 2019. The black dots represent MERRA-2 grid point locations, and the red star indicates the respective site location.
Current usage metrics show cumulative count of Article Views (full-text article views including HTML views, PDF and ePub downloads, according to the available data) and Abstracts Views on Vision4Press platform.
Data correspond to usage on the plateform after 2015. The current usage metrics is available 48-96 hours after online publication and is updated daily on week days.
Initial download of the metrics may take a while.