Fig. 8
Download original image
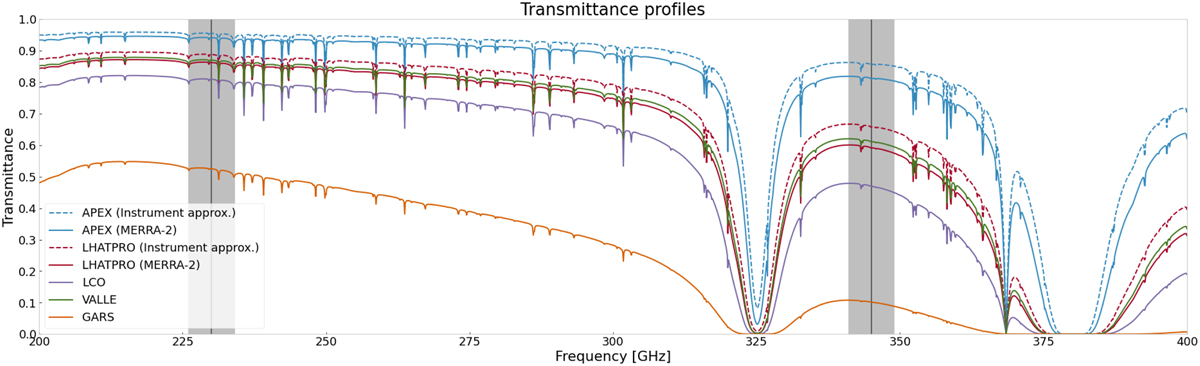
Transmittance profiles for the 50th percentile. The profiles were obtained with the am software using interpolated MERRA-2 atmospheric data for both APEX and LHATPRO as well as the three new sites of interest for the ng-EHT, shown in Table 2, located in Chile and Antarctica (Raymond et al. 2021). The dashed lines represent the estimated transmittance obtained by scaling the water content profile to the measurements for both APEX and LHATPRO. The two black lines along with their gray bands are the two new frequencies of interest: 230 GHz and 345 GHz, respectively. The bands have an arbitrary width of ±4 GHz from the frequency value of interest.
Current usage metrics show cumulative count of Article Views (full-text article views including HTML views, PDF and ePub downloads, according to the available data) and Abstracts Views on Vision4Press platform.
Data correspond to usage on the plateform after 2015. The current usage metrics is available 48-96 hours after online publication and is updated daily on week days.
Initial download of the metrics may take a while.