Fig. 3
Download original image
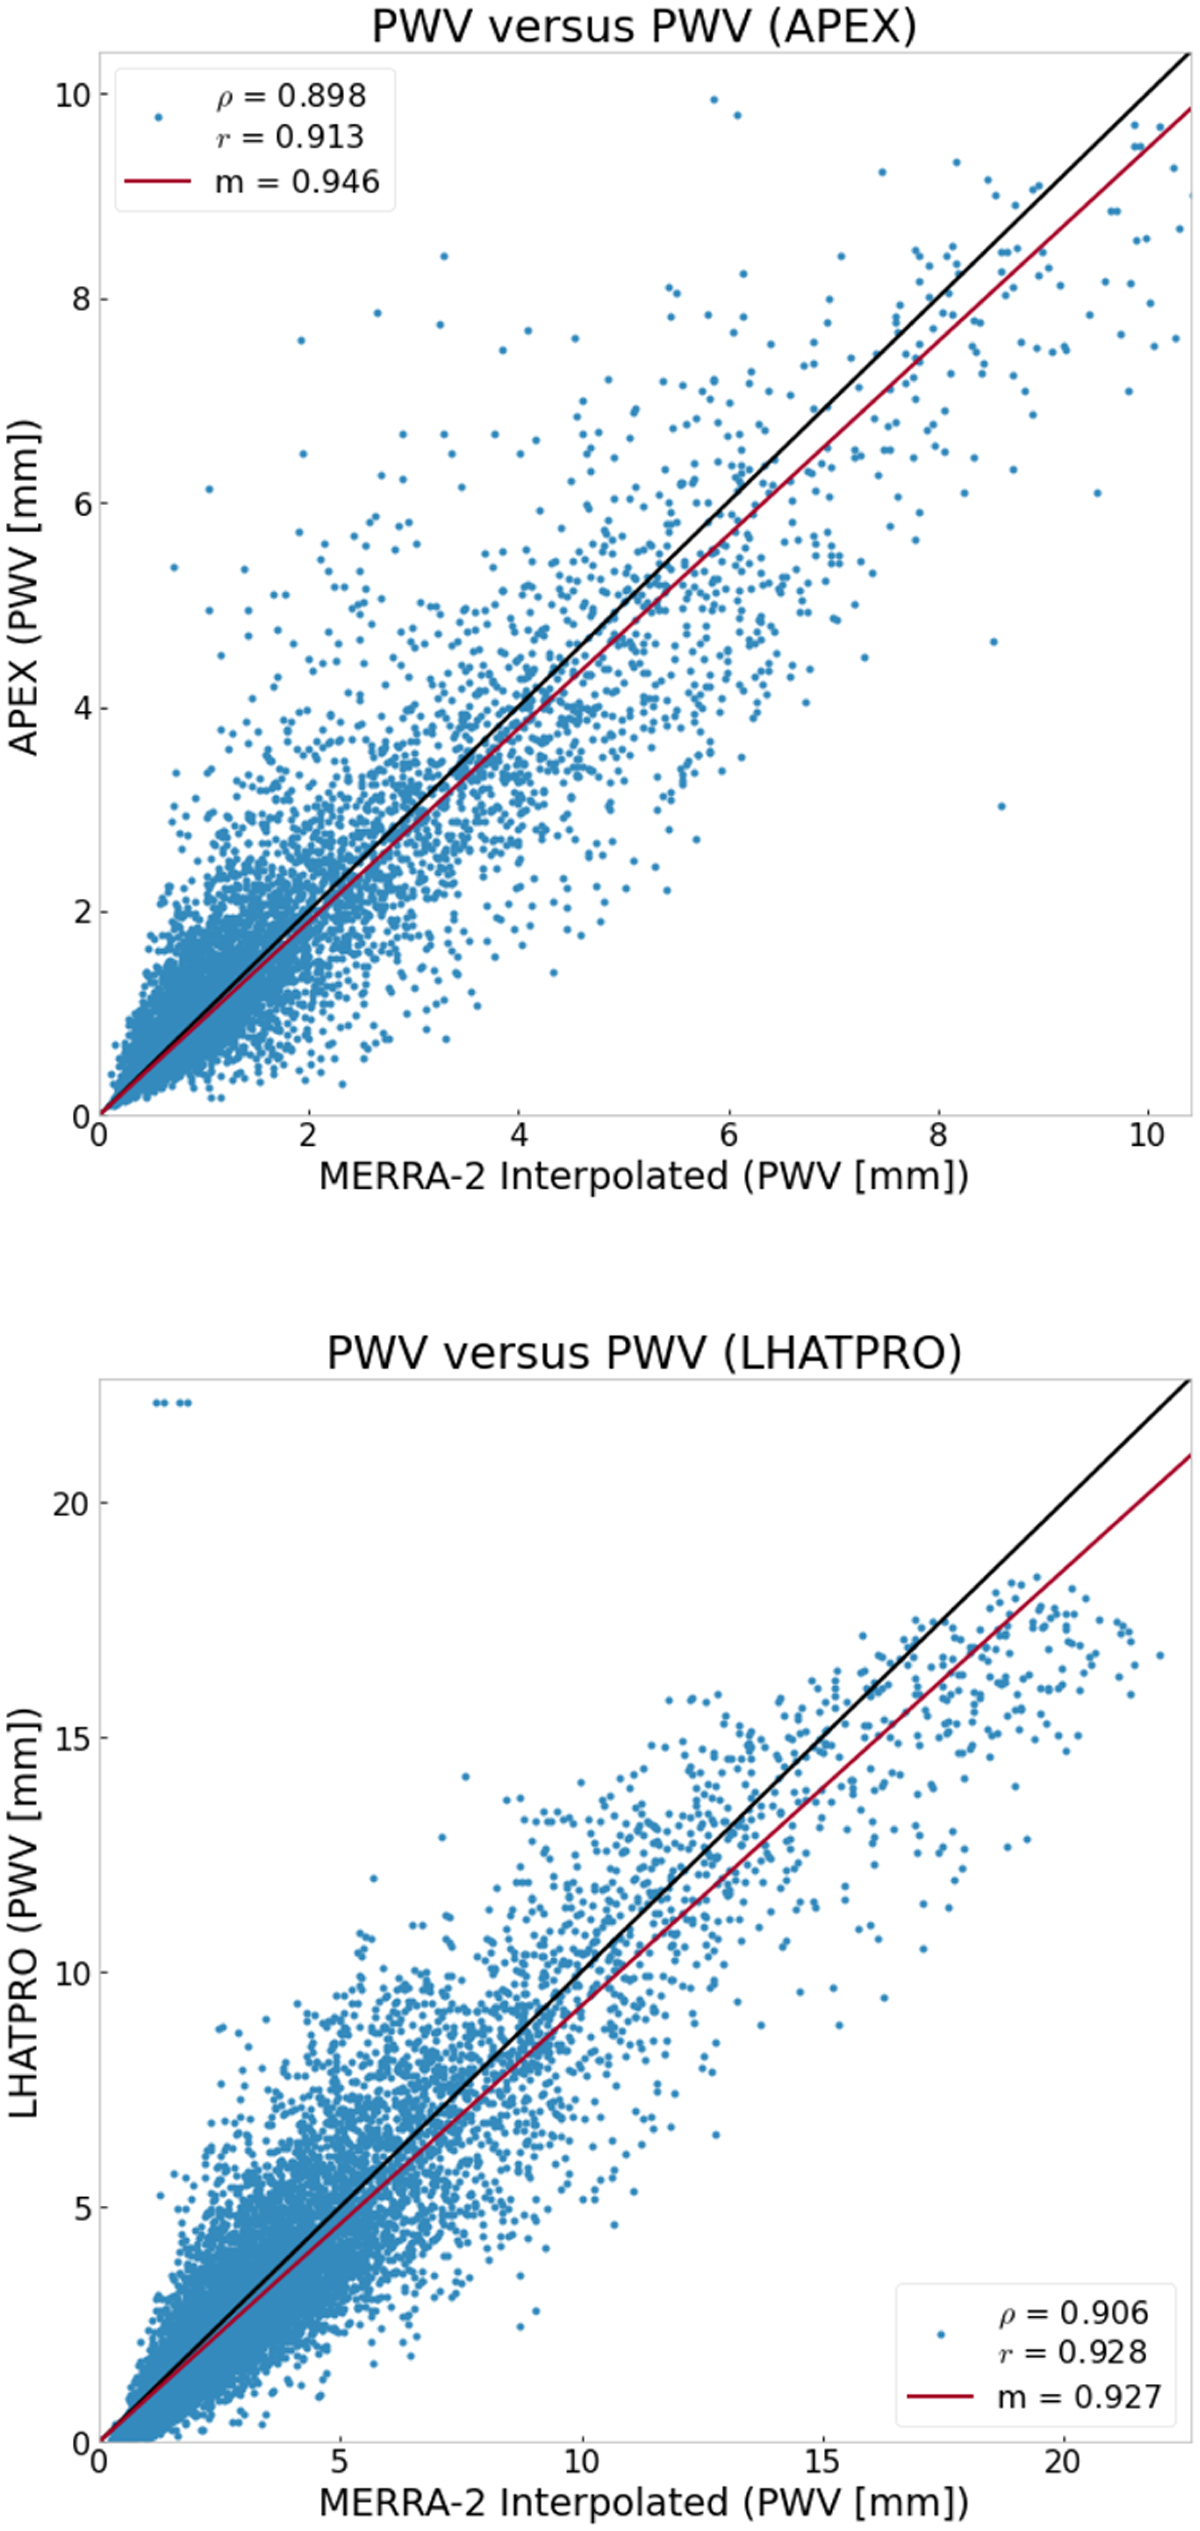
PWV versus PWV plots (blue dots) comparing the site measurements and the data obtained by the interpolation of MERRA-2 data at APEX (bottom panel) and LHATPRO (bottom panel) sites. The red line represents the robust linear regression, and the black line represents the 1:1 line. The legend values indicate the Spearman correlation coefficient (ρ), the Pearson correlation coefficient (r), and the slope of the linear regression (m; defined by the equation PWVsite = m* PWVmerra-2).
Current usage metrics show cumulative count of Article Views (full-text article views including HTML views, PDF and ePub downloads, according to the available data) and Abstracts Views on Vision4Press platform.
Data correspond to usage on the plateform after 2015. The current usage metrics is available 48-96 hours after online publication and is updated daily on week days.
Initial download of the metrics may take a while.