| Issue |
A&A
Volume 681, January 2024
|
|
|---|---|---|
| Article Number | A19 | |
| Number of page(s) | 19 | |
| Section | Planets and planetary systems | |
| DOI | https://doi.org/10.1051/0004-6361/202347109 | |
| Published online | 05 January 2024 | |
Disk Evolution Study Through Imaging of Nearby Young Stars (DESTINYS): HD 34700 A unveils an inner ring★
1
Department of Physics and Astronomy “Galileo Galilei” – University of Padova,
Vicolo dell’Osservatorio 3,
35122
Padova, Italy
e-mail: This email address is being protected from spambots. You need JavaScript enabled to view it.
2
INAF – Osservatorio Astronomico di Padova,
Vicolo dell’Osservatorio 5,
35122
Padova, Italy
3
Department of Physics, University of Rome Tor Vergata,
Via della Ricerca Scientifica 1,
00133
Rome, Italy
4
School of Natural Sciences, Centre for Astronomy, University of Galway,
Galway
H91 CF50, Ireland
5
ETH Zürich – Institute for Particle Physics and Astrophysics,
Wolfgang-Pauli Str. 27,
8093
Zürich, Switzerland
6
Institute for Astronomy, University of Hawaii at Manoa,
Honolulu, HI
96822, USA
7
Department of Astronomy, University of Florida,
Gainesville, FL
32611, USA
8
Univ. Grenoble Alpes, CNRS, IPAG,
38000
Grenoble, France
9
Université Côte d’Azur, Observatoire de la Côte d’Azur, CNRS, Laboratoire Lagrange,
06304
Nice, France
10
University Observatory, Faculty of Physics, Ludwig-Maximilians-Universität München,
Scheinerstr. 1,
81679
Munich, Germany
11
Exzellenzcluster ORIGINS,
Boltzmannstr. 2,
85748
Garching, Germany
12
Anton Pannekoek Institute for Astronomy, University of Amsterdam,
Science Park 904,
1098XH
Amsterdam, The Netherlands
13
Dipartimento di Fisica, Università degli Studi di Milano,
Via Celoria 16,
Milano
20133, Italy
14
Mullard Space Science Laboratory, University College London,
Holmbury St Mary,
Dorking, UK
15
Max-Planck-Institut für extraterrestrische Physik,
Giessenbachstrasse 1,
85748
Garching, Germany
16
Institute of Astronomy, University of Cambridge,
Madingley Road,
Cambridge
CB3 0HA, UK
17
LESIA, Observatoire de Paris, Université PSL, CNRS,
5 Place Jules Janssen,
92190
Meudon, France
18
European Southern Observatory,
Alonso de Córdova 3107, Casilla
19001,
Vitacura, Santiago, Chile
19
Instituto de Estudios Astrofísicos, Facultad de Ingeniería y Ciencias, Universidad Diego Portales,
Av. Ejército Libertador 441,
Santiago, Chile
20
Escuela de Ingeniería Industrial, Facultad de Ingeniería y Ciencias, Universidad Diego Portales,
Av. Ejercito 441,
Santiago, Chile
21
Millennium Nucleus on Young Exoplanets and their Moons (YEMS),
Concepción, Chile
Received:
6
June
2023
Accepted:
13
October
2023
Abstract
Context. The study of protoplanetary disks is fundamental to understand their evolution and interaction with the surrounding environment, and to constrain planet formation mechanisms.
Aims. We aim to characterise the young binary system HD 34700 A, which shows a wealth of structures.
Methods. Taking advantage of the high-contrast imaging instruments SPHERE at the VLT, LMIRCam at the LBT, and of ALMA observations, we analyse this system at multiple wavelengths. We study the morphology of the rings and spiral arms and the scattering properties of the dust. We discuss the possible causes of all the observed features.
Results. We detect for the first time, in the Hα band, a ring extending from ~65 au to ~120 au, inside the ring which is already known from recent studies. These two have different physical and geometrical properties. Based on the scattering properties, the outer ring may consist of grains with a typical size of aout ≥ 4 µm, while the inner ring has a smaller typical size of ain ≤ 0.4 µm. Two extended logarithmic spiral arms stem from opposite sides of the disk. The outer ring appears as a spiral arm itself, with a variable radial distance from the centre and extended substructures. ALMA data confirm the presence of a millimetric dust substructure centred just outside the outer ring, and detect misaligned gas rotation patterns for HD 34700 A and B.
Conclusions. The complexity of HD 34700 A, revealed by the variety of observed features, suggests the existence of one or more disk-shaping physical mechanisms. Our findings are compatible with the presence inside the disk of an as of yet undetected planet of several Jupiter masses and the system interaction with the surroundings, by means of gas cloudlet capture or flybys. Further observations with JWST/MIRI or ALMA (gas kinematics) could shed more light on them.
Key words: protoplanetary disks / binaries: general / methods: observational / planetary systems
Based on observations collected at the European Southern Observatory under ESO programme(s) 1104.C-0415(A), 0108.C-0583(A), and 0108.C-0583(B).
© The Authors 2024
 Open Access article, published by EDP Sciences, under the terms of the Creative Commons Attribution License (https://creativecommons.org/licenses/by/4.0), which permits unrestricted use, distribution, and reproduction in any medium, provided the original work is properly cited.
This article is published in open access under the Subscribe to Open model. This email address is being protected from spambots. You need JavaScript enabled to view it. to support open access publication.
1 Introduction
Recent years have seen an exponential growth in the number of discovered exoplanets and we are now beyond the five thousand milestone1. However, detecting substellar companions within infant systems’ disks has proven to be a much harder task. In fact, the presence of dust and gas left from stellar formation can hide the already faint light from planets and brown dwarfs (Szulágyi et al. 2019; Sanchis et al. 2020; Szulágyi & Garufi 2021). Therefore, it is not surprising that, to date, only in one system were giant planets clearly detected within its transition disk, PDS 70 (Keppler et al. 2018; Mesa et al. 2019; Haffert et al. 2019). Recently, evidence for strongly embedded protoplanets was presented (Boccaletti et al. 2020 and Currie et al. 2022 for AB Aur, Hammond et al. 2023 for HD 169142), demonstrating the efforts required to detect these very young objects at near-infrared and optical wavelengths. The extensive study of protoplanetary disks is crucial to understand the earliest phases of planet formation, drawing an evolutionary path from the raw materials of the disk to the final features of a fully formed system.
In this context, we have studied the young system HD 34700 A (HIP 24855) in depth, which shows complex substructures. The stellar and disk parameters available in the literature are summarised in Table 1. This system started to receive attention in the early 2000s: Arellano Ferro & Giridhar (2003) first determined that HD 34700 A was a double-lined spectroscopic binary of G0IVe type (Mora et al. 2001). Torres (2004) confirmed the binarity of the system and calculated an orbit with eccentricity e = 0.25 and a period of ~23.5 days for it. They found that the two stars have an almost equal mass and estimated their orbit to be seen at an inclination of ~39°. They also detected youth indicators: a weak Hα emission, a strong Li I absorption, a strong X-ray emission, and high rotational velocities, all supporting the hypothesis of a pre-main sequence system. Sterzik et al. (2005) discovered that HD 34700 is a multiple system of at least four stars: the central binary (A) and two low-mass companions of the M stellar type, projected at distances of 5.23″ (B) and 9.25″ (C). They also found the radial velocities of B and C to be consistent with the A component, and detected in all their spectra youth indicators such as Li I and Hα emission.
More recently, the disk of HD 34700 A was resolved for the first time by Monnier et al. (2019), through polarised H-band observations with the Gemini Planet Imager (GPI; Macintosh et al. 2014), showing its wide ring, a cavity, several spiral arms, and an inner faint arc. They carried out a thorough analysis of the HD 34700 A disk, comparing the data to radiative transfer models, to reproduce the observed ring-like structure. For the ring, they obtained an average radius of 175 au at an inclination of 42° to the line of sight (LoS). They noticed that the ring projected semi-major axis and the peak polarisation axis are misaligned, corresponding to position angles (PAs) of 69° and 86° east of north (EoN), respectively. Moreover, Monnier et al. (2019) provided updated estimates of the system parameters, based on the new accurate parallax value: they confirmed HD 34700 A to be a ~5 Myr-old binary star with a total mass around 4 M⊙ and a transition disk. Uyama et al. (2020) imaged the outer ring of HD 34700 A again with Subaru/CHARIS in JHK bands and focussed on the characterisation of its morphology, spiral arms included, employing angular differential imaging (ADI; Marois et al. 2006) reduction techniques. They found the ring to have a PA of 74.5° and an inclination of 40.9°, by ellipse-fitting, and its centre to be offset from the star of 52.7 mas towards 110.8°. Although no substellar companion was found, they assessed upper limits for any such object of around 5 MJ outside the ring and 12 MJ in the cavity. At longer wavelengths, Benac et al. (2020) presented Submillimeter Array (SMA) observations of HD 34700 A and B. Their observations of the 12CO J = 2–1 transition line detected an anticlockwise Keplerian rotation of A’s disk, while the 1.3 mm continuum resolved a prominent azimuthally asymmetric emission, which they suggest could be evidence for a dust trap. This substructure appears to peak right outside the scattered light ring, around 155 au from the central star, based on their deprojection. They resolved continuum emission around the B component too, caused by its own circumstellar disk. Thanks to the improved parallaxes obtained as part of Gaia Data Release 3 (Gaia Collaboration 2023), the latest estimate places HD 34700 A at a distance of 350.5 pc.
In this work, we present new observations of HD 34700A and analyse its various features, discussing the implications of a new ring within the large cavity, not fully resolved in previous observations of Monnier et al. (2019) and Uyama et al. (2020). Figure 1 illustrates the main features that are analysed and discussed: the inner ring (detected for the first time), the outer ring, and its discontinuity. We describe the new observational data that we have obtained in Sect. 2 and dive into the analysis of the disk components in Sect. 3, highlighting what insight we can gain from the new data. Then, in Sect. 4 we discuss the interpretation of our results, also in comparison to previous studies on this object. Finally, we summarise and conclude in Sect. 5.
Summary of known parameters of HD 34700 A.
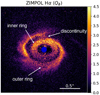 |
Fig. 1 ZIMPOL Qϕ image of HD 34700 A with annotations. The field of view is 2.16″ × 2.16″. The blue circle represents the coronagraph. North is up and east is left. The colour bar is linear and has arbitrary units. |
2 Observations and data reduction
HD 34700 A system has been the target of several observations in recent years. In the following we present all the new observations acquired, and the data reduction process. A short summary of all the observations and the relative setups is reported in Table 2.
2.1 SPHERE observations
HD 34700 A was observed with SPHERE, the Spectro-Polarimetric High-contrast Exoplanet REsearch facility (Beuzit et al. 2019), mounted at the UT3’s Nasmyth focus of ESO Very Large Telescope (VLT), with all its scientific systems: IRDIS (the Infra-Red Dual-beam Imager and Spectrograph, Dohlen et al. 2008; Vigan et al. 2010), IFS (the Integral Field Spectro-graph, Claudi et al. 2008; Mesa et al. 2015) and ZIMPOL (the Zurich Imaging Polarimeter, Schmid et al. 2018). The SPHERE data were acquired within the programme Disk Evolution Study Through Imaging of Nearby Young Stars (DESTINYS; Ginski et al. 2020, 2021), aimed at studying young planet-forming disks in scattered light. To determine the star position behind the coronagraph in the science frames, additional ‘centre frames’ were taken for all instruments, using the satellite spots obtained in the deformable mirror waffle mode.
2.1.1 IRDIS polarised data
SPHERE/IRDIS data were acquired on 27 October 2019 in broadband H (BB_H, λc = 1.625 µm, ∆λ = 0.290 µm, and pixel scale 2.25 mas pix−1, Maire et al. 2016). The observations were carried out in dual beam polarimetric imaging mode (DPI; de Boer et al. 2020; van Holstein et al. 2020), with a coronagraphic mask of radius 92.5 mas (Carbillet et al. 2011; Guerri et al. 2011), centred on the photocentre of the binary star. The observations consisted of 14 polarimetric cycles, each containing four exposures taken at half-wave plate (HWP) switch angles 0°, 45°, 22.5°, and 67.5°. The individual frame exposure time was set to 64 s, resulting in a total integration time of 74 min. The data were reduced with the IRDAP tool2 (van Holstein et al. 2020), which applied polarimetric differential imaging (PDI, Kuhn et al. 2001), producing the images corresponding to the Stokes parameters Q and U, Qϕ and Uϕ, shown all together for completeness in Fig. A.1. The Qϕ image, particularly useful to our goals, is shown alongside the other data in Fig. 2 (third panel). The azimuthal Stokes parameters Qϕ and Uϕ were obtained according to the definitions of de Boer et al. (2020):
 (1)
(1)
where ϕ is the EoN polar angle in the coordinate system centred on the star.
Polarimetry is well suited for the study of circumstellar disks, allowing us to isolate their signal from the excessive stellar brightness. The central stars mostly emit non-polarised light, which can be easily distinguished from the polarised light scattered by the dust in the disk. The observing strategy was pupil tracking (van Holstein et al. 2017), which allows the rotation of the field of view (FoV) in time with respect to the detector. Figure 3 shows the H-band Qϕ r2-scaled image of HD 34700 A, which accounts for the r−2 dependency of the stellar flux, after considering the inclination of the disk.
Observation setup and observing conditions.
2.1.2 IRDIS+IFS data
New data in IRDIFS_EXT mode were acquired on 14 and 26 November 2021. This mode uses simultaneously IRDIS and IFS, to join the advantages of simultaneous imaging and spectroscopy. With our setup IFS covered the wavelength range 0.95-1.65 µm at a spectral resolution of R ~ 30 (FoV 1.77 arcsec2), and IRDIS covered the K1 and K2 bands (dual-band imaging mode, or DBI, see Vigan et al. 2010, FoV of ~10 arcsec2) at 2.09 µm and 2.22 µm, respectively. We used the N_ALC_YJH_S apodised Lyot coronagraph (Boccaletti et al. 2008) with a field mask having a radius of 92.5 mas. The observing strategy for this set of data was star-hopping in pupil-stabilised mode (see e.g. Wahhaj et al. 2021). The total field rotation angle was 16.6° and 42.7° for the two epochs. Star-hopping consists of the acquisition of a template point spread function (PSF) from a chosen nearby reference star, in between the exposure of the scientific target. Subtracting the reference PSF from the science target has two main benefits. Firstly, at small separation one actually gains sensitivity thanks to the lack of signal self-suppression (as there is in ADI). Secondly, ADI distorts disk morphology due to self-subtraction and can sometimes lead to false positive detections (see, e.g. Rameau et al. 2017).
We applied two techniques for the suppression of the stellar speckle field in the IRDIFS_EXT data. The IRDIS K-band imaging data utilised the iterative reference star differential imaging (iRDI) approach briefly outlined in Ginski et al. (2021). In this case the reference star data observed during star hopping is used as the library of PSF standards. To fit the reference star data to the science data we use the KLIP (Soummer et al. 2012) principal component analysis (PCA) code. Since the disk is bright relative to the stellar speckle field, we need to prevent overfitting of the reference star data. This is done iteratively by feeding the positive disk signal above a specified threshold back into the routine and subtracting it from the science data before the reference star images are fitted. For the reduction of HD 34700 data we used a threshold of 100 counts, which includes bright disk signal but excludes remaining speckle noise. In each step we removed 15 KLIP-modes and we ran a total of 100 iterations. We note that this technique is basically identical to the iterative ADI approach presented in Stapper & Ginski (2022), with the exception that a reference star is used for speckle suppression instead of the science data itself.
For the IFS data we use a combination of classical angular and spectral differential imaging (cASDI). The idea of cASDI is to overcome the self-subtraction inherent to classical ADI and SDI individually by combining the spectral and temporal dimensions of the IFS data. We compute the median PSF to subtract from all images simultaneously in the temporal and the spectral dimension. We first re-scale all wavelength channels so that the speckle fields coincide. We then flatten this array across all parallactic angles and compute the median. By including both the parallactic angle rotation as well as the wavelength scaling, we increase the diversity within the data set such that less disk signal remains in the median image used for subtraction compared to classical ADI or SDI. The total intensity K-band iRDI and YJH-bands cASDI images are shown in the fourth and second panel of Fig. 2.
2.1.3 ZIMPOL data
ZIMPOL observations were acquired with excellent sky conditions (see Table 2) on 7–8 December 2021, in the B_Ha (λc = 655.6 nm) and Cnt_Ha (λc = 644.9 nm) Hα filters. ZIM-POL achieves diffraction4imited performance in these bands, on a FoV of 3.5″ × 3.5″. These observations were performed in the slow polarimetry P1 mode of the instrument. In five Polarimetric QU cycles the consecutive measurements of the Stokes parameters Q+, Q−, U+, and U− were conducted with different HWP switch angles of 0°, 45°, 22.5°, and 67.5°, respectively. At the beginning of the science observation the flux measurement was performed with the star offset from the coronagraphic mask, using the neutral density filter ND_1.0 and DIT = 10 s.
The ZIMPOL data were reduced with the ETH data reduction pipeline (described in, e.g. Schmid et al. 2018; Hunziker et al. 2020). Pre-processing and calibration of raw frames included subtraction of bias frames, flat-fielding, and correction for the modulation and demodulation efficiency. The instrumental polarisation was corrected through forced normalisation of the fluxes in the frames of two opposite polarisation states. All frames were centred at the position provided by the centre frames. The final format of the reduced Q and U images is 1024 × 1024 pixels with a pixel size of approximately 3.6 × 3.6 mas on sky. The final Qϕ image of the ZIMPOL Hα data, shown in Fig. 1, is the mean of the independent Qϕ frames from the two ZIMPOL cameras, for the B_Ha filter.
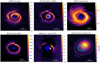 |
Fig. 2 Images of HD 34700 A showing the observational data used in this paper, in order of increasing wavelength. North is up and east is to the left. The FoV shown in all panels is 2.16″ × 2.16″. The blue circles represent the coronagraphs, except for LMIRCam observations in L′ band (without coronagraph), where the blue area masks all the spurious signals within λ/D, and ALMA data. In the ALMA continuum image the red line represents the outer ring, while the blue ellipse the inner ring; the continuum beam size is 0.″41 × 0.″ 28 at a PA of −64°. The dashed contours denote levels of [0.4, 2, 4, 6] mJy/beam. The colour bars have arbitrary units except for ALMA; they all have linear scale, except for IRDIS H-band, which is logarithmic. |
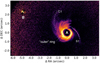 |
Fig. 3 Face-on deprojection of IRDIS H-band Qϕ data, corrected by r2 light dilution, and with special logarithmic colour scale to highlight the faint outer spirals. The two opposite arms at east and west (C1 and S1) stand out from the disk. HD 34700 В component is also visible in the FoV, in the upper-left corner. The inner ring plane (i ~ 40°, see Table 3) was considered for deprojecting to face-on. |
2.2 LBT observations
New data were also acquired with LBT/LMIRCam (the Large Binocular Telescope Mid-InfraRed interferometric Camera, Skrutskie et al. 2010) on 14 February 2022 as part of the programme IT-2021B-AO-3 (P.I. Gratton). The observations log is reported in Table 2. LMIRCam’s field of view of 11.0″ × 11.0″, similar to IRDIS, was wide enough to include both the system’s A and В components in the frames. The observation was performed in pupil stabilised mode, with the L′ band filter (effective wavelength 3.7 µm, Skrutskie et al. 2010), with a final scientific exposure time of 3.22 h (0.81 s each frame), obtaining a final rotation of the FoV of 75.4° that is enough to effectively perform the ADI reduction. The high thermal background was removed from the data by subtracting a median of the two nodding positions adopted in the observing strategy. Then, the disk was detected applying the PCA (see e.g. Soummer et al. 2012) algorithm, using a custom-made code appositely prepared to reduce these data. To this aim, only one principal component was used to create the image to be subtracted from the science images. The final image is shown in the second to last panel of Fig. 2.
2.3 ALMA observations
The ALMA observations were taken in ALMA Band 6 (240 GHz, 1.25 mm) on 21 August 2022 as part of the DESTINYS snapshot programme 2021.1.01705.S (PI C. Ginski). The integration time on source was only 1.5 min in moderate weather conditions with precipitable water vapour levels of 0.35 mm. The baseline lengths ranged from 15 m to 1200 m. The data were calibrated using the Common Astronomy Software Applications package (CASA, McMullin et al. 2007), version 6.2.1, to first remove atmospheric and instrumental effects using the quasar calibrators. We then self-calibrated the data to increase the signal-to-noise ratio.
The correlator was configured with broad wavelength coverage for best continuum sensitivity but included one spectral window centred on the 230.538 GHz lines of 12CO J = 2−1 in the lower sideband. The continuum image was produced using the tclean task on all spectral channels other than the CO window. The image shown in the last panel of Fig. 2 was produced with Briggs robust weighting parameter −0.5 and corrected for primary beam attenuation. The beam size is 0.″41 × 0.″28 at a PA of −64° and the rms is 0.13 mJy beam−1. The 12CO spectral window was imaged channel by channel (0.65 km s−1) with a Briggs robust equal to +0.5 and a resulting beam size 0″.52 × 0″.48 at a PA of −61° with an rms of 4.3 mJy beam−1.
3 Analysis
In the following, we analyse the disk structures seen in the new observations, compare them to the previous ones and highlight the new insights on the system’s morphology. In Fig. 2, we illustrate all the new multi-band data presented in this study. From a comparison of these images, it becomes clear that we can divide the disk around HD 34700 A in two main features: the outer disk, already detected and analysed in recent years, which is very bright in all wavelengths; and an inner disk, whose first detection was possible thanks to the Нα -band polarimetry.
3.1 Rings fit
Outer ring. The scattered light from the outer dust ring is clearly visible in all datasets of Fig. 2, except for the ALMA continuum. Multiple spiral arms structures outside a large cavity, characterised by a strong discontinuity near 0° EoN, were already detected in J- and H-band images, obtained with GPI and SCExAO by Monnier et al. (2019) and Uyama et al. (2020), respectively. IRDIS images (Figs. 3 and A.1) confirm the presence of these structures. Our ALMA data (last panel of Fig. 2) confirmed that the ring discontinuity is near the asymmetric mmdust structure first discovered by Benac et al. (2020). The nearest side of the disk to the observer is expected to be the northern side, based on Monnier et al. (2019) and confirmed by our observations. In this work, we do not provide new estimates for the outer ring PA and inclination, as it was already done by previous works; instead, we attempt different interpretations, based on the new perspectives offered by the inner ring discovery. Nevertheless, we do provide an analysis of its scattering phase function (see Sect. 3.6) and of the spiral structures tied to the outer ring (see Sect. 3.3).
Inner ring. Polarimetric observation from ZIMPOL in the Нα band (Fig. 1), revealed the clear presence of another ring structure located inside the outer ring cavity. This inner ring extends radially from ~65 au to ~120 au (or 186 – 335 mas) from its centre. It appears to have an offset with respect to the nominal position of the central star (more on the offsets in Sect. 3.2). It is intriguing to notice the presence of a faint ‘arc’ inside the outer ring, towards N–E, already detected by Monnier et al. (2019), that we found again in the IRDIS Qϕ image (see Fig. A.1). Based on the new ZIMPOL data, we can link this arc structure to the inner ring as they are found to overlap well and trace the same elliptical shape. Furthermore, the inner ring seems to partially merge with the outer ring structure on the N–W side, especially near the step-like discontinuity around 0°. Depending on the disk 3D geometry, however, this intersection may be more a perspective effect than a physical contact.
We characterised the geometry of the inner ring by assuming a circular dust ring and fitting two separate ellipses to its internal and external boundaries (see Fig. 4). We selected the ring boundaries by subtracting, from a slightly smoothed (14–17.6 mas) version of the original image, a strongly smoothed image (42.2–45.7 mas). The result of this subtraction yields positive values for the pixels of the bright ring core and negative values on the surrounding background. Then, we chose as the boundaries the set of coordinates corresponding to a sign change in this subtraction image. This method proved to be the most suitable for this system, since the brightness fluctuates over scales of many pixels, creating fuzzy boundaries. Also, we excluded from the fit the north-west quadrant points, as the two rings overlap significantly there. The selected boundary points were successively fed to the ‘least-squares ellipse fitting’ algorithm developed by Hammel & Sullivan-Molina (2020)3 in Python. The whole procedure was repeated by varying the angle of the inner ring mask and the smoothing parameters. Finally, we computed the best-fit values as the mean of the two independent boundaries, taking the median for each parameter and having the standard deviations as the uncertainty. These single-ellipse parameters are the ones employed in our subsequent deprojections. We have summarised the resulting parameters and errors in Table 3. We obtained an inner ring with a semi-major axis PA of 87(1)° from the north direction, seen at an inclination of ~40(2)°. The PA value differs by 15–20° from the outer ring values obtained by Monnier et al. (2019) and Uyama et al. (2020). However, Monnier et al. (2019) already noticed that the peak polarisation axis of the outer structure was found at 86°, which is very close to the value we have obtained from the inner ring. The LoS inclination we found is also compatible with previous estimates.
The two rings appear different. The external one has spiral arms of various shapes and sizes, and it shows a sharp discontinuity. On the contrary, the internal ring has a sharper boundary and appears as a highly regular elliptical annulus. The differences between these two rings, however, are not limited to their shape: while the inner ring is prominent in the Hα band, it is almost undetected in the H-band. There is only a faint arc in the N−E direction that can be seen in the IRDIS H-band Qϕ (bottom left panel of Fig. A.1), overlapping with the inner ring edge. This faint feature was already detected by Monnier et al. (2019), who noticed that the cavity inside the outer ring was not completely devoid of dust scattering light.
The fact that the inner ring was fully revealed at shorter wavelengths implies an underlying segregation between the dust grain sizes, highlighting a deeper physical distinction. We discuss the possible formation mechanisms of such structures in Sect. 4.2.
 |
Fig. 4 Overlay of the ellipse axes (orange) and the inner ring (white) as fitted in this work. The yellow cross marks the position of the central binary star. For reference we included the ellipse axes obtained by Uyama et al. (2020) based on the outer ring alone (dotted green). The underlying image is a two-band Qϕ composite of the IRDIS H-band (green layer) and the ZIMPOL Нα (blue layer). |
Geometrical parameters of HD 34700 A inner ring.
3.2 Geometrical offsets
In the following, we analyse the geometrical offsets observed for the centres of the inner and the outer ring.
3.2.1 Inner ring offset
HD 34700 A shows offsets of the inner and outer rings centres with respect to the central star. The centre of the elliptical annulus traced by the inner ring, as described in Sect. 3.1, shows a shift from the star of around 3 au towards the west and 2 au towards the north. Precisely, we find this geometrical centre to be found at a PA of −52(15)° and distance of 9.8(57) mas (3.4(20) au) from HD 34700 A nominal position, as reported also in Table 3. The uncertainties provided originate from the 1σ errors on the inner ring geometrical fit, plus the half-pixel starcentring error, causing a relatively large but realistic uncertainty. The direction of these offsets was rather unexpected. Offsets are common for flaring disks along the minor axis, due to the disk height and image projection (see, e.g. Ginski et al. 2016; de Boer et al. 2016). The offsets we retrieved for the inner ring are opposite of what would be expected based on that: surface flaring should have shifted the centre towards the south, whereas we find a vertical shift towards the north. There is also a significant component along the major axis direction. These features suggest that other mechanisms could be responsible for the observed offsets: the inner ring is likely to be rather flat and eccentric. We notice in this context that the PA of the inner ring centre has a value very close to the PA of the supposed mm-dust trap. From the ALMA continuum, in fact, we find a PAmm ~ (−4811)° measuring the angle of the 95% peak intensity seen from the central star. This PAmm is only ~4° away from the inner ring centre PA (−52°). We speculate on a correlation between these two angles, but a reliable answer would require detailed theoretical simulations beyond the scope of this work.
3.2.2 Outer ring offset
For the outer ring, assuming that the observed structure is a projection from a circular ring, Uyama et al. (2020) reported a shift of the outer ellipse centre of around −17.3 au in the west direction and −6.6 au in the north direction from the central star. This is exactly opposite to what we find from the inner ring (but in the direction which can be justified by height projection). We did not fit the outer ring as a regular ellipse, thus we do not provide updated estimates on its offsets and parameters. Given the compatible position angles and inclinations between inner and outer ring, the different parts of the outer ring may not be equidistant from the central star (see the spiral fit in Sect. 3.3). Also, because of possible azimuthal and radial variations in scale height, the light scattered by the outer dust may not belong to a unique geometrical plane. Thus, the circular approximation might not be particularly suited for the outer ring.
3.2.3 Unseen stellar companions
Having ruled out the inner disk flaring as a plausible cause of the observed offsets, we investigated both the potential presence of an additional stellar companion and a non-null eccentricity of the inner ring. We have searched for other stellar companions in the vicinity of the central binary, massive enough to bring the barycentre away from the photocentre. We used the calibration frames saved during the observing runs to reveal potential close point-source companions hidden behind the coronagraph. We processed the ‘no-coro’ calibration frames from IFS, performing a simple ADI-like reduction by subtracting the median PSF of the central binary and adding the de-rotated frames, as in Bonavita et al. (2022). The maximum field rotation (42.7°, see also Sect. 2.1.2), obtained for the 26-11-2021 calibration frames, allows the detection of potential companions beyond 1rad/42.7° × λ/D = 42 mas to be free from self-subtraction. The post-processed IFS data provides a J magnitude contrast of ~7 mag at 50 mas, which corresponds to a limit in mass of 50 MJ, using the BHAC15 models (Baraffe et al. 2015). The full contrast limits plot and the processed signal-to-noise (S/N) map are shown in Figs. A.2 and A.3 respectively. We do not detect any reliable point-source in the processed image, hence, we can definitely exclude the presence of unseen stellar companions. Indeed, everything more massive than 30–50 MJ behind the coronagraph would have been detected with this reduction.
We can reinforce and expand this argument with other considerations. Firstly, the SED of HD 34700 A shows an infrared excess, which must be caused by an innermost circumbinary dust ring, not visible due to its proximity to the central star and heated up to high temperatures. Seok & Li (2015) fit results suggested a disk starting around 0.3 au with a T~1500 K (they had an imprecise system parallax, however). Thus, any stellar companion close to the central binary would irremediably perturb the inner disk edge, causing issues to the infrared excess. Secondly, if a stellar companion were further out of the central binary, we would have detected it easily, being outside of the coronagraph. There are also astrometric arguments against this stellar companion. The Gaia RUWE4 parameter for HD 34700 A of 1.04 is fully consistent with a single object (and the central binary is tight enough to have no effect on the RUWE parameter). Moreover, the proper motion anomaly (PMa) measured by Kervella et al. (2022) is low and compatible with substellar masses, thus not significant for a star. In fact, this excludes the presence of a stellar companion with a mass above 0.2 M⊙ in the separation range 3 au to 30 au, the latter being approximately the size of the coronagraph used in our SPHERE observations. All these points suggest that there is no third stellar companion in the range 2 au to 30 au that could have shifted the barycentre of this system.
3.2.4 Ring eccentricity
Lastly, we assume the inner ring is eccentric and estimate its eccentricity from its offset. The binary star would be the centre of mass of the ring, positioned in one of the two foci, which means that the offset between the ellipse centre and the star is a function of the eccentricity and can be used backwards to infer e. To estimate the eccentricity, we approximated the semi-major axis as the same obtained from the geometrical fit described above. For the centre of the ellipse we considered the displacements in both directions, after deprojecting to the inner ring plane. We find for the focal distance c = 3.2 ± 1.0 pix and for the semi-major axis a = 74.0(6) pix, corresponding to a modest ring eccentricity of e = c/a = 0.043 ± 0.014. Taking into account this eccentricity in the projection effects along the LoS, it would result in a smaller inclination angle i than for the circular scenario. The difference, however, is below one degree less than what found in Table 3 and within the error bars.
Hydrodynamical simulations of protoplanetary disks demonstrate that objects heavier than ~3 MJ lead to significantly eccentric cavities in the dust (see, e.g. Kley & Dirksen 2006; Pinilla et al. 2012; Zhang et al. 2018). Specifically, Kley & Dirksen (2006) provide disk eccentricity values as a function of radius, for different companion masses (or, better, mass ratios). They report a peak eccentricity of ~0.05 for q = 0.001 (4 MJ in HD 34700 A) for orbits both inside and outside the planet. Heaviercompanions excite much highereccentricities in the disk outside their orbit (up to 0.22), but again around ≳0.05 for inner orbits. Comparing these theoretical results with our eccentricity estimate, we find a good agreement. A ~4 MJ companion may be present either inside or outside HD 34700 A inner disk. Heavier planets are unlikely to reside inside the inner ring cavity, as they would excite much higher eccentricities; they could be present anyway in the gap between the inner and the outer rings. In addition, Zhang et al. (2018) show that disk eccentricity is enhanced by low viscosity and small aspect ratios. We know that the aspect ratio of HD 34700 A cannot be too high, since the offsets along the projected minor axis are limited. A low-viscosity coefficient, moreover, appears to be preferred among protoplanetary disks, as reported by the DSHARP Collaboration (Dullemond et al. 2018), but also Pinte et al. (2023), Rosotti (2023).
In conclusion, the presence of a giant planet of several Jupiter masses, which cannot be ruled out by our observations, would naturally explain the offset issue by the excitation of disk eccentricity. Further discussion on a potential substellar object and its impact on dust segregation is reported in Sect. 4.2.
3.3 Spiral arms fit
The outer spiral arms of HD 34700 A have some of the highest pitch angles and radial extents analysed to date (see e.g. Figs. 4e,f of Bae et al. 2023). To compare the geometrical properties of the spiral structures, we have produced an extended polar-coordinates visualisation of the disk, shown in Fig. 5 and we performed spiral fits to compute the pitch angles. To obtain the (r, ϕ) polar visualisation, we deprojected the IRDIS Qϕ based on the inner ring geometry parameters (see Table 3), using the scikit-image module in a custom-made Python code. We did not assume any disk flaring, to avoid imposing a height profile for these outer regions of the disk, where the spiral arms are found, and to be consistent with the scenario outlined in Sect. 3.6.
For the analytical spiral fit we opted to focus on the arms that we were able to distinguish from the rest of the disk. The wealth of substructures in the 0° < ϕ < 180° region, in fact, although interesting, mixes up together in a way that would make any spiral fit partly arbitrary. Qualitatively, however, they appear to have a steep and almost constant slope, as illustrated in Fig. 5. Closely inspecting the deprojected image, we noticed that the bright ridge of the outer ring shows a varying radial distance along the azimuthal dimension, culminating with the discontinuity at ~0°, where there is a sharp jump. In this context, it seemed interesting to calculate the pitch angle of the outer ring, assuming that it was a spiral arm itself as a whole. Then, we decided to fit analytically only the following large-scale features: the outer ring (labelled ‘outring’ for short) and the two long arms extending furthest away from the disk. We retained the name ‘S1’5 for the arm already labelled by Uyama et al. (2020), and we called the other arm ‘C1’ (for Columba) not to overlap with the previous authors’ labels. We sampled the two outer arms picking by hand the coordinates of the brightest parts from Fig. 5. For the outer ring we selected its bright ridge using intensity contours and limiting the azimuthal angles range between 10° < ϕ < 350°, to leave a small margin around the discontinuity at ~0°. Then, we used the scipy.curve_fit algorithm to fit the collected data points and find the best spiral parameters. We performed the regression with two commonly used types of spiral:
 (2)
(2)
where (ϕ, r) are the polar coordinates on the disk plane. We fit the logarithmic shape for the two outer arms and the archimedean for the outer ring, based on their qualitative appearance. Indeed, a logarithmic growth implies a steepening curve in polar coordinates, similarly to the S1 arm; that Archimedean spiral, instead, has a constant slope in polar coordinates, more similar to the ridge of the outer ring. Real spiral wakes can take much more complex shapes, however, it is still informative to use these simple shapes to obtain quantitative insights on the disk morphology.
We report the pitch angles obtained for our spirals in Table 4, along with the standard deviation errors. Since the pitch angle of an archimedean spiral is not constant (as is the case for the logarithmic spiral), we chose to report in the table the pitch angle value computed at the smallest radial distance reached by the outer ring (~ 20 au). To inspect in greater detail the outer ring pitch angle behaviour, we repeated the analysis with a piecewise fit of Archimedean arms. We computed the arm fit parameter on a window of ∆ϕ = 50°, running along the outer ring at steps of 5°, to see how its pitch angle evolved with the azimuthal angle. This piecewise computation returns for the outer ring pitch angles within the range between ~1° and 3°, with the highest values near ϕ ~ 270°. This could be informative of possible perturbations along a spiral arm. Under appropriate circumstances, and with sufficient resolution, a wake-launching planet can be located where the pitch angle has a cusp, peaking theoretically near 90° values (Zhu et al. 2015). No similar feature could be retrieved from our data analysis.
We remark the similarities between C1 and S1, starting from the large pitch angles ≳ 30°, compatible within uncertainties. The two arms are visualised and plotted on the disk plane in Fig. 3, for context. They are found on opposite sides of the disk, close to being 80° apart. They are both structures with the largest radial extensions and similar logarithmic shape. S1 is detected up to ~600 au, while C1 extends to the impressive ~ 1000 au from the central stars. The fit of arm C1 has large uncertainties, due to its intrinsic thickness and faintness; also, the presence of the other substructures closer to the outer ring does not allow forits shape to be constrained at shorterradii. We recall that the existence of these two arms on a single orbital plane is not guaranteed. However, based on our deprojection and the similarities between these spirals, it seems reasonable to assume a connection between them. We discuss in further detail the implications of the spiral shapes and pitch angles in Sects. 4.3 and 4.4.
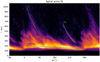 |
Fig. 5 Polar-coordinate visualisation of the disk of HD 34700 A, from IRDIS Qϕ frame, multiplied for a r2 correction factor for the flux dilution and lightly smoothed. Note: the disk is duplicated horizontally to avoid cuts at the image boundaries (notice the x axis). The colour scale is logarithmic to highlight the faint spiral arms. In dashes, the fitted logarithmic (lime green) and archimedean (blue) spiral arms. The cyan circle around 310° represents the approximate centre of the mm-dust emission. |
3.4 Millimetre-dust asymmetry
HD 34700 A was observed in the mm wavelengths with ALMA (Figs. 2 and A.7). The continuum thermal emission, tracing larger millimetre-dust, appears to be significantly displaced from the centre of the system, where they have been depleted. Similar results were obtained by Benac et al. (2020) using the SMA (Ho et al. 2004). They argue this could be the manifestation of a dust trap with an asymmetric, crescent-like morphology, where most of the remaining mm grains accumulate. Such asymmetric traps are often (but not exclusively) associated with vortices in the disk (e.g. Birnstiel et al. 2013; Lyra & Lin 2013).
We traced the contours of the millimetre emission in the last panel of Fig. 2 and compared it to the disk structures observed in scattered light. The outer parts of the outer ring in the northwest quadrant, the closest to the mm-asymmetry, appear fainter and sparser, perhaps because of a locally lower scale height of the disk (see panels 3 and 6 of Fig. 2 and Fig. 5). Moreover, the mm-dust emission peak is near the point where the outer ring seems to intersect the inner ring, hinting at a perturbed area. It is not centred on the ~0° discontinuity. The inner ring, instead, does not appear to be significantly warped in the proximity of the mm emission, but the ring’s centre PA is interestingly close to the mm emission PA (see Sect. 3.2). The simultaneous presence in the disk of HD 34700 A of an asymmetric dust structure, in the ALMA continuum, and of spiral arms, seen in visible-IR scattered light, points to a potential connection between these features (see, e.g. Cazzoletti et al. 2018; van der Marel et al. 2021). We measured the mm-continuum integrated fluxes for HD 34700 A and B to be of 9.1 mJy and 4.0 mJy respectively, with a rms uncertainty of 0.13 mJy. The continuum emission around the B component is centred on the star and elliptical, contrary to component A (see Fig. A.7).
3.5 Gas velocity
We determined the velocity of emission peak for the 2CO line from the ALMA band 6 spectral datacube, using the bettermoments package (Teague & Foreman-Mackey 2018) to study the gas kinematics. We detect gas rotation patterns for HD 34700 A and B, whereas we did not detect the C component in either the gas or mm continuum. No gas streamers connecting the A and B components are detected in our data.
The velocity map for the A component, shown in Fig. 6, displays a rotating gas that extends to the innermost regions of the disk, inside both the outer and inner ring. The rotation is anticlockwise on the sky plane, in agreement with the winding of the spiral arms. The source is well centred in between the two lobes of the rotation pattern, confirming the host star as the barycentre of the system. There is no significant velocity perturbation at the location of the mm-dust peak, near the break in the scattered light outer ring, at least at the moderate resolution of these data. Figure 6 data are masked at 5σ to avoid including noisy background signal. We estimate for the gas disk a position angle of PAgas = 93(2)°, from a straight line fit of the peak velocity coordinates with scipy.curve_fit.
The companion HD 34700 B was also detected in the ALMA velocity map. The smaller angular size of B, with an equal beam size, implies a worse gas velocity resolution than for A. Nonetheless, we detect a velocity gradient typical of rotating gas in the 12CO line (Fig. A.6). The gas and dust emissions are both centred on the source, for B.
Interestingly, the disk around B rotates clockwise, opposite to the disk around A, and with a very different semi-major axis PA. This misalignment between the two components of HD 34700 suggests that A and B did not originate from the same coherently rotating gas disk. Instead, they may have collapsed in different parts of a turbulent fragmented cloud (see e.g. Williams et al. 2014; yi Luo et al. 2022).
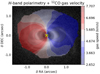 |
Fig. 6 ALMA data velocity contours for HD 34700 A, obtained from the 12CO molecular lines. For reference, we put as background the IRDIS H–band Qϕ and marked the source position with a yellow cross. The gas shows a well defined rotation pattern, extending to the innermost regions of the disk. The beam is 0.52″ × 0.48″ at a PA of −61°. The gas speed values refer to the Local Standard of Rest. |
3.6 Scattering phase functions
3.6.1 Models
To better characterise the nature of HD34700A’s rings, we extracted their azimuthal brightness profiles and fitted a theoretical scattering phase function. In particular, following a standard approach (e.g. Engler et al. 2017) we adopted the Henyey-Greenstein phase function (Henyey & Greenstein 1941):
 (3)
(3)
which depends on the scattering angle θ and the asymmetry parameter g. The latter can take any value in the interval [−1, 1] and parameterises the balance of scattered power between forward (g > 0) and backward scattering (g < 0). In case of polarised observations (as Qϕ data) we accounted for the linear polarisation (LP) of light multiplying Eq. (3) by the single scattering Rayleigh factor:

A critical uncertainty for the fitting procedure was due to the unconstrained 3D structure of the disk itself, since to provide a scattering angle θ for each point of a ring requires assuming a particular geometry, in terms of inclination, PA, and flaring. In fact, considering an axially symmetric ring around the central star, observed at an inclination i and with a locally constant flaring angle γ, we can infer the scattering angles following the formulation of Quanz et al. (2011) and Stoiker et al. (2016):
 (4)
(4)
with ϕ being the azimuthal coordinate on the disk plane, starting from zero at the closest point to the observer. We knew from the literature (Monnier et al. 2019; Uyama et al. 2020; Benac et al. 2020) that the closest side of HD 34700 A’s disk was in the northern half, so we imposed as zero-point the angle of the semi-minor axis anticlockwise from the north. Then, for a guess of {i, γ, PA} as disk geometry, we can map each azimuthal angle of the deprojected ring – and the corresponding median brightness I(ϕ) – to a scattering angle, θ(ϕ) and thus obtain I(θ), in the approximation of single scattering of photons from the star. In other words, I(θ) is a measure of the dust brightness seen from the accessible scattering angles. The flaring angle influences also the inferred brightness, when correcting for the dilution of radiation flux (i.e. multiplying for a r2 mask from the source position).
3.6.2 Procedure
Based on the previous remarks, the less biased procedure we could use to fit the scattering phase function, was to extract a reasonable {i, γ, PA}k deprojection triplet, via random-sampling, and then run a MCMC regression on the theoretical phase function, to find the best g parameter. The first step fixed the mapping to the median I(θ), while the second step found the model parameters minimising the residual to the given data. The best final solution was eventually chosen based on a maximum likelihood estimator, evaluating the overall goodness of fit resulting from the given deprojection geometry and the fitted model parameters.
The deprojections were performed with the same method as for the spiral fitting analysis (see Sect. 3.3). The polar representations of the rings are shown in the bottom panels of Figs. 7 and 8. The top panels show the normalised brightness of each ring plotted as a function of the disk-plane angles from the north (Φ) in azimuthal slices of 1°. The normalised brightness is measured as the median along the radial dimension. In detail, the inner ring brightness was computed considering intensity contours (on the smoothed data) to find the middle radial distance and taking the median within 30 au of thickness around each core point. The outer ring profile, instead, was computed taking the radial median of every pixel within intensity contours chosen to encompass the entire structure, due to its lower regularity; the radial distance was determined based on the maxima for each angle.
The deprojection parameters were sampled from normal distributions centred on the best fit values from the inner ring geometrical fit (see Table 3). Once the image had been deprojected, fixing the I(θ), a MCMC computation was launched to find the best model parameters for that brightness profile: {g, A, σj}k, respectively the asymmetry parameter, an amplitude proportionality factor, and a jitter term to accommodate the spread of our data points. We used the emcee module (Foreman-Mackey et al. 2013) to perform our MCMC runs, adopting flat priors on the g, A, σj parameters and a standard loglikelihood for a Gaussian distribution of the residues. After a few attempts, we noticed that the flaring angle parameter was giving nonphysical results, warping the rings artificially and pumping the forward scattering part by means of the r2 correction. Moreover, estimating the expected flaring based on the offset along the projected semi-minor axis of the disk, we obtained almost negligible angles, in contrast to the MCMC-preferred values (>I5°). This suggested that the scattered light we see does not come from a regular, optically thick surface but could originate from dust at different heights in a thin disk. Motivated by this, we neglected the flaring angle for both rings and launched our MC extractions of {i, γ, PA}k always imposing γ = 0.
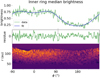 |
Fig. 7 Analysis of the polarised scattering brightness of the inner ring. Top: median radial brightness of the ring (green), as a function of the azimuth angle on the disk plane (0° is north), normalised to the maximum. Middle: residues of the data to the best-fit function, with grey arrows pointing towards the candidate shadow features. Bottom: ZIMPOL Qϕ data transformed to polar-coordinates and corrected for the r2 flux dilution, from which the median brightness of the top panel was extracted. The best-fit asymmetry parameter was g = 0.41 ± 0.01. |
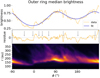 |
Fig. 8 Analysis of the polarised scattering brightness of the outer ring. Top: median radial brightness of the ring (yellow), as a function of the azimuth angle on the disk plane (0° is north), normalised to the maximum. Middle: residues of the data to the best-fit function, with grey arrows pointing towards the candidate shadow features. Bottom: IRDIS Qφ data transformed to polar-coordinates and corrected for the r2 flux dilution, from which the median brightness of the top panel was extracted. The best-fit asymmetry parameter was g = −0.16 ± 0.01. |
Best-fit scattering asymmetry parameter g and relative deprojection angles, obtained from the MCMC regression.
3.6.3 Results
The procedure described above was applied on three independent datasets: the total-intensity iRDI reduction of the IRDIS K-band observation, the IRDIS H-band Qϕ (bottom left panel of Fig. A.1) and the ZIMPOL Hα Qϕ (Fig. 1) data. The latter, in particular, was masked in two variants, to isolate the inner and outer ring from one another. All of these images allowed an estimate of the outer ring parameters, while only the ZIMPOL Qϕ could be exploited for the inner ring. We randomly extracted 100 deprojection triplets for each dataset, to sample the i, PA parameter space, and run the MCMC regression on each one. From these runs we selected the best solution as the one yielding the highest likelihood estimator, which assessed the overall quality of the fit. The uncertainties were computed as the 1σ spread of values on the best fit solution, for g. We remark here that the main goal of our phase fitting was to provide an estimate of the asymmetry parameter g and assess the differences between the two rings. A summary of all best-fit results is reported in Table 5.
The resulting brightness profiles show very different scattering properties between the inner and outer ring. The inner ring, illustrated in Fig. 7, is characterised by a broad forward scattering peak (north is close to the nearest point to the observer) and a weaker back-scattering valley, which translates to a positive asymmetry parameter of gin = 0.4 ± 0.01.
The outer ring was analysed in three bands, Hα, H and K. Detailed values for the three bands are reported in Table 5. The resulting asymmetry parameter values were consistently much smaller for the outer ring than for the inner ring, oscillating around g ~ 0. This reflects an apparently isotropic scattering of this dust, but it is likely to be an observational effect, as we argue in Sect. 4. As shown in the polarimetric observation of Fig. 8 there are two brightness peaks, around ±90° away from the closest disk point, and two valleys in between. Additional figures illustrating the phase fits on the outer ring for the total intensity data and the Hα data can be found, in Figs. A.4 and A.5 respectively. It is particularly striking how, focussing on the north direction (0° of both rings), the inner ring is close to its maximum brightness, whereas the outer one is in the middle of a valley. This is the cause of a major tension in the value of the asymmetry parameter between the two rings, which we discuss in depth in Sect. 4.1.
3.7 Shadowing effects
In this section we analyse the polar-coordinates images of the inner and outer disk, looking for effects of shadowing. Similar effects on the outer ring were already detected by Monnier et al. (2019) and Uyama et al. (2020).
Inner ring. the brightness profile of the inner ring is rather noisy, showing strong fluctuations over angles of few degrees. In this condition, a thin shadow might be buried under this noise or a random fluctuation could be mislabelled as a shadow. When visually inspecting the bottom panel of Fig. 7 it is not obvious to identify evidence of shadowing. In the middle panel, where the residuals are reported, we identified only one main dip around 101°, marked by the vertical grey arrow.
Outer ring. the outer ring data is less noisy than the inner ring, as fluctuations from one angle to the next are smaller. However, considering its wealth of substructures, it is not trivial to assess the nature of the brightness dips, as real shadows or shapes on the illuminated dust surface. Referring to Fig. 8 and starting from the most visually-prominent features, we identified a clear dip near 182°, one at 121°, and one near the discontinuity, starting around −3°. Smaller dips can be found at 64°, 20°, 35° and 254°. Then, inspecting also the total intensity data of Fig. A.4, we report another dip at −34°. The brightness profile of the outer ring has so many features that the best fit line itself is heavily influenced by the dips and thus it does not offer an ideal unbiased reference to assess the supposed shadows analytically.
The alignment of two important dips in the outer ring along the north-south axis, the one at −3° near the discontinuity and the shadow at 182°, constitutes an element of interest. Shadowing effects are not rare in protoplanetary disks, and there are several examples of symmetrical shadows at opposite sides of a disk, cast by inner misaligned rings (e.g. Benisty et al. 2023 for a review). In this case, the shadows have converging angles, as the ones of HD 100453 (Benisty et al. 2017), GG Tau A (Keppler et al. 2020), or other disks in Fig. 1 of Benisty et al. (2023). Instead, in HD 34700 A we observe a discontinuity which, if anything, is rather parallel to the shadow at 183° and, maybe not coincidentally, is also parallel to most spiral substructures. Neglecting for a moment the shadow angles, we can wonder which disk structure is projecting its shadow onto the outer ring. The inner ring resolved by ZIMPOL, based on our analysis, appears sufficiently aligned with the outer ring that it would be difficult to create a thin shadow such as the one at 182°. Most importantly, this shadow is near the disk minor axis, whereas from geometrical considerations it should be projected along the major axis (except for extreme disk warps, not supported by our data). Another hypothesis could be an unresolved and misaligned ring close to the central binary, launching its shadow on both the inner and the outer rings. However, we report no detection of a ~182° shadow in the ZIMPOL’s inner ring (Fig. 7) and in general no correlation with any other brightness dip found on the outer ring. As a consequence, we suggest that the dip at 182° may be linked to the shapes of the disk and spiral arms, instead of being a projected shadow. It could be similar to the dip at 121°, with the main difference that the first one is better resolved, thanks to a lucky geometrical alignment.
3.8 Mass constraints on potential detectable companions
The new SPHERE/IFS and LBT/LMIRCam images allowed us to put constraints on the mass limit of a possible candidate companion. We calculate these limits using the method described in Mesa et al. (2015) and show them in Fig. 9. The luminosity contrasts are converted into mass detection limits based on the ‘AMES-COND’ theoretical models for the atmospheres of non-irradiated young gaseous planets/brown dwarfs with no dust opacity (Allard et al. 2001), and assuming a system age of 5 Myr.
The presence of the bright outer ring worsens the detectability of substellar objects in its proximity (light red shaded area in Fig. 9), whereas the inner ring has a negligible impact at the observed wavelengths. The L’ band LMIRCam data improve the IFS detection limit in the outer ring region, pushing it down to 10–15 MJ, and for small separations (<60 au), where only massive BDs are detectable anyway. From IFS, we have a small window around 100 au from the star, where we should be able to spot giant candidate companions of 10 MJ and then outward 200 au again. Further than 280 au we should be able to detect gas giants of the order of 5 MJ, but we did not find any. The mass limits we obtain are compatible with those of Uyama et al. (2020) for the JHK bands.
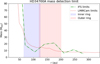 |
Fig. 9 Limits on the mass of a planetary companion in the disk of HD 34700 A, based on the reduced observations from IFS (green line), LMIRCam (red dotted line) and the AMES-COND models for a young gas giant 5 Myr old. Shaded areas represent the rough radial extension of the inner ring (blue) and the outer ring (red). |
4 Discussion
HD 34700 A circumbinary disk mainly consists of two very different ring-like substructures, whose morphology we have analysed in detail in Sect. 3. The inner ring centre is offset with respect to the star, which suggests that it could have a nonnull eccentricity. The outer ring-like dust structure is tied to wide spiral arms with similar logarithmic shape. The two ring structures do not show equal scattering brightness in all passbands: the inner dust appears qualitatively bluer than the outer one, as it is not detected in the longer-wavelength near-infrared data. In addition, their scattering phase functions are fit to significantly different effective asymmetry parameters. Almost all mm-continuum emission in HD 34700 A is asymmetric and centred away from the host star. We detect CO gas rotation in components A and B, but no gas streamer in between, as reported in Sect. 3.5.
In the following, we discuss plausible physical causes of this diversity in the disk of HD 34700 A. Based on our results and on previous literature, we attempt to match the various pieces together, to create a globally coherent model of this system and assess its limits.
4.1 Scattering asymmetry parameter tension
The scattering phase functions of the inner and outer ring around HD 34700 A reveal evidence of the diversity in the dust populations of the two rings. Their asymmetry parameters g, defined and calculated in Sect. 3.6, are radically different. On the one hand, the g ≈ 0 value fit for the outer ring would suggest that its dust is scattering isotropically. This generally happens in the Rayleigh regime, when the grains are much smaller than the wavelength. On the other hand, the inner ring fit returned g ~ 0.4, which would reflect more forward scattering, typical of grains with size comparable to the scattered wavelength. However, the scattering cross section of dust aggregates drops rapidly for wavelengths longer than their size (see e.g. Tazaki & Tanaka 2018; Min et al. 2016). This implies that, for a given filter wavelength λ, we expect to see particles of size a ≳ λ, where a is the characteristic radius. The outer ring is perfectly detected up to the K2 band. Assuming that the detection limits for ZIMPOL in Hα are not better than for IFS and IRDIS bands, the inner ring is properly detected only in Hα, suggesting a qualitatively smaller grain size. Then, our results appear in contradiction: the outer ring should not display isotropic scattering and at the same time consist of particles larger than those in the inner ring. This tension can be solved taking into account the difference between the theoretical scattering pattern and the one actually measured from observations.
Min et al. (2016) derived the optical properties of dust aggregates with detailed numerical computations using the discrete dipole approximation, providing values of the asymmetry parameter as a function of wavelength and for various grain sizes. They find that the ‘effective’ asymmetry parameter, which is obtained by fitting observations of a limited range of scattering angles, can have values very different from the ‘formal’ asymmetry parameter, resulting from the complete theoretical computation of the aggregate properties. Comparing their Fig. 5 (Min et al. 2016) with our results, we find that for the Hα band (λ ~ 0.65 µm) and for particles with size a = 0.4 µm (rV in their paper), their effective g parameter is very close to our fit value. To find an effective g ~ 0 value in their results, the particle size increases to a = 4 µm. And for these particles, the effective g is close to zero for wavelengths going from Hα to K2, which is perfectly in line with our results for the outer ring, across the different datasets we analysed. Interestingly, for 4 µm grains the corresponding formal asymmetry parameter is around 0.8: the scattering is not at all isotropic, it is strongly forward scattering. The effective parameter is much lower exactly because a great amount of light is scattered to small angles that are not accessible by our observation (same as Min et al. 2016 for a disk inclined of ~40°). The difference between effective and formal asymmetry parameter should be taken into account when fitting from observations. Min et al. (2016) conclude that the g parameter is almost only influenced by the size of the aggregate as a whole, making it a good size indicator. This allows us to reconcile the results of the phase function fitting with the qualitative expectations based on the ring detection wavelengths. Thus, we assume that the outer ring is mainly composed of grains with aout ≳ 4 µm, while the inner ring consists of grains with ain ≲ 0.4 µm.
A possible caveat to the inner ring g value is that an azimuthally uniform dust distribution was assumed. A similar brightness variation could in theory be reproduced by a non-axisymmetric dust ring: the brighter north side could have a higher particles density, which can be misinterpreted with a stronger forward scattering component. Finally, we remark again that the ultimate goal of the phase function fitting was not to constrain the parameter g itself, but to find a proxy for the grain size differences between inner and outer ring. Constraining the real value of the asymmetry parameter g is a tricky task, based on single-angle observations, and depends on the adopted scattering phase function, together with the assumptions on grain size distribution.
4.2 A challenging dust segregation
The grain size difference, inferred from the scattering phase functions and discussed in Sect. 4.1, requires a physical mechanism responsible for the observed segregation. Dust segregation might be caused by a giant planet creating a pressure bump outside its orbit and the gap between the two rings. A pressure bump acts as a filter for larger grains, preventing their inward migration, while allowing smaller dust particles to filter through and populate the inner regions (Rice et al. 2006; Zhu et al. 2012; Pinilla et al. 2012, 2016). However, this filtering is more efficient for particles close to millimetre size and above, since smaller dust has a stronger diffusion and is more coupled to the gas component. The depth of the gap increases with the mass of the planet, filtering out progressively smaller dust grains (Zhu et al. 2012). The dust size deduced from our observations of HD 34700 A is approximately two orders of magnitude smaller than the thresholds of Zhu et al. (2012) for effective filtering, as a general reference. Due to turbulent diffusion, in fact, they found that even a 6 MJ planet can only segregate dust bigger than 100 µm.
The presence of more massive planets between the system’s rings would be discouraged by the contrast estimates of both this work (Sect. 3.8) and Uyama et al. (2020), but cannot be excluded. The limiting contrast, as a matter of fact, provides the minimum planetary mass that can be seen in front of the local background (actually averaged on circular annuli). If, for any reason, a compact object is embedded into a dust structure, the contrast limits may be misleading, as the emitted radiation is extincted within the dust cloud, with sufficient optical depth. In this regard, then we must admit the difficulty of ruling out the presence of planets with masses ≳6 MJ in a complex system as HD 34700 A. For example, the mm-dust structure seen from the mm-data might be hiding a compact object, whose light could be completely absorbed by the dust around it. This object would be more massive than our limiting contrasts foresee. Having said that, the possibility that the mm-dust substructure consists of a vortex with no compact object inside is also valid (e.g. Zhu & Stone 2014). Longer-wavelength observations, using, for example, the JWST Mid-Infrared Instrument (MIRI), might help reduce the extinction from the dust around a hypothetical compact object and better constraining its mass. Anyway, in terms of dust segregation, consistently with the studies of Zhu et al. (2012) and Pinilla et al. (2012), the observed mm-dust structure retains much larger grains than those revealed by IRDIS images in the outer ring. The latter, in fact, does not seem dramatically altered by the trap, although its external parts might be hidden due to a locally lower scale height.
Lastly, if dust filtration is not effective for micrometre-sized grains, the difference in composition between the two rings could be regulated by growth/fragmentation and radial drift dynamics at the two sides of the gap. In particular, starting from an ideally homogeneous grain size distribution in both rings, we can argue that the presence of the gap, although it does not prevent the filtration of µm-dust from outer to inner ring, enhances the efficiency of grain growth near the pressure bump (Pinilla et al. 2012). This would result in an increased size of the dust observed in the outer ring (≥4 µm) compared to the inner (≤0.4 µm). In the inner ring, higher particle speed could lead to increased fragmentation rates. In addition, the inner ring may also be depleted of ‘larger’ grains (≳1 µm), because of the radial drift. The drift speed, for a given grain size, depends on the local gas density, which sets the Stokes number (see e.g. Birnstiel & Andrews 2014; Andrews 2015). For HD 34700 A, then, the grains ≳1 µm may be depleted from the inner ring much faster than those <1 µm and also faster than their growth timescales. Eventually, the inner ring would be left only with the smallest grains, ≤0.4 µm. Detailed theoretical simulations of this disk are required to settle this argument quantitatively, taking into account also the effects of vertical dust distribution. We save a similar approach for future studies.
4.3 Spiral arms excitation
In Sect. 3.3, we analysed the spiral structures observed in the disk of HD 34700 A. The literature on spiral arms is solid on the theoretical side, where simulations are able to produce spiral perturbations as a result of several different physical causes, such as planets (Zhu et al. 2015; Zhu & Zhang 2022), flybys (Smallwood et al. 2023; Cuello et al. 2023), binarity (Calcino et al. 2023), gravitational instability (Forgan et al. 2018) and vortices (Paardekooper et al. 2010; Huang et al. 2019). Observationally, however, it is difficult to determine the cause of a given spiral wake, as the spiral morphology can be degenerate (see, e.g. Forgan et al. 2018; Bae et al. 2023). In general, the presence of a compact object in a disk is manifested through inner and outer spiral wakes. The outer wakes have a vanishing pitch angle with increasing radius. With enough spatial resolution, the pitch angle is expected to peak near the position of the perturber, theoretically reaching values near 90°, with heavier objects yielding larger angles (Zhu et al. 2015). Real spiral wakes most often do not adhere to a simple analytical shape. The spiral fitting is relevant in the context of describing a qualitative overall morphology and providing the pitch angle’s behaviour. Addressing first the outer ring itself: the pitch angle is higher at smaller radii, in the 270° < ϕ < 360° quadrant, but is limited to moderate values (≤13°). The substructures above the outer ring (not fitted), assuming they are spiral arms, show a much higher pitch angle. Zhu & Zhang (2022) demonstrated how eccentric massive planets can have a strong impact on the shape of spiral wakes, creating complex overlapping patterns. They themselves mention that HD 34700 A’s spirals would be naturally produced by an eccentric perturber.
Concerning arms C1 and S1, they stand out from the rest of the disk for their extension and their large pitch angles ≳30°. Based on the similarities we found between C1 and S1, it seems reasonable to assume a physical connection between them. Overall, their growing slope with increasing radius would point to a perturber outside the observed disk, such as a bound compact object or a flyby event. Uyama et al. (2020) already suggested a flyby between HD 34700 A and B components, which should have been closer in the past 8000 years, as they infer from proper motion calculations. On the one hand, simulations of Cuello et al. (2020, 2023) show that flybys indeed produce large scale regular spiral patterns with large pitch angles. On the other hand, they found that these induced spiral arms lasted only for a few dynamical times after the flyby (which happens only once), translating to a typical dissipation time of a few thousand years. 8000 yr could then push the upper limit on survival time, although not ruling it out. On a side note, if the flyby is close enough, the perturber can steal some dust and create a disk of its own (Cuello et al. 2023). If HD 34700 B was the flyby perturber and has the same age as the C component (as expected), this could explain why we do see a mm-dust disk around B and not around C, in the ALMA continuum data. One last hypothesis for the creation of C1 and S1 spirals involves the possibility of accreting new interstellar matter from cold gas clouds, which we illustrate separately in the next section.
4.4 Cloudlet capture and late infall
At a crossroad between dust segregation and ring morphology, we mention the possibility of a late accretion event (see e.g. Ginski et al. 2021; Mesa et al. 2022). It is possible for a young star moving through a heterogeneous formation environment (giant molecular clouds) to encounter condensations of cold insterstellar gas, or cloudlets (Dullemond et al. 2019). Whether the primordial disk is already depleted or is still present, the freshly captured gas will evolve to form a new disk around the central star. Referring to the work of Kuffmeier et al. (2020), we can find similarities between the appearance of the newly formed disk and HD 34700 A. In particular, the simulations illustrated in Fig. 6 of Kuffmeier et al. (2020), display a wealth of spiral arms due to the infall of the cloudlet gas, creating a ‘flocculent’ new disk that qualitatively resembles the outer ring of HD 34700 A. Moreover, peculiar to cloud capture is the creation of a widely extended and sparse spiral arm, connecting the original gas cloud to the material condensing around the star (as shown in the different simulations of Kuffmeier et al. 2020). The spiral arm C1 analysed in Sect. 3.3, may result from a similar cloudlet capture event. We might also interpret the HD 34700 A inner ring as the remains of a primordial disk (ALMA data point to a high depletion of mm-sized grains in the disk) and the outer ring and spirals as the results of a late infall event. This hypothesis might provide a reasonable justification for the wildly different morphology of the two rings and the properties of their dust grains. Some caveats of this argument concern the intrinsic properties of the interstellar dust captured, which should be more pristine than the processed material of the original disk, and the interaction between a pre-existing disk and the captured gas. Considering statistically random orientations for the star-cloudlet encounter and for their angular momenta, the creation of a new ring lying on the same plane as the pre-existing disk, without disrupting it, might be an unlikely coincidence. Lastly, the outermost shells of the gas cloud can sometimes be detected as extended reflection nebulosity near the star, as for the case of FU Orionis (Dullemond et al. 2019) or SU Aur (Ginski et al. 2021). We did not observe similar features around HD 34700 A, but the capture conditions are relevant in this regard and may not apply to our case. Overall, the late infall scenario cannot be ruled out.
5 Conclusions
We have reported the discovery of a new ring within the disk of the binary star HD 34700 A. This new inner ring was detected thanks to the SPHERE/ZIMPOL instrument in the Hα band, at shorter wavelengths than the already known outer ring (which is also bright in the J, H, and K bands). The variety of substructures in this disk suggests the presence of several disk-shaping mechanisms acting simultaneously. We argue that the disk inner features (ring shapes, gaps, dust segregation, and millimetre-dust asymmetry) may be shaped by an as of yet unseen companion of a few Jupiter masses, whereas the outer disk morphology and the extended spirals may be created by either cloudlet capture or flybys. We summarise the key findings of this work in the following:
We resolved an inner ring extending approximately from 65 au to 20 au, with a PA ≈ 87°. It is likely to be a slightly eccentric ring, based on the centre offset with respect to the host stars;
The LoS inclination inferred for the inner ring (~40°) is compatible with those of the outer ring and of the binary host (with the caveat of an unknown PA for this). This suggests a strong coplanarity of the whole system, up to large radial separations of hundreds of astronomical units;
We find a sharp segregation in the dust populations of the two rings. Based on the rings’ detection passbands and the effective scattering asymmetry parameters, the typical grain sizes may differ by one order of magnitude between the inner and outer ring, which may then consist of aggregates roughly of ≲0.4 µm and ≳4 µm, respectively;
We detected two very extended spiral arms with similar shapes and a high pitch angle (≳30°), at opposite sides of the disk. We cannot rule out either the flyby or the cloud capture scenarios as potential excitation mechanisms;
The outer ring appears as a spiral arm itself, with a varying radial distance from the star and complex substructures. It is not clear whether the two rings are spatially contiguous;
We obtained the CO velocity map for HD 34700 B and find that the latter rotates with a completely different orientation than the A component. No CO or millimetre-dust streamer could be resolved between A and B, from our ALMA data.
The mechanisms responsible for dust segregation still require further investigation, but there are hints of intense hydrody-namical perturbations in the disk of HD 34700 A. One or more compact objects with several Jupiter masses could be responsible for carving the gap between the rings, creating the millimetre-dust crescent and possibly segregating the dust grain sizes to some extent. The inward migration, diffusion, and accumulation of dust in the pressure maxima could have a particular equilibrium, giving rise to the differentiated rings of this system. In addition, the inner ring cavity is too large to be carved by the tight binary star, so other processes must be at work to explain that. We cannot rule out the presence of substellar companions, based on our detection limits, but future observations with greater sensitivity instruments (JWST or the future ELT) may hold the key. Alternatively, higher spectral and spatial resolution ALMA data may find kinematic anomalies within the disk, or ‘velocity kinks’, as described by Perez et al. (2015). This technique has already detected several potential signatures of giant planets and can also be used for embedded bodies (see, e.g. Teague et al. 2018; Pinte et al. 2020, 2023). We save for future studies the further characterisation of some features in the disk of HD 34700 A which were not yet conclusively framed and that could be key elements for creating a complete physical model of this system.
Acknowledgements
This work has been partially supported by the Large Grant INAF 2022 YODA (YSOs Outflows, Disks and Accretion: towards a global framework for the evolution of planet forming systems). The LBT is an international collaboration among institutions in the United States, Italy and Germany. LBT Corporation partners are: The University of Arizona on behalf of the Arizona Board of Regents; Istituto Nazionale di Astrofisica, Italy; LBT Beteiligungsgesellschaft, Germany, representing the Max-Planck Society, The Leibniz Institute for Astrophysics Potsdam, and Heidelberg University; The Ohio State University, representing OSU, University of Notre Dame, University of Minnesota and University of Virginia. We acknowledge the use of the Large Binocular Telescope Interferometer (LBTI) and the support from the LBTI team, specifically from Amali Vaz, Jared Carlson, Jennifer Power, Steve Ertel. This publication makes use of VOSA, developed under the Spanish Virtual Observatory project supported from the Spanish MICINN through grant AyA2008-02156. This work has made use of data from the European Space Agency (ESA) mission Gaia (https://www.cosmos.esa.int/gaia), processed by the Gaia Data Processing and Analysis Consortium (DPAC, https://www.cosmos.esa.int/web/gaia/dpac/consortium). Funding for the DPAC has been provided by national institutions, in particular the institutions participating in the Gaia Multilateral Agreement. T.B. acknowledges funding from the European Research Council (ERC) under the European Union’s Horizon 2020 research and innovation programme under grant agreement No. 714769 and funding by the Deutsche Forschungsgemeinschaft (DFG, German Research Foundation) under grants 361140270, 325594231, and Germany’s Excellence Strategy – EXC-2094 − 390783311. S.F. is funded by the European Union under the European Union’s Horizon Europe Research & Innovation Programme 101076613 (UNVEIL). C.R. is grateful for support from the Max Planck Society and acknowledges funding by the Deutsche Forschungsgemeinschaft (DFG, German Research Foundation) − 325594231. A.R. has been supported by the UK Science and Technology research Council (STFC) via the consolidated grant ST/W000997/1 and by the European Union’s Horizon 2020 research and innovation programme under the Marie Sklodowska-Curie grant agreement No. 823823 (RISE DUSTBUSTERS project). This project has received funding from the European Research Council (ERC) under the European Union’s Horizon 2020 research and innovation programme (PROTOPLANETS, grant agreement No. 101002188), as well as under the Horizon Europe research and innovation program (Dust2Planets, grant agreement No. 101053020). A.Z. acknowledges support from ANID – Millennium Science Initiative Program – Center Code NCN2021_080.
Appendix A Additional figures
We add to this appendix a few extra figures to complement the already numerous figure within the text.
In Fig. A.1 we show for completeness the Stokes parameters frames for the IRDIS H-band data of 2019. These have been illustrated with a composite logarithmic colour scale that helps to highlight the faint features of the frames.
In Fig. A.4 and Fig. A.5 we show the results of the phase fitting procedure on other two datasets for the outer ring(in addition to the one shown within the main text). These allow one to form a more complete panoramic of the scattering properties of the outer dust, and extend the wavelength domain where this study was performed.
We show the contrast limit curve for the IFS non-coronagraphic data reduction of the 26-11-2021 in Fig. A.2. The relative signal-to-noise image map is shown in Fig. A.3. These allowed us to search for stellar companions in the vicinity of the central binary, as described in Sect. 3.2.3. The limits obtained from the 14-11-2021 data were of worse quality, and we did not show them.
Finally, in Fig. A.6 and Fig. A.7 we illustrate respectively the gas velocity and continuum emission obtained from the ALMA data. These images show both the A and B components of HD 34700 in the same FoV, to highlight their differences.
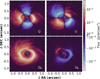 |
Fig. A.1 Stokes parameters frames for the polarimetric observation of HD 34700 A with IRDIS in the H band. The subplots are, in order: the Q, U, Qϕ and Uϕ frames, as overlaid in white text. The colour scale, shared between all four frames, is a symmetric logarithmic function, chosen to display all the fainter details. The coordinates are reported as delta offsets with respect to the nominal position of the central star. |
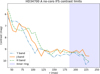 |
Fig. A.2 Contrast limit curves as a function of the distance from the central star HD 34700 A, for the inner system region (see Fig. A.3). The blue shaded area represents the inner ring (partially), while the coloured lines the contrasts for the three IFS broad bands (see plot legend). These were obtained from the IFS flux calibration frames, with no coronagraph. Below 42 mas self-subtraction becomes more significant and thus this range was excluded. |
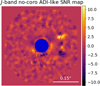 |
Fig. A.3 Map of the signal-to-noise ratio, relative to the ADI-like reduction described in Sect. 3.2.3 on the 26-11-2021 IFS observation of HD 34700 A. The central blue circle masks the area within 1.3 λ/D, where self-subtraction is significant. The colourbar indicates the S/N level. A couple of higher-S/N points on the western side may be spurious speckles; no reliable point-source is detected in this reduction. North is up and east to the left. |
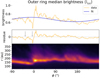 |
Fig. A.4 Analysis of the total intensity scattering brightness of the outer ring on the iRDI K-band data. Top: Median radial brightness of the ring (yellow), as a function of the azimuth angle on the disk plane (0° is north), normalised to the maximum. Middle: Residues of the data to the best fit function, with grey arrows pointing towards the candidate shadow features. Bottom: iRDI data transformed to polar coordinates and corrected for the r2 flux dilution, from which the median brightness of the top panel was extracted. The best-fit asymmetry parameter was g = +0.04 ± 0.01. |
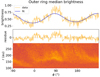 |
Fig. A.5 Analysis of the polarised scattering brightness of the outer ring on the ZIMPOL data. Top: Median radial brightness of the ring (yellow), as a function of the azimuth angle on the disk plane (0° is north), normalised to the maximum. Middle: Residues of the data to the best fit function. Bottom: ZIMPOL Qϕ data transformed to polar coordinates and corrected for the r2 flux dilution, from which the median brightness of the top panel was extracted. The best-fit asym-metry parameter was g = −0.03 ± 0.01. |
 |
Fig. A.6 ALMA data velocity map, obtained from the 12CO molecular lines, illustrating in the same FoV both HD 34700 A and В (on the right and on the left, respectively). North is up and east is left. The yellow cross marks the A star position. Gas rotation is detected in the В component as well, although with a weaker S/N. The directions of rotation of the two gas disks are different, as are their PA in the sky plane. The beam is 0.52″ × 0.48″ at a PA of −61°. The gas speed values refer to the Local Standard of Rest. |
 |
Fig. A.7 ALMA 1.3 mm continuum emission contours, including in the same FoV both HD 34700 A and В (on the right and on the left, respectively). North is up and east is left. The yellow cross marks the A star position. The emission around A is asymmetric and off-centre, whereas around В is centred and elliptical. The beam is 0.41″ × 0.28″ at a PA of −64°. |
References
- Allard, F., Hauschildt, P. H., Alexander, D. R., Tamanai, A., & Schweitzer, A. 2001, ApJ, 556, 357 [Google Scholar]
- Andrews, S. M. 2015, PASP, 127, 961 [NASA ADS] [CrossRef] [Google Scholar]
- Arellano Ferro, A., & Giridhar, S. 2003, A & A, 408, L29 [CrossRef] [EDP Sciences] [Google Scholar]
- Bae, J., Isella, A., Zhu, Z., et al. 2023, ASP Conf. Ser, 534, 423 [NASA ADS] [Google Scholar]
- Baraffe, I., Homeier, D., Allard, F., & Chabrier, G. 2015, A & A, 577, A42 [NASA ADS] [CrossRef] [EDP Sciences] [Google Scholar]
- Benac, P., Matrà, L., Wilner, D. J., et al. 2020, ApJ, 905, 120 [NASA ADS] [CrossRef] [Google Scholar]
- Benisty, M., Stolker, T., Pohl, A., et al. 2017, A & A, 597, A42 [NASA ADS] [CrossRef] [EDP Sciences] [Google Scholar]
- Benisty, M., Dominik, C., Follette, K., et al. 2023, ASP Conf. Ser., 534, 605 [NASA ADS] [Google Scholar]
- Beuzit, J. L., Vigan, A., Mouillet, D., et al. 2019, A & A, 631, A155 [NASA ADS] [CrossRef] [EDP Sciences] [Google Scholar]
- Birnstiel, T., & Andrews, S. M. 2014, ApJ, 780, 153 [Google Scholar]
- Birnstiel, T., Dullemond, C. P., & Pinilla, P. 2013, A & A, 550, A8 [Google Scholar]
- Boccaletti, A., Abe, L., Baudrand, J., et al. 2008, SPIE Conf. Ser., 7015, 70151B [NASA ADS] [Google Scholar]
- Boccaletti, A., Di Folco, E., Pantin, E., et al. 2020, A & A, 637, A5 [Google Scholar]
- Bonavita, M., Gratton, R., Desidera, S., et al. 2022, A & A, 663, A144 [NASA ADS] [CrossRef] [EDP Sciences] [Google Scholar]
- Calcino, J., Price, D. J., Pinte, C., et al. 2023, MNRAS, 523, 5763 [NASA ADS] [CrossRef] [Google Scholar]
- Carbillet, M., Bendjoya, P., Abe, L., et al. 2011, Exp. Astron., 30, 39 [Google Scholar]
- Cazzoletti, P., van Dishoeck, E. F., Pinilla, P., et al. 2018, A & A, 619, A161 [NASA ADS] [CrossRef] [EDP Sciences] [Google Scholar]
- Claudi, R. U., Turatto, M., Gratton, R. G., et al. 2008, SPIE Conf. Ser., 7014, 70143E [Google Scholar]
- Cuello, N., Louvet, F., Mentiplay, D., et al. 2020, MNRAS, 491, 504 [Google Scholar]
- Cuello, N., Ménard, F., & Price, D. J. 2023, Eur. Phys. J. Plus, 138, 11 [NASA ADS] [CrossRef] [Google Scholar]
- Currie, T., Lawson, K., Schneider, G., et al. 2022, Nat. Astron., 6, 751 [NASA ADS] [CrossRef] [Google Scholar]
- de Boer, J., Salter, G., Benisty, M., et al. 2016, A & A, 595, A114 [NASA ADS] [CrossRef] [EDP Sciences] [Google Scholar]
- de Boer, J., Langlois, M., van Holstein, R. G., et al. 2020, A & A, 633, A63 [NASA ADS] [CrossRef] [EDP Sciences] [Google Scholar]
- Dohlen, K., Langlois, M., Saisse, M., et al. 2008, SPIE Conf. Ser., 7014, 70143L [Google Scholar]
- Dullemond, C. P., Birnstiel, T., Huang, J., et al. 2018, ApJ, 869, L46 [NASA ADS] [CrossRef] [Google Scholar]
- Dullemond, C. P., Küffmeier, M., Goicovic, F., et al. 2019, A & A, 628, A20 [NASA ADS] [CrossRef] [EDP Sciences] [Google Scholar]
- Engler, N., Schmid, H. M., Thalmann, C., et al. 2017, A & A, 607, A90 [NASA ADS] [CrossRef] [EDP Sciences] [Google Scholar]
- Foreman-Mackey, D., Hogg, D. W., Lang, D., & Goodman, J. 2013, PASP, 125, 306 [Google Scholar]
- Forgan, D. H., Ilee, J. D., & Meru, F. 2018, ApJ, 860, L5 [Google Scholar]
- Gaia Collaboration (Brown, A. G. A., et al.) 2021, A & A, 649, A1 [NASA ADS] [CrossRef] [EDP Sciences] [Google Scholar]
- Gaia Collaboration (Vallenari, A., et al.) 2023, A & A, 674, A1 [NASA ADS] [CrossRef] [EDP Sciences] [Google Scholar]
- Ginski, C., Stolker, T., Pinilla, P., et al. 2016, A & A, 595, A112 [NASA ADS] [CrossRef] [EDP Sciences] [Google Scholar]
- Ginski, C., Ménard, F., Rab, C., et al. 2020, A & A, 642, A119 [NASA ADS] [CrossRef] [EDP Sciences] [Google Scholar]
- Ginski, C., Facchini, S., Huang, J., et al. 2021, ApJ, 908, L25 [NASA ADS] [CrossRef] [Google Scholar]
- Guerri, G., Daban, J.-B., Robbe-Dubois, S., et al. 2011, Exp. Astron., 30, 59 [Google Scholar]
- Haffert, S. Y., Bohn, A. J., de Boer, J., et al. 2019, Nat. Astron., 3, 749 [Google Scholar]
- Hammel, B., & Sullivan-Molina, N. 2020, https://doi.org/10.5281/zenodo.3723294 [Google Scholar]
- Hammond, I., Christiaens, V., Price, D. J., et al. 2023, MNRAS, 522, L51 [NASA ADS] [CrossRef] [Google Scholar]
- Henyey, L. G., & Greenstein, J. L. 1941, ApJ, 93, 70 [Google Scholar]
- Ho, P. T. P., Moran, J. M., & Lo, K. Y. 2004, ApJ, 616, L1 [Google Scholar]
- Huang, P., Dong, R., Li, H., Li, S., & Ji, J. 2019, ApJ, 883, L39 [NASA ADS] [CrossRef] [Google Scholar]
- Hunziker, S., Schmid, H. M., Mouillet, D., et al. 2020, A & A, 634, A69 [NASA ADS] [CrossRef] [EDP Sciences] [Google Scholar]
- Keppler, M., Benisty, M., Müller, A., et al. 2018, A & A, 617, A44 [NASA ADS] [CrossRef] [EDP Sciences] [Google Scholar]
- Keppler, M., Penzlin, A., Benisty, M., et al. 2020, A & A, 639, A62 [NASA ADS] [CrossRef] [EDP Sciences] [Google Scholar]
- Kervella, P., Arenou, F., & Thévenin, F. 2022, A & A, 657, A7 [CrossRef] [EDP Sciences] [Google Scholar]
- Kley, W., & Dirksen, G. 2006, A & A, 447, 369 [NASA ADS] [CrossRef] [EDP Sciences] [Google Scholar]
- Kuffmeier, M., Goicovic, F. G., & Dullemond, C. P. 2020, A & A, 633, A3 [NASA ADS] [CrossRef] [EDP Sciences] [Google Scholar]
- Kuhn, J. R., Potter, D., & Parise, B. 2001, ApJ, 553, L189 [NASA ADS] [CrossRef] [Google Scholar]
- Lyra, W., & Lin, M.-K. 2013, ApJ, 775, 17 [Google Scholar]
- Macintosh, B., Graham, J. R., Ingraham, P., et al. 2014, PNAS, 111, 12661 [NASA ADS] [CrossRef] [Google Scholar]
- Maire, A.-L., Langlois, M., Dohlen, K., et al. 2016, SPIE Conf. Ser., 9908, 990834 [Google Scholar]
- Marois, C., Lafrenière, D., Doyon, R., Macintosh, B., & Nadeau, D. 2006, ApJ, 641, 556 [Google Scholar]
- McMullin, J. P., Waters, B., Schiebel, D., Young, W., & Golap, K. 2007, ASP Conf. Ser., 376, 127 [Google Scholar]
- Mesa, D., Gratton, R., Zurlo, A., et al. 2015, A & A, 576, A121 [Google Scholar]
- Mesa, D., Keppler, M., Cantalloube, F., et al. 2019, A & A, 632, A25 [NASA ADS] [CrossRef] [EDP Sciences] [Google Scholar]
- Mesa, D., Ginski, C., Gratton, R., et al. 2022, A & A, 658, A63 [NASA ADS] [CrossRef] [EDP Sciences] [Google Scholar]
- Min, M., Rab, C., Woitke, P., Dominik, C., & Ménard, F. 2016, A & A, 585, A13 [NASA ADS] [CrossRef] [EDP Sciences] [Google Scholar]
- Monnier, J. D., Harries, T. J., Bae, J., et al. 2019, ApJ, 872, 122 [Google Scholar]
- Mora, A., Merín, B., Solano, E., et al. 2001, A & A, 378, 116 [NASA ADS] [CrossRef] [EDP Sciences] [Google Scholar]
- Paardekooper, S.-J., Lesur, G., & Papaloizou, J. C. B. 2010, ApJ, 725, 146 [Google Scholar]
- Perez, S., Dunhill, A., Casassus, S., et al. 2015, ApJ, 811, L5 [NASA ADS] [CrossRef] [Google Scholar]
- Pinilla, P., Benisty, M., & Birnstiel, T. 2012, A & A, 545, A81 [NASA ADS] [CrossRef] [EDP Sciences] [Google Scholar]
- Pinilla, P., Klarmann, L., Birnstiel, T., et al. 2016, A & A, 585, A35 [NASA ADS] [CrossRef] [EDP Sciences] [Google Scholar]
- Pinte, C., Price, D. J., Ménard, F., et al. 2020, ApJ, 890, L9 [CrossRef] [Google Scholar]
- Pinte, C., Teague, R., Flaherty, K., et al. 2023, ASP Conf. Ser., 534, 645 [NASA ADS] [Google Scholar]
- Quanz, S. P., Schmid, H. M., Geissler, K., et al. 2011, ApJ, 738, 23 [Google Scholar]
- Rameau, J., Follette, K. B., Pueyo, L., et al. 2017, AJ, 153, 244 [Google Scholar]
- Rice, W. K. M., Armitage, P. J., Wood, K., & Lodato, G. 2006, MNRAS, 373, 1619 [Google Scholar]
- Rosotti, G. P. 2023, New A Rev., 96, 101674 [NASA ADS] [CrossRef] [Google Scholar]
- Sanchis, E., Picogna, G., Ercolano, B., Testi, L., & Rosotti, G. 2020, MNRAS, 492, 3440 [Google Scholar]
- Schmid, H. M., Bazzon, A., Roelfsema, R., et al. 2018, A & A, 619, A9 [NASA ADS] [CrossRef] [EDP Sciences] [Google Scholar]
- Seok, J. Y., & Li, A. 2015, ApJ, 809, 22 [NASA ADS] [CrossRef] [Google Scholar]
- Skrutskie, M. F., Jones, T., Hinz, P., et al. 2010, SPIE Conf. Ser., 7735, 77353H [NASA ADS] [Google Scholar]
- Smallwood, J. L., Yang, C.-C., Zhu, Z., et al. 2023, MNRAS, 521, 3500 [NASA ADS] [CrossRef] [Google Scholar]
- Soummer, R., Pueyo, L., & Larkin, J. 2012, ApJ, 755, L28 [Google Scholar]
- Stapper, L. M., & Ginski, C. 2022, A & A, 668, A50 [NASA ADS] [CrossRef] [EDP Sciences] [Google Scholar]
- Sterzik, M. F., Melo, C. H. F., Tokovinin, A. A., & van der Bliek, N. 2005, A & A, 434, 671 [NASA ADS] [CrossRef] [EDP Sciences] [Google Scholar]
- Stolker, T., Dominik, C., Min, M., et al. 2016, A & A, 596, A70 [NASA ADS] [CrossRef] [EDP Sciences] [Google Scholar]
- Szulágyi, J., & Garufi, A. 2021, MNRAS, 506, 73 [CrossRef] [Google Scholar]
- Szulágyi, J., Dullemond, C. P., Pohl, A., & Quanz, S. P. 2019, MNRAS, 487, 1248 [Google Scholar]
- Tazaki, R., & Tanaka, H. 2018, ApJ, 860, 79 [NASA ADS] [CrossRef] [Google Scholar]
- Teague, R., & Foreman-Mackey, D. 2018, RNAAS, 2, 173 [NASA ADS] [Google Scholar]
- Teague, R., Bae, J., Bergin, E. A., Birnstiel, T., & Foreman-Mackey, D. 2018, ApJ, 860, L12 [NASA ADS] [CrossRef] [Google Scholar]
- Torres, G. 2004, AJ, 127, 1187 [NASA ADS] [CrossRef] [Google Scholar]
- Uyama, T., Currie, T., Christiaens, V., et al. 2020, ApJ, 900, 135 [NASA ADS] [CrossRef] [Google Scholar]
- van der Marel, N., Birnstiel, T., Garufi, A., et al. 2021, AJ, 161, 33 [Google Scholar]
- van Holstein, R. G., Snik, F., Girard, J. H., et al. 2017, SPIE Conf. Ser., 10400, 1040015 [Google Scholar]
- van Holstein, R. G., Girard, J. H., de Boer, J., et al. 2020, A & A, 633, A64 [NASA ADS] [CrossRef] [EDP Sciences] [Google Scholar]
- Vigan, A., Moutou, C., Langlois, M., et al. 2010, MNRAS, 407, 71 [Google Scholar]
- Wahhaj, Z., Milli, J., Romero, C., et al. 2021, A & A, 648, A26 [NASA ADS] [CrossRef] [EDP Sciences] [Google Scholar]
- Williams, J. P., Mann, R. K., Francesco, J. D., et al. 2014, ApJ, 796, 120 [NASA ADS] [CrossRef] [Google Scholar]
- yi Luo, Q., Liu, T., Tatematsu, K., et al. 2022, ApJ, 931, 158 [NASA ADS] [CrossRef] [Google Scholar]
- Zhang, S., Zhu, Z., Huang, J., et al. 2018, ApJ, 869, L47 [Google Scholar]
- Zhu, Z., & Stone, J. M. 2014, ApJ, 795, 53 [Google Scholar]
- Zhu, Z., & Zhang, R. M. 2022, MNRAS, 510, 3986 [NASA ADS] [CrossRef] [Google Scholar]
- Zhu, Z., Nelson, R. P., Dong, R., Espaillat, C., & Hartmann, L. 2012, ApJ, 755, 6 [Google Scholar]
- Zhu, Z., Dong, R., Stone, J. M., & Rafikov, R. R. 2015, ApJ, 813, 88 [Google Scholar]
See the NASA Exoplanet Archive: https://exoplanetarchive.ipac.caltech.edu/index.html
The default settings were adopted for this reduction. See the software documentation at: https://irdap.readthedocs.io/en/latest/
‘Renormalised Unit Weight Error’, it indicates the quality of the astrometric fit. A RUWE >1.4 could indicate that the source is nonsingle (or otherwise problematic) and it is commonly used as a possible hint of unresolved companions.
To be precise, they referred to this arm as ‘S1b’ in their paper, as the continuation of a ‘S1a’ after a shadow. With our polar deprojection these two structures seemed independent of each other; thus, we decided to label S1 the evident log-spiral at r > 300 au and neglect the other fuzzy structure.
All Tables
Best-fit scattering asymmetry parameter g and relative deprojection angles, obtained from the MCMC regression.
All Figures
|
Fig. 1 ZIMPOL Qϕ image of HD 34700 A with annotations. The field of view is 2.16″ × 2.16″. The blue circle represents the coronagraph. North is up and east is left. The colour bar is linear and has arbitrary units. |
| In the text | |
|
Fig. 2 Images of HD 34700 A showing the observational data used in this paper, in order of increasing wavelength. North is up and east is to the left. The FoV shown in all panels is 2.16″ × 2.16″. The blue circles represent the coronagraphs, except for LMIRCam observations in L′ band (without coronagraph), where the blue area masks all the spurious signals within λ/D, and ALMA data. In the ALMA continuum image the red line represents the outer ring, while the blue ellipse the inner ring; the continuum beam size is 0.″41 × 0.″ 28 at a PA of −64°. The dashed contours denote levels of [0.4, 2, 4, 6] mJy/beam. The colour bars have arbitrary units except for ALMA; they all have linear scale, except for IRDIS H-band, which is logarithmic. |
| In the text | |
|
Fig. 3 Face-on deprojection of IRDIS H-band Qϕ data, corrected by r2 light dilution, and with special logarithmic colour scale to highlight the faint outer spirals. The two opposite arms at east and west (C1 and S1) stand out from the disk. HD 34700 В component is also visible in the FoV, in the upper-left corner. The inner ring plane (i ~ 40°, see Table 3) was considered for deprojecting to face-on. |
| In the text | |
|
Fig. 4 Overlay of the ellipse axes (orange) and the inner ring (white) as fitted in this work. The yellow cross marks the position of the central binary star. For reference we included the ellipse axes obtained by Uyama et al. (2020) based on the outer ring alone (dotted green). The underlying image is a two-band Qϕ composite of the IRDIS H-band (green layer) and the ZIMPOL Нα (blue layer). |
| In the text | |
|
Fig. 5 Polar-coordinate visualisation of the disk of HD 34700 A, from IRDIS Qϕ frame, multiplied for a r2 correction factor for the flux dilution and lightly smoothed. Note: the disk is duplicated horizontally to avoid cuts at the image boundaries (notice the x axis). The colour scale is logarithmic to highlight the faint spiral arms. In dashes, the fitted logarithmic (lime green) and archimedean (blue) spiral arms. The cyan circle around 310° represents the approximate centre of the mm-dust emission. |
| In the text | |
|
Fig. 6 ALMA data velocity contours for HD 34700 A, obtained from the 12CO molecular lines. For reference, we put as background the IRDIS H–band Qϕ and marked the source position with a yellow cross. The gas shows a well defined rotation pattern, extending to the innermost regions of the disk. The beam is 0.52″ × 0.48″ at a PA of −61°. The gas speed values refer to the Local Standard of Rest. |
| In the text | |
|
Fig. 7 Analysis of the polarised scattering brightness of the inner ring. Top: median radial brightness of the ring (green), as a function of the azimuth angle on the disk plane (0° is north), normalised to the maximum. Middle: residues of the data to the best-fit function, with grey arrows pointing towards the candidate shadow features. Bottom: ZIMPOL Qϕ data transformed to polar-coordinates and corrected for the r2 flux dilution, from which the median brightness of the top panel was extracted. The best-fit asymmetry parameter was g = 0.41 ± 0.01. |
| In the text | |
|
Fig. 8 Analysis of the polarised scattering brightness of the outer ring. Top: median radial brightness of the ring (yellow), as a function of the azimuth angle on the disk plane (0° is north), normalised to the maximum. Middle: residues of the data to the best-fit function, with grey arrows pointing towards the candidate shadow features. Bottom: IRDIS Qφ data transformed to polar-coordinates and corrected for the r2 flux dilution, from which the median brightness of the top panel was extracted. The best-fit asymmetry parameter was g = −0.16 ± 0.01. |
| In the text | |
|
Fig. 9 Limits on the mass of a planetary companion in the disk of HD 34700 A, based on the reduced observations from IFS (green line), LMIRCam (red dotted line) and the AMES-COND models for a young gas giant 5 Myr old. Shaded areas represent the rough radial extension of the inner ring (blue) and the outer ring (red). |
| In the text | |
|
Fig. A.1 Stokes parameters frames for the polarimetric observation of HD 34700 A with IRDIS in the H band. The subplots are, in order: the Q, U, Qϕ and Uϕ frames, as overlaid in white text. The colour scale, shared between all four frames, is a symmetric logarithmic function, chosen to display all the fainter details. The coordinates are reported as delta offsets with respect to the nominal position of the central star. |
| In the text | |
|
Fig. A.2 Contrast limit curves as a function of the distance from the central star HD 34700 A, for the inner system region (see Fig. A.3). The blue shaded area represents the inner ring (partially), while the coloured lines the contrasts for the three IFS broad bands (see plot legend). These were obtained from the IFS flux calibration frames, with no coronagraph. Below 42 mas self-subtraction becomes more significant and thus this range was excluded. |
| In the text | |
|
Fig. A.3 Map of the signal-to-noise ratio, relative to the ADI-like reduction described in Sect. 3.2.3 on the 26-11-2021 IFS observation of HD 34700 A. The central blue circle masks the area within 1.3 λ/D, where self-subtraction is significant. The colourbar indicates the S/N level. A couple of higher-S/N points on the western side may be spurious speckles; no reliable point-source is detected in this reduction. North is up and east to the left. |
| In the text | |
|
Fig. A.4 Analysis of the total intensity scattering brightness of the outer ring on the iRDI K-band data. Top: Median radial brightness of the ring (yellow), as a function of the azimuth angle on the disk plane (0° is north), normalised to the maximum. Middle: Residues of the data to the best fit function, with grey arrows pointing towards the candidate shadow features. Bottom: iRDI data transformed to polar coordinates and corrected for the r2 flux dilution, from which the median brightness of the top panel was extracted. The best-fit asymmetry parameter was g = +0.04 ± 0.01. |
| In the text | |
|
Fig. A.5 Analysis of the polarised scattering brightness of the outer ring on the ZIMPOL data. Top: Median radial brightness of the ring (yellow), as a function of the azimuth angle on the disk plane (0° is north), normalised to the maximum. Middle: Residues of the data to the best fit function. Bottom: ZIMPOL Qϕ data transformed to polar coordinates and corrected for the r2 flux dilution, from which the median brightness of the top panel was extracted. The best-fit asym-metry parameter was g = −0.03 ± 0.01. |
| In the text | |
|
Fig. A.6 ALMA data velocity map, obtained from the 12CO molecular lines, illustrating in the same FoV both HD 34700 A and В (on the right and on the left, respectively). North is up and east is left. The yellow cross marks the A star position. Gas rotation is detected in the В component as well, although with a weaker S/N. The directions of rotation of the two gas disks are different, as are their PA in the sky plane. The beam is 0.52″ × 0.48″ at a PA of −61°. The gas speed values refer to the Local Standard of Rest. |
| In the text | |
|
Fig. A.7 ALMA 1.3 mm continuum emission contours, including in the same FoV both HD 34700 A and В (on the right and on the left, respectively). North is up and east is left. The yellow cross marks the A star position. The emission around A is asymmetric and off-centre, whereas around В is centred and elliptical. The beam is 0.41″ × 0.28″ at a PA of −64°. |
| In the text | |
Current usage metrics show cumulative count of Article Views (full-text article views including HTML views, PDF and ePub downloads, according to the available data) and Abstracts Views on Vision4Press platform.
Data correspond to usage on the plateform after 2015. The current usage metrics is available 48-96 hours after online publication and is updated daily on week days.
Initial download of the metrics may take a while.