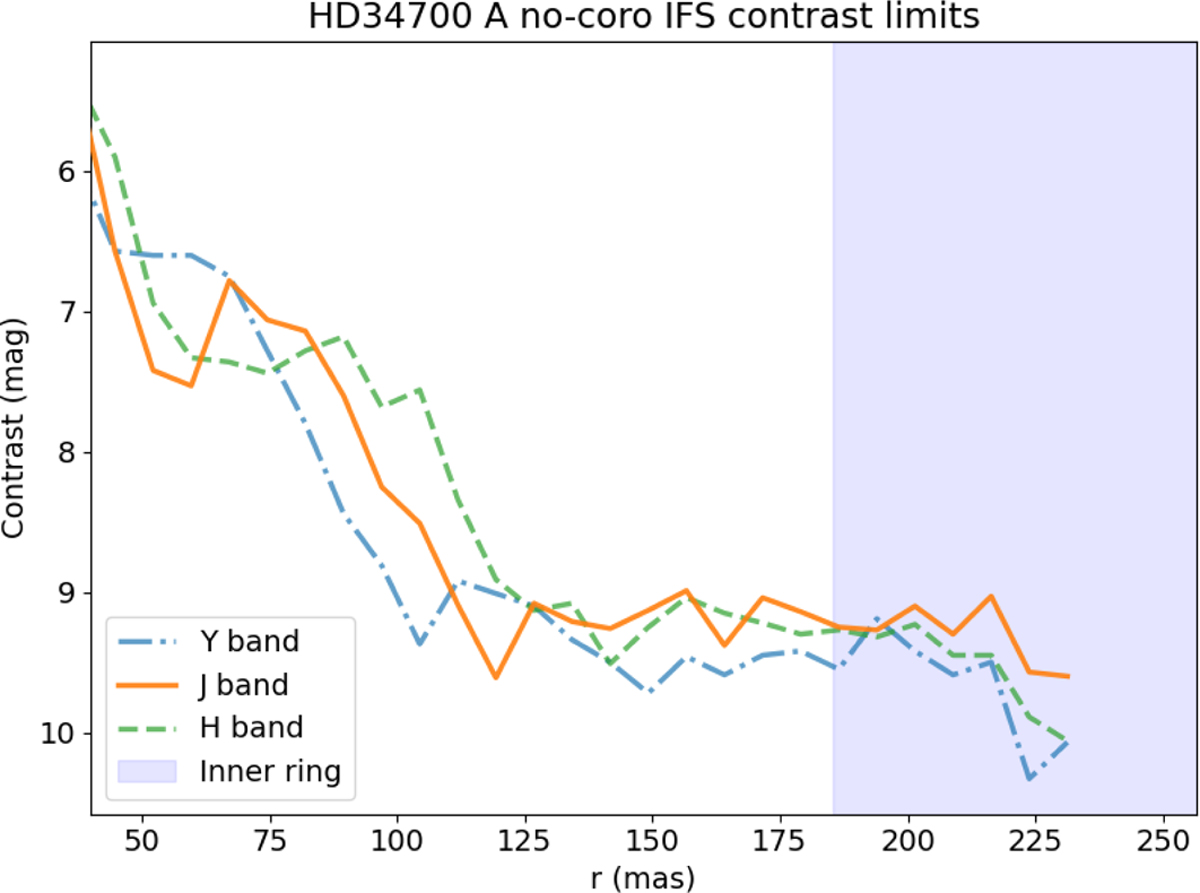
Fig. A.2
Download original image
Contrast limit curves as a function of the distance from the central star HD 34700 A, for the inner system region (see Fig. A.3). The blue shaded area represents the inner ring (partially), while the coloured lines the contrasts for the three IFS broad bands (see plot legend). These were obtained from the IFS flux calibration frames, with no coronagraph. Below 42 mas self-subtraction becomes more significant and thus this range was excluded.
Current usage metrics show cumulative count of Article Views (full-text article views including HTML views, PDF and ePub downloads, according to the available data) and Abstracts Views on Vision4Press platform.
Data correspond to usage on the plateform after 2015. The current usage metrics is available 48-96 hours after online publication and is updated daily on week days.
Initial download of the metrics may take a while.