Fig. A.3
Download original image
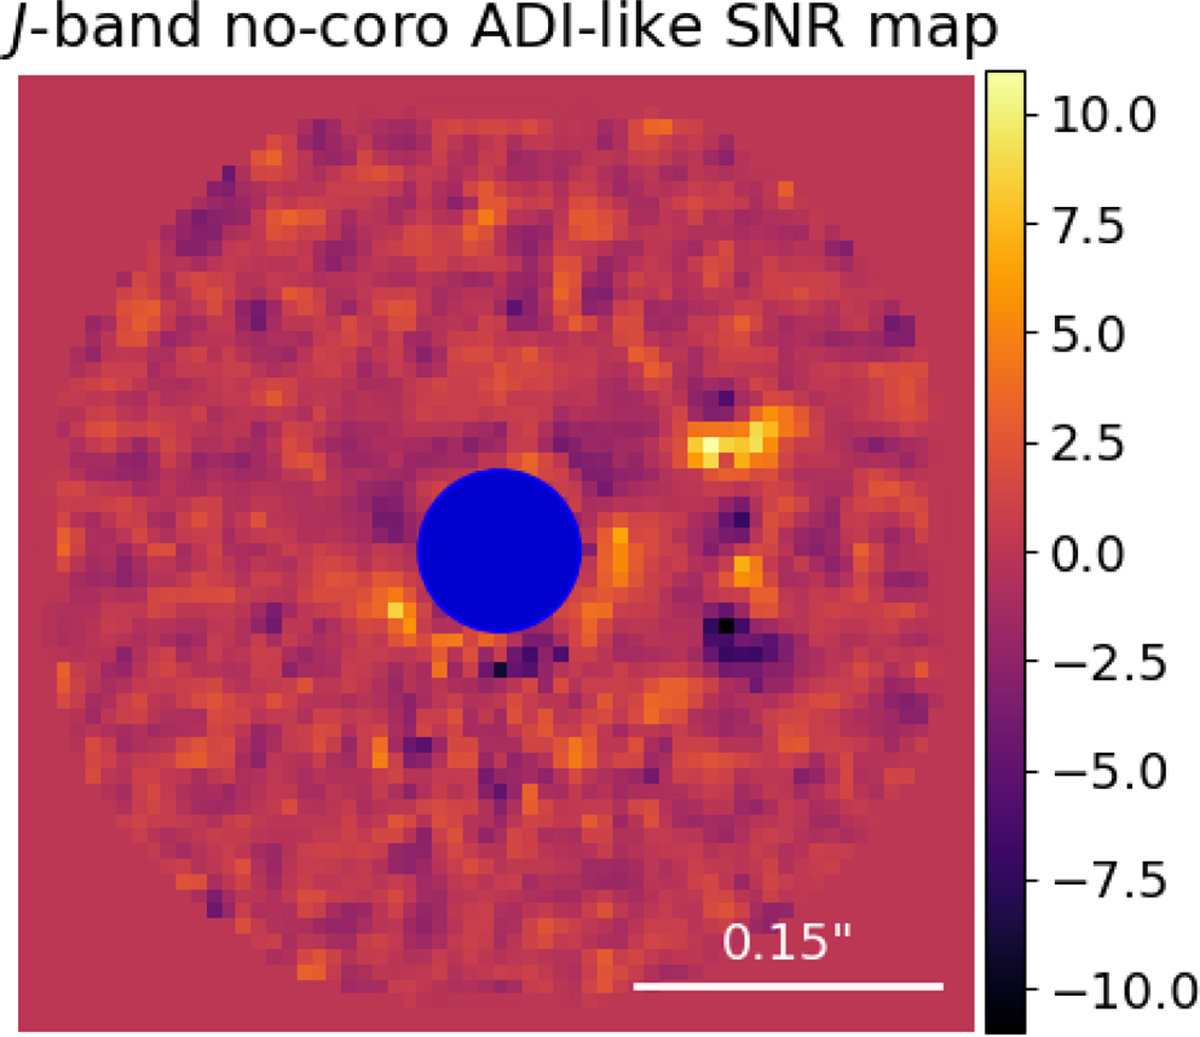
Map of the signal-to-noise ratio, relative to the ADI-like reduction described in Sect. 3.2.3 on the 26-11-2021 IFS observation of HD 34700 A. The central blue circle masks the area within 1.3 λ/D, where self-subtraction is significant. The colourbar indicates the S/N level. A couple of higher-S/N points on the western side may be spurious speckles; no reliable point-source is detected in this reduction. North is up and east to the left.
Current usage metrics show cumulative count of Article Views (full-text article views including HTML views, PDF and ePub downloads, according to the available data) and Abstracts Views on Vision4Press platform.
Data correspond to usage on the plateform after 2015. The current usage metrics is available 48-96 hours after online publication and is updated daily on week days.
Initial download of the metrics may take a while.