Fig. 2
Download original image
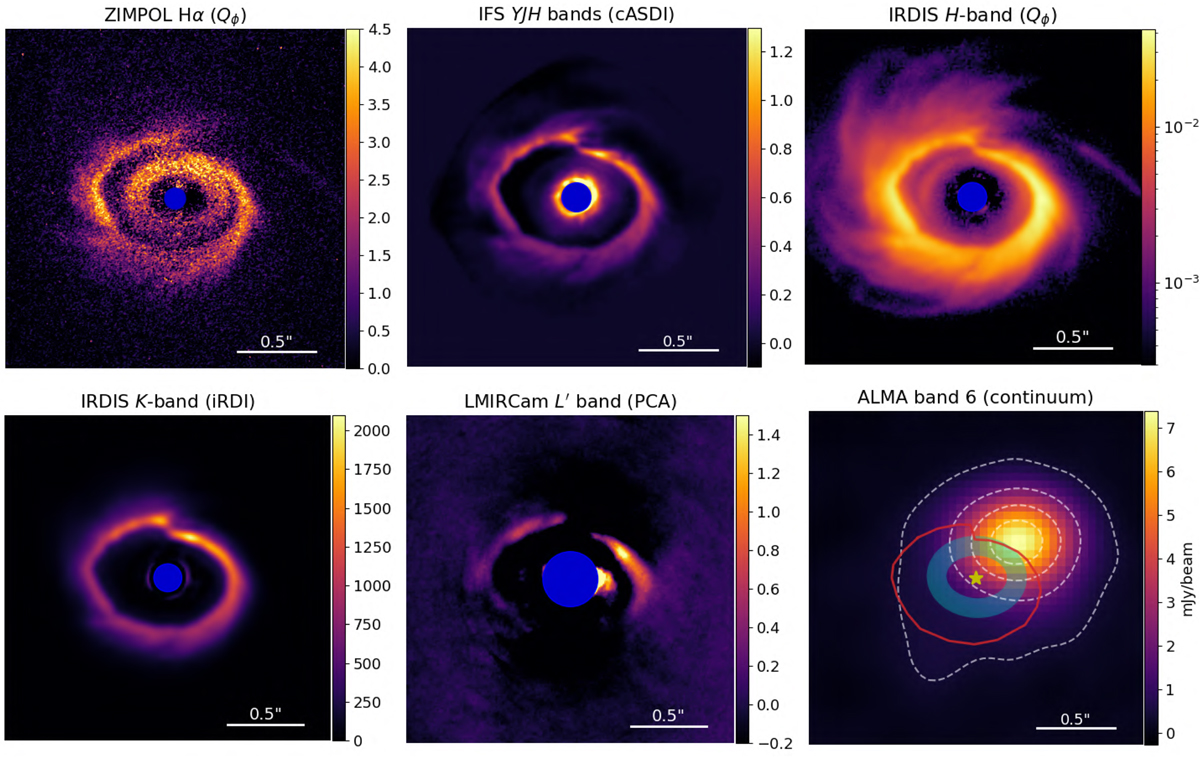
Images of HD 34700 A showing the observational data used in this paper, in order of increasing wavelength. North is up and east is to the left. The FoV shown in all panels is 2.16″ × 2.16″. The blue circles represent the coronagraphs, except for LMIRCam observations in L′ band (without coronagraph), where the blue area masks all the spurious signals within λ/D, and ALMA data. In the ALMA continuum image the red line represents the outer ring, while the blue ellipse the inner ring; the continuum beam size is 0.″41 × 0.″ 28 at a PA of −64°. The dashed contours denote levels of [0.4, 2, 4, 6] mJy/beam. The colour bars have arbitrary units except for ALMA; they all have linear scale, except for IRDIS H-band, which is logarithmic.
Current usage metrics show cumulative count of Article Views (full-text article views including HTML views, PDF and ePub downloads, according to the available data) and Abstracts Views on Vision4Press platform.
Data correspond to usage on the plateform after 2015. The current usage metrics is available 48-96 hours after online publication and is updated daily on week days.
Initial download of the metrics may take a while.