| Issue |
A&A
Volume 680, December 2023
|
|
|---|---|---|
| Article Number | A54 | |
| Number of page(s) | 16 | |
| Section | Extragalactic astronomy | |
| DOI | https://doi.org/10.1051/0004-6361/202347660 | |
| Published online | 08 December 2023 | |
Post-processing of galaxies due to major cluster mergers
I. Hints from galaxy colours and morphologies
1
Universidad Técnica Federico Santa María, Av. España 1680, Valparaíso, Chile
2
Instituto de Física y Astronomia, Universidad de Valparaíso, 1111 Gran Bretaña, Valparaíso, Chile
e-mail: This email address is being protected from spambots. You need JavaScript enabled to view it.
3
Instituto de Radioastronomia y Astrofisica, UNAM, Campus Morelia, Michoacán, CP 58089, Mexico
4
European Southern Observatory (ESO), Alonso de Cordova 3107, Santiago, Chile
5
INAF-Osservatorio Astronomico di Padova, Vicolo Osservatorio 5, 35122 Padova, Italy
Received:
4
August
2023
Accepted:
22
September
2023
Abstract
The environments of galaxy clusters that underwent a recent (≤3 Gyr) major merger are harsher than those of dynamically relaxed clusters due to the global hydrodynamical disturbance and the merger-shock-heated intracluster medium. However, the impact of such extreme cluster interactions on the member galaxy properties is not very well constrained. We explore the integrated star formation properties of galaxies through galaxy colours as well as the morphology buildup in three nearby (0.04 < z < 0.07) young (∼0.6−1 Gyr) post-merger clusters – A3667, A3376, and A168 – and seven relaxed clusters to disentangle merger-induced post-processing signatures from the expected effects of high-density cluster environments. Exploiting optical spectroscopy and photometry from the OmegaWINGS survey, we find that post-merger clusters are evolved systems with uniform spiral fractions, a uniform fraction of blue galaxies, and constant scatter in the colour–magnitude relations, a regularity that is absent in dynamically relaxed clusters. While no clear merger-induced signatures were revealed in the global colours of galaxies, we conclude that different global star formation histories of dynamically relaxed clusters lead to considerable scatter in galaxy properties, resulting in the pre-merger cluster environment potentially contaminating any merger-induced signal of galaxy properties. We find red spirals to be common in both post-merger and relaxed clusters, while post-merger clusters appear to host a non-negligible population of blue early-type galaxies. We propose that while such merging cluster systems absorb extra cosmic web populations hitherto not part of the original merging subclusters, a ∼1 Gyr timescale is possibly too short see changes in the global colours and morphologies of galaxies.
Key words: galaxies: clusters: general / galaxies: evolution / galaxies: photometry / galaxies: general
© The Authors 2023
 Open Access article, published by EDP Sciences, under the terms of the Creative Commons Attribution License (http://creativecommons.org/licenses/by/4.0), which permits unrestricted use, distribution, and reproduction in any medium, provided the original work is properly cited.
1. Introduction
The hierarchical growth of cosmic structures dictates that, over time, galaxies become part of increasingly larger systems, such as groups, clusters, and super-clusters, which are connected through cosmic filaments (Press & Schechter 1974; Fakhouri & Ma 2010). We know that the structure and star formation of galaxies in such dense environments are different from those of galaxies that evolve in isolation. Indeed, galaxies with different morphologies are found to preferentially live in different broad areas of a cluster (e.g. spiral galaxies avoid dense cluster cores; Dressler 1980; Poggianti et al. 2009; Vulcani et al. 2023). Moreover, galaxies are also found to stop their star formation in such environments and change their structure along this journey (Vulcani et al. 2010; Prescott et al. 2011; Petropoulou et al. 2012; Haines et al. 2013; Grootes et al. 2017; Kelkar et al. 2017, 2019; Lopes et al. 2016, 2017; Burchett et al. 2018; Greene et al. 2017; Li et al. 2019), which is strong evidence for environmentally driven gas removal processes such as ram-pressure stripping (see reviews by Cortese et al. 2021; Boselli et al. 2022) and galaxy starvation (Larson et al. 1980). Current wide-field galaxy surveys are revealing the complex continuous nature of such large-scale structures around galaxies, which can no longer be classified by the simple “field/isolated” and “cluster” definitions of galaxy environments. Consequently, new studies are reporting that galaxies get “pre-processed” in intermediate environments, such as groups and filaments, which can contribute to their quenching, prior to entering a massive cluster (e.g. Fujita 2004; McGee et al. 2009; Dressler et al. 2013; Bahé et al. 2013; Haines et al. 2015; Jaffé et al. 2016; Kraljic et al. 2018; Vulcani et al. 2019; Kuchner et al. 2022).
The channels of galaxy cluster growth, however, are not limited to infalling galaxies, cosmic filaments, or group accretion but include cumulative explosive megaparsec-scale events such as cluster–cluster mergers. These powerful interactions are rare events that are capable of disturbing the cluster as a whole by heating the intracluster medium (ICM), thus affecting the morphology of the system (see e.g. Caglar & Hudaverdi 2017; Botteon et al. 2018; Caglar 2018). These effects have become beacons for detecting such merging cluster systems through X-ray emission from the hot ICM and through non-thermal processes, such as diffuse synchrotron radio emission in the form of halos (located centrally in a cluster with a history of major interaction; e.g. Kale et al. 2022) and relics (detected towards cluster peripheries; see also the review by van Weeren et al. 2019). While halos generally tell us about ICM turbulence and the dynamic history of clusters, radio relics arise when substantial amounts of kinetic energy are released during cluster merging events (also known as the merger shock). Hence, the presence of such a shock front, observed at times in X-ray emission as well (Akamatsu & Kawahara 2013; Bourdin et al. 2013; Sarazin et al. 2016; Akamatsu et al. 2017; Gu et al. 2019), indicates a very recent (∼3 Gyr) violent dynamic major interaction between galaxy clusters. Only ∼70 radio relics (and < 20 twin or “double” radio relics) have been detected to date (Golovich et al. 2019a; Knowles et al. 2022); their detectability strongly depends on the merger geometry (e.g. plane-of-the-sky mergers; Golovich et al. 2019b), the mass ratio of the participating clusters, the age of the merger, the turbulence decay timescale, and the synchrotron lifetime of decaying electrons (Brunetti & Jones 2014). Furthermore, simulations demonstrate that while the shock propagates for ∼2 Gyr after the collision, the injected turbulence in the ICM continues for at least ∼4 Gyr (Paul et al. 2011). This makes cluster mergers exotic systems with an extreme environment that can potentially leave unique signatures on, or “post-process”, the galaxies within them.
To date, such post-processing signatures have been traced throughout the spread of cluster interactions and the associated growing large-scale structure. Recent comprehensive studies show that generally disturbed clusters undergoing an interaction (such as group accretion, minor merging, etc.) could result in a possibly mild enhancement in the fraction of ram-pressure-stripped galaxies (e.g. Lourenço et al. 2023), generally increased star formation activity (e.g. Cohen et al. 2014), enhanced star formation in barred galaxies (e.g. Yoon & Im 2020), and the presence of a younger active galactic nucleus population (e.g. Bilton et al. 2020). Alternatively, some studies show that interacting clusters present environments that are no different from those of relaxed clusters (e.g. Shim et al. 2011; Kleiner et al. 2014). Major merging clusters that have recently undergone core passage reportedly show evidence of both enhanced star formation (Stroe et al. 2015a, 2015b) and quenching (e.g. Pranger et al. 2014), or a potentially net zero effect on star formation activity (e.g. Chung et al. 2009; Rawle et al. 2014). Moreover, the wider, large-scale structure surrounding these major mergers shows signs of heightened star-forming activity well beyond R200 (Stroe et al. 2017; Stroe & Sobral 2021) or enhanced ram-pressure stripping (Piraino-Cerda et al. 2023). As a consequence, it is difficult to distinguish merger-induced post-processing signatures without knowledge of the cluster galaxy properties prior to the merging event, highlighting the need to account for the overall “cumulative” processing of galaxies (Mansheim et al. 2017; Kelkar et al. 2020, hereafter KK20).
In this paper we attempt to constrain such cumulative environmental signatures, namely the combined effect of the quenching and morphological transformation of galaxies in dense environments, and filter out various post-processing effects on the integrated star formation of galaxies and galaxy morphologies. We present a population study of galaxy properties for three cluster mergers with radio relics – Abell 3667, Abell 3376, and Abell 168 – all of which experienced a major merger over similar times since core collision (TSCs): ∼0.6−1 Gyr. We compare these three mergers to relaxed clusters within a similar redshift range of 0.04 < z < 0.07 and using the same coverage-matched dataset.
The paper is organised as follows: Sect. 2 details the cluster merger sample and galaxy sample we used in this analysis. Thereafter we present our analysis and results, starting from galaxy distributions and morphology fractions in post-merger clusters (Sect. 3), followed by rest-frame galaxy colour–magnitude relations (CMRs) for post-merger and relaxed clusters, and then integrated star formation in post-merger clusters inferred through red and blue fractions (Sect. 4). Finally, we discuss our results, namely how different galaxy populations in cluster mergers really are compared to relaxed clusters without any interactions (Sect. 5). We conclude in Sect. 6. Throughout this paper, we use the standard Λ cold dark matter cosmology (h0 = 0.7, ΩΛ = 0.7, and Ωm = 0.3) and Chabrier (2003) initial mass function.
2. Data
2.1. Cluster sample
We chose our cluster samples because we want to understand galaxy evolution in two extremely different environments – post-mergers1 and dynamically relaxed non-merging clusters – controlling for dynamic specifics as much as possible (e.g. a similar TSC of ∼0.6−1 Gyr in the case of merging clusters). Moreover, the narrow z range of 0.04 < zcl < 0.065 makes this the lowest-redshift uniform cluster sample that spans the most extreme dynamical stages.
We built our homogeneous cluster sample from the OmegaWINGS survey (Gullieuszik et al. 2015; Moretti et al. 2017), which is a photometric survey of 57 galaxy clusters with a spatial coverage of ∼1 sq. deg. (∼2.5 virial radii). Based off the WIde-field Nearby Galaxy-cluster Survey (WINGS; Fasano et al. 2006; Moretti et al. 2014), which comprises 76 clusters, OmegaWINGS provides photometric and imaging data in the U (Omizzolo et al. 2014; D’Onofrio et al. 2020), B, and V bands using the OmegaCAM imager of the VLT Survey Telescope (VST) and spectroscopy for a subsample of 33 of the total 57 clusters using the AAOmega spectrograph at the Anglo Australian Telescope (AAT; Cava et al. 2009; Moretti et al. 2017). Global cluster properties such as the mean cluster redshift, zcl, and the cluster velocity dispersion, σcl, were iteratively determined through 3σ clipping using the biweight robust location and scale estimators (Beers et al. 1990). Galaxies were assigned cluster memberships if they lie within 3σcl of zcl (Moretti et al. 2017), and the physical radius, R200, was provided by Biviano et al. (2017).
We targeted three extreme post-merging galaxy clusters from OmegaWINGS – Abell 3667 (A3667), Abell 3376 (A3376; pilot analysis by KK20), and Abell 168 (A168). To complement this target cluster merger sample, we also defined an ancillary control sample of clusters to isolate merger-induced post-processing signatures in member galaxies. We utilised the control sample originally presented by KK20, who visually inspected the X-ray images from the XMM-Newton telescope to look for signatures of interaction through X-ray surface brightness disturbances. We also included clusters that were identified as dynamically relaxed through a systematic analysis of dynamical stages of WINGS and OmegaWINGS clusters performed by Lourenço et al. (2023, hereafter L23) using optical information from WINGS/OmegaWINGS and X-ray data from the Chandra and/or XMM-Newton. Specifically, they used the positions of the brightest cluster galaxy(s) with respect to the X-ray peak, the morphology of the X-ray surface brightness distribution (e.g. concentrated, asymmetric, or presence of secondary peaks), and the detection of radio relics from the literature to identify a dynamical state sequence for the galaxy clusters. The final dynamic state classifications were thus “pre-merger” (1), “relaxed” (2), “mildly interacting” (3), “interacting” (4), and “post-merger” (5). This classification of cluster dynamical states also recovers the control cluster sample of KK20, except for one cluster. Thus, our final control cluster sample in this work consists of a total of seven OmegaWINGS clusters (0.04 < zcl < 0.065); these seven were either classified as “relaxed” (2) or were “mildly interacting” (3) clusters that show a concentrated X-ray surface brightness distribution with mild optical and/or X-ray substructures but without obvious interaction features in the ICM (e.g. ICM sloshing). Figure 1 summarises our cluster samples as a function of cluster velocity dispersion (σcl) and cluster redshift (zcl), and Table B.1 lists the global cluster properties of the samples. We describe each of the post-merger clusters in the following.
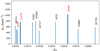 |
Fig. 1. Summary of the post-merger sample (thick bars annotated in red) and the relaxed control cluster sample (thin bars annotated in black) as a function of cluster redshift and velocity dispersion. |
A3667 (Fig. 2; top-left panel) is one of the most massive and complex merger systems in this sample, with M500 = 7.04 ± 0.05 × 10¹⁴ M⊙ 2. It shows evidence of recent major merging activity through the presence of twin radio relics, with a bridge in between (Carretti et al. 2013), and disturbed X-ray emission with cold fronts (Knopp et al. 1996; Mazzotta et al. 2002; Briel et al. 2004; Nakazawa et al. 2009; Finoguenov et al. 2010; Sarazin et al. 2016). While the exact merger dynamics of A3667 are yet to be constrained, recent studies such as Sarazin et al. (2016) propose a timeline of ∼1 Gyr since the off-axis pericentric passage of two equally massive systems occurring in the plane of the sky. They also corroborate the merger shock being located at the outer edge of the stronger relic in the system (ℳ ∼ 2.5), with a possible detection of another X-ray shock front (ℳ ∼ 1.8) by the weaker relic (Storm et al. 2018). The most detailed view of the radio relics in A3667 using the MeerKAT Galaxy Cluster Legacy Survey (MGCLS; Knowles et al. 2022) reveals a filamentary substructure in the stronger relic (de Gasperin et al. 2022). Other follow-up investigations have included the characterisation of magnetic fields through the radio mini-halo coinciding with one of the brightest cluster galaxies (BCGs; Riseley et al. 2015), gamma-ray observations (Kiuchi et al. 2009), and optical weak-lensing studies (Joffre et al. 2000).
A3376 (Fig. 2; middle-left panel) is one of the most well-studied extreme post-merger systems in the literature, with M500 = 2.4 ± 0.2 × 10¹⁴ M⊙2. It displays double relics and asymmetric X-ray emission (Bagchi et al. 2006; Kale et al. 2011; Durret et al. 2013; Chibueze et al. 2021, 2023). The merger timescale for A3376 is ∼0.6 Gyr since pericentric passage, the shock front of which gave rise to a stronger (ℳ ∼ 2.8; vs = 1630 km s−1) and a weaker relic (ℳ ∼ 1.5, vs = 1450 km s−1; Bagchi et al. 2006; Kale et al. 2012; Akamatsu et al. 2012; George et al. 2015; Urdampilleta et al. 2018). Simulations (Machado & Lima Neto 2013) have constrained the plane-of-the-sky merger scenario with a very low impact parameter (a few kiloparsecs) and a mass ratio of 3:1. Weak-lensing studies, however, reveal a more complex merging system, with a third infalling group (Monteiro-Oliveira et al. 2017).
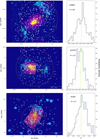 |
Fig. 2. Galaxies in the post-merger cluster sample. Left: spatial distribution of our spectroscopic galaxy sample (open white circles) of the three post-merger clusters in our cluster sample (labeled in the right-hand panels). BCGs are marked with open green squares and the centre of the system by a red star, both of which are adopted from L23. The extended blue contours denote the radio relics detected using 1280 MHz data from the MGCLS (Knowles et al. 2022) for A3667 and A3376, and 170−230 MHz continuum data from the GaLactic and Extragalactic All-sky MWA (GLEAM) survey (Wayth et al. 2015) for A168. The underlying image represents the cluster X-ray emission determined using the publicly available Chandra X-ray data, with black plus signs indicating the peak X-ray emission. The overlay of the dotted circle indicates an aperture of 0.9 R200. Right: spectroscopic z distribution of the galaxy sample and BCGs (vertical green line). The red peaks indicate the Gaussians fitted to the observed z distribution, and N denotes the number of spectroscopic members in each cluster. |
A168 (Fig. 2; bottom-left panel) is the lowest-mass cluster (M500 = 1.9 ± 0.2 × 10¹⁴ M⊙2) with a radio relic detection (Dwarakanath et al. 2018) and a radio halo with the least power discovered to date (Botteon et al. 2021). It shows an X-ray cold front (Hallman & Markevitch 2004) and two X-ray peaks detected in Chandra data by Yang et al. (2004). They further speculate an off-axis merger with a mass ratio of 1:1−3 and a shock speed of 600 km s−1, setting the merger age at ∼0.6 Gyr.
In summary, although our post-merger cluster sample covers a wide range of cluster masses, it is homogeneous not only with respect to the dynamical states of clusters but also with respect to the merger timescales (TSC ∼ 0.5 − 1 Gyr). The homogeneity of the sample is crucial for resolving conflicting inferences drawn from individual cluster merger studies from the literature and hence for attempting to generalise galaxy post-processing in cluster mergers.
2.2. Galaxy sample
The primary goal of this study is to investigate integrated star formation properties through galaxy colours and link them to the merger history of the clusters in the last ∼1 Gyr. Our base galaxy sample throughout this paper comprises all the galaxies with OmegaWINGS spectra.
We used updated B- and V-band magnitudes from the OmegaWINGS photometry recomputed with morphology-dependent K corrections (Vulcani et al. 2022). Galaxy stellar masses were obtained as one of the data products of SINOPSIS3 (SImulatiNg OPtical Spectra wIth Stellar population models; Fritz et al. 2007, 2017), which reproduces the observed spectra using theoretical spectra of simple stellar population models of 12 different ages – from ∼106 yr up to the age of the Universe at the galaxy’s redshift. We used stellar mass definition number 2 (see Longhetti & Saracco 2009) from the updated SINOPSIS outputs by Pérez-Millán et al. (2023, hereafter PM23) obtained at cluster redshifts and using the Chabrier (2003) initial mass function, which includes stars in the nuclear-burning phase and remnants but takes mass losses due to stellar evolution into account. This paper also presents one of the first comparative galaxy morphology demographics in cluster mergers, adding to the qualitative results from KK20 for A3376. We used T-type galaxy morphologies computed by the tool MORPHOT, which uses a combination of 21 morphological diagnostics (derivable from imaging data), machine learning, and neural networks (Fasano et al. 2012). We broadly binned these T-type morphologies into three classes: ellipticals (E; −5.5 < TM < −4.25), lenticulars (S0; −4.25 ≤ TM ≤ 0), and spirals (Sp; 0 < TM ≤ 11; Vulcani et al. 2023).
We also statistically accounted for the fact that not all galaxies detected in the images have a spectroscopic counterpart, and we corrected for both radial (geometrical) C(r) and magnitude C(m) completeness (Cava et al. 2009; Moretti et al. 2017). This was done by weighting the properties of each galaxy by the product of the inverse of the two completeness values. Finally, we applied a stellar mass completeness limit of Log(M*/M⊙) = 9.48 (corresponding to an absolute V-band magnitude brighter than MV = −18 mag) and an additional radial cut of 0.9 R200 for computing fractions to account for the different radial coverage for OmegaWINGS clusters (for more details, see L23). This radial cut roughly corresponds to the circumference of the post-merger shock front – indicated by the radio relics – presently observed for all three cluster mergers. Hence, limiting the galaxy sample to this radius also ensures we are looking at the majority of the galaxies that are affected by the outgoing shock front, even though we would be sampling infalling galaxies (projection effects) and galaxies whose orbits have been modified by mergers. We reiterate that this sample presents updated galaxy morphologies and improved integrated magnitudes compared to those presented in KK20 for A3376 but that these changes do not affect the KK20 results. Lastly, we used the Wilson (1927) binomial confidence interval to compute the 1σ uncertainty in the fractions presented throughout this paper.
2.3. Galaxy distribution in a post-merger cluster
A dynamically relaxed galaxy cluster displays a distinct distribution of galaxies: passive galaxies are most commonly found in dense cluster cores, whereas star-forming galaxies prefer the relatively less dense cluster outskirts (Gray et al. 2004; Gavazzi et al. 2010; Peng et al. 2010; Weinmann et al. 2010; Prescott et al. 2011; Wetzel et al. 2012; Haines et al. 2013; Davies et al. 2016, 2019; Grootes et al. 2017; Owers et al. 2019). This gets translated into the observed morphology–density relation, with galaxies showing early-type morphologies preferring dense cluster regions (Dressler 1980; Treu et al. 2003; Blanton et al. 2005; Bamford et al. 2009; Skibba et al. 2009; George et al. 2013; Houghton 2015; Fasano et al. 2015; Brough et al. 2017; Greene et al. 2017; Oh et al. 2018). A major interaction between galaxy clusters is a disruptive event in which the ICM interacting with the merging halos can result in a cluster-wide redistribution of galaxies. Furthermore, the presence of more than one radio relic indicates a major plane-of-the-sky merger, suggesting an approximate mass ratio of at least ∼1:3 (van Weeren et al. 2019).
We investigated the observed distribution of the galaxies as a function of both relic positions (and hence the shock-front position) and the BCG4 location in each of the three post-merger clusters, A3667, A3376, and A168 (left panel in Fig. 2). We adopted the definition of the “centre” of the post-merger system from L23 and took the midpoint between the first BCG and the galaxy coincident with the X-ray peak. The choice of these galaxies takes into consideration the characteristic asymmetrical X-ray emission often observed in merging clusters and most often associated with the core of the displaced subcluster. An in-depth discussion about the definition of cluster centres and BCGs for the three cluster mergers is presented in L23. Spatially, A3667 and A3376 show fairly unimodal but elongated galaxy distributions that possibly align with the axis of the merging event and with the axes of the two radio relics. This is corroborated by KK20 (and the references within), who constrained the merger dynamics for A3376 through simulations and weak-lensing analyses. The galaxy distribution of A168, however, is somewhat perpendicular to the direction of the BCGs and the relic.
Further insights are provided by the z distribution (right panel in Fig. 2), which shows distinct peaks for A3667 (indicating a close encounter with a non-negligible impact parameter), a broad peak for A3376, and a redshift distribution mimicking a relaxed cluster for A168. Except for A3667, the z distribution for each of our clusters can be fitted by double Gaussian peaks but with minimal separation. This qualitatively corroborates a close encounter between galaxy clusters that leads to a unimodal distribution of galaxies, which was perhaps more disruptive to the galaxy distribution in A168 compared to that in the other cluster mergers. This is not surprising since A168 has a relatively low mass for a major merger. Furthermore, we also corroborate a headlong collision between two massive halos for A3376 that had previously been confirmed through simulations. We performed a Shapiro-Wilk normality test (Shapiro & Wilk 1965) under the null hypothesis that the observed z distribution for each of the clusters is drawn from a Gaussian distribution. Out of the three cluster mergers, only A3667 yields a Shapiro-Wilk p value of 0.057, indicating a possible non-Gaussian distribution of galaxies. We also performed a Hartigan’s dip test (Hartigan & Hartigan 1985) under the null hypothesis that the observed z distribution for each of the clusters is unimodal. With neither of the clusters yielding a p value < 0.05, we can conclude that all three post-mergers have a unimodal z distribution. Thus, even if we are sampling merging events with similar TSCs, it is evident that the masses of the merging halos together with the dynamics play an important role in the final configuration of the whole merging system.
3. Galaxy morphology fractions as a function of the post-merger cluster environment
We split the different morphologies into classes as defined in Sect. 2.2 and present their spatial distribution in Fig. 3. The over-densities of ellipticals in the merging subclusters appear to be relatively undisturbed in A3667. The picture is the opposite, and somewhat extreme, for A168, where elliptical galaxies – however low in number – appear to be situated along the line joining the relic with BCGs and also perpendicular to it. This trend is mirrored in the S0s of A168, while A3667 shows an elongated or narrow S0 distribution without individual over-densities. Spiral galaxies, on the other hand, display a very narrow flat distribution (akin to S0s) in A3667, while the clusters A3376 and A168 show a wider spatial distribution for spirals. However, it should be noted that the spatial distribution of spiral-type galaxies would be greatly affected by projection effects and the fact that we would be sampling extra cosmic web.
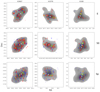 |
Fig. 3. Spatial distribution of galaxies for each of the morphologies – ellipticals (top), lenticulars (middle), and spirals (bottom) – from the primary spectroscopic sample. Each panel shows the overall density contours for the distribution of each morphology type, split into red and blue galaxies according to the selection criteria discussed in Sect. 4. The faint markers indicate galaxies beyond 0.9 R200, which have been excluded from the quantitative analysis presented in this paper. As in Fig. 2, we show the BCG (open green square), system centre (white star), X-ray peak (white plus sign), and approximate location of radio relics (orange crosses). |
Morphology fractions give us important clues regarding not only the build-up of cluster galaxy populations over time (z dependence) but also plausible cluster environment-specific processes that could lead to morphological transformations of galaxies (depending on global cluster properties; e.g. Desai et al. 2007; Poggianti et al. 2009; Vulcani et al. 2011a,b; Calvi et al. 2012). We revisited the morphology fractions under post-processing due to cluster mergers (Fig. 4) and examined fractions of E, S0, and spiral galaxies as a function of σcl (and hence the cluster-mass range of our sample) and cluster X-ray luminosity (LX). We further separated our post-merger cluster sample (grey filled markers) from the relaxed cluster control sample (open symbols). We quantified the comparison using average fractions for the entire post-merger (denoted as solid coloured lines) and the control cluster sample (denoted as solid black lines) with 1σ error limits (dotted lines) for each morphology type. These plots recreate the results from Poggianti et al. (2009), who used the entire WINGS sample but with a cut in absolute V-band mag (< − 19.5) and aperture (0.6 R200), and PM23, who extended it to include the entire OmegaWINGS cluster sample with the same limits. We reiterate that we used a mass-complete spectroscopic sample within a fixed 0.9 R200 aperture to compute the morphology fractions.
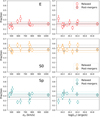 |
Fig. 4. Fraction of galaxies of each morphology as a function of σcl (left) and X-ray luminosity (LX; right). Filled grey symbols indicate the clusters in the post-merger cluster sample. The solid coloured and black lines denote the average fractions in the post-merger and control cluster samples, respectively, with errors represented by the corresponding dashed lines. The cluster mergers have the same average fraction of spirals as the seven relaxed clusters, where the average is dominated by the scatter in the fractions. |
This work is one of the first studies to explore morphological fractions in clusters that are characterised by profoundly different dynamical states and growth histories. Even though our primary cluster sample comprises only three post-merging systems, we demonstrate that the fractions of Es and S0s remain unchanged irrespective of the dynamic stage of our sample or the range of σcl or LX. Consequently, we report constant fractions of spirals that are similar in post-mergers (0.34 ± 0.04) and relaxed clusters (0.27 ± 0.04). However, the spiral fraction in relaxed clusters shows considerable scatter with respect to both σcl and LX, making their fraction inconclusive and not allowing a direct comparison with that of post-merger clusters. The constant spiral fraction for post-merger clusters demonstrates a fairly mixed population of spiral galaxies, now accreted in the post-merger systems as a part of either the original merging subclusters or the extended cosmic web. A detailed comparison as a function of cluster-centric radius or projected phase-space, however, is not possible as the system centres of merging clusters are not exactly equivalent to the centres of relaxed clusters. Nevertheless, this mixed population poses new challenges to our understanding of the morphological evolution of cluster galaxies due to probable post-processing by the extreme dynamical galaxy environment.
4. Galaxy colours: Integrated star formation properties of galaxies in post-merger clusters
We used galaxy colours as a measure of integrated star formation and divided our spectroscopic sample into red and blue galaxies. This provided a general picture of the recent star formation in post-merger clusters. Their comparison with the expected trends in relaxed clusters would confirm whether or not cluster-merging activity influences the star formation properties of galaxies.
4.1. Colour–magnitude relation of merging clusters
To identify red and blue galaxies, we used the extended OmegaWINGS spectroscopic sample compiled by Vulcani et al. (2022), which includes extra spectroscopic redshifts from the literature. We (i) constructed a rest-frame (B − V)0 CMR individually for each cluster merger, (ii) fitted the red sequence (RS) for the entire sample irrespective of galaxy morphology, and (iii) used a boundary of 1σ below the RS to select red (those lying above this boundary) and blue (below this boundary) galaxies. We repeated this procedure for the control cluster sample and used individual RS fits to take cluster-to-cluster variation into account.
For the RS fitting, we fitted a double-Gaussian to the distribution of (B − V)0 colour in four V0 magnitude bins (Piraino-Cerda et al. 2023; see also Crossett et al. 2017). The RS was then defined by a linear fit across the four peaks of the redder Gaussians in each of the four magnitude bins, and the average scatter of each cluster was taken as the standard deviation, σ. Figure 5 shows the CMRs for A3667, A3376, and A168 along with the RS fit parameters of slope (m), intercept (c), and standard deviation (σ). The CMRs for control clusters are presented in Appendix A. We note that while they have been improved thanks to updated magnitudes and K correction, they are still directly comparable to those presented in Valentinuzzi et al. (2011) but over the OmegaWINGS field of view.
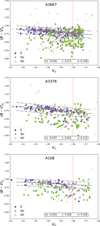 |
Fig. 5. CMR for A3667, A3376, and A168 using the OmegaWINGS photometric sample (grey filled circles). Overplotted are galaxies in the extended spectroscopic galaxy sample (Vulcani et al. 2022) with MORPHOT T-type morphologies. The dash-dotted line represents the 1σ above and below the fitted RS (solid), and the vertical dotted red line indicates the V-band magnitude limit (V0 = −18) corresponding to the spectroscopic mass-completeness of log(M*/M⊙) = 9.48. The inset box indicates the slope (m), intercept (c), and standard deviation (σ) of the linear fit to the RS. |
From Fig. 5, it is clear that A3667 has a densely populated RS contributed by the massive merging subclusters. For A3376, we present a direct improvement to the CMR presented in KK20 thanks to updated magnitudes and hence updated RS fitting. A168, the lowest-mass cluster merger, clearly shows a RS “in progress”, especially at magnitudes brighter than V0 = −18.5. We also compared the m and σ of post-merger and relaxed cluster samples (Fig. 6). We find that all three post-merger clusters show less variation in their m and σ than the relaxed clusters. For the control relaxed cluster sample, the minimal scatter in σ could highlight the different formation histories of the clusters, with some of them being young and still building their RS.
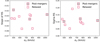 |
Fig. 6. Slope of the RS (m) as a function of σcl (left) and the scatter of the RS (σ) as a function of σcl (right). Filled grey symbols indicate the post-merger cluster sample. Relaxed and cluster mergers show similar slopes and scatters. |
4.2. Blue fraction in merging clusters
The existence of a galaxy population in transition has long been considered proof of delayed environmental effects impacting galaxy structure and star formation on different timescales. Indeed, studies have found that galaxy clusters host non-negligible populations of red passive spirals; this is evidence that cluster-specific physical mechanisms such as ram-pressure stripping quench star formation while leaving the galaxy structure intact (e.g. Bamford et al. 2009; Kelkar et al. 2017; Bremer et al. 2018). Upon a major cluster merger, however, galaxies further undergo environmental “post-processing” as a result of energetic dynamic activity, which could lead to further changes in the star formation of galaxies already affected by the dense cluster environment before cluster–cluster merging.
We started by exploring blue fractions in post-merger clusters, which had never before been explored directly in comparison to the relaxed cluster environment. Figure 7 compares the fraction of blue galaxies (all morphologies) in the three post-mergers and the seven relaxed clusters, in two stellar mass bins, computed within a fixed aperture of 0.9 R200. The mass bins were selected based on the median stellar mass of the blue galaxies in our entire post-merger+relaxed cluster sample – which is dominated by spiral galaxies – because they show similar stellar mass distributions irrespective of the cluster dynamical stage (Fig. B.1).
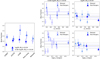 |
Fig. 7. Blue fraction as a function of the cluster dynamical state, in two mass bins. Left: average blue fraction as a function of the cluster dynamical state, in two mass bins. Right: blue fraction as a function of σcl (top) and LX (bottom) for each of the two mass bins. The solid and dotted black and blue lines represent the average fractions with 1σ errors for relaxed and cluster mergers, respectively. The blue fractions, dominated mostly by spiral galaxies, are similar in post-mergers and relaxed clusters for the lower-mass bin. Moreover, the blue fractions as a function of global cluster properties remain constant within 1σ errors for post-mergers. The relaxed clusters, on the other hand, show a lot of scatter in the blue fractions as a function of σcl and LX. |
Figure 7 (left panel) shows that the average blue fractions in post-mergers are comparable to those in relaxed clusters throughout the stellar mass range. However, the average blue fraction for post-mergers appears to be dominated by the excess of blue galaxies in the lower stellar mass bin for A168 and the lack of high-mass blue galaxies in A3667. The blue fractions for relaxed clusters as a function of global cluster properties such as σcl and LX (Fig. 7b) show significant scatter, especially in the lower-mass bin. This prevents us from confirming whether the elevated blue fraction in A168 is a post-processing signal. This also calls attention to the cluster-to-cluster variations within the cluster merger sample and highlights the biases that may be introduced in single-cluster case studies. For example, the analysis of A3376 by KK20 concludes that the star formation in A3376 appears to be comparable to that in relaxed clusters, which can also be indirectly concluded from Fig. 7a. Taken together with the constant fraction of spirals in post-merger clusters (Fig. 4), the average comparable blue fractions for post-merger and relaxed clusters could suggest a levelling of galaxy colours from the newly accreted galaxies, now part of the post-merger system (see also Mulroy et al. 2017).
We next inspected the spatial distribution of the galaxies comprising the blue fraction and the red galaxies separated by broad morphologies for all three cluster mergers. Figure 3 highlights the galaxies within 0.9 R200 to enable a direct association with the blue fractions. We note that the majority of the red early-type galaxies (E or S0) in all three cluster mergers follow the general direction along the line joining the approximate relic positions with the BCGs, with the exception of the red ellipticals in A168 (see Sect. 3). Spirals, irrespective of their colours, appear to be widely distributed. We thus conclude that red and blue galaxies in post-merger clusters do not demonstrate any spatial preference. However, we reiterate that obtaining accurate phase-space information for merging clusters is difficult due to extra projection effects and the merger configuration.
4.3. Red spirals in cluster mergers
Another signature of the pre-merger cumulative environment in post-merger cluster systems is the incidence of red or passive spirals in clusters, which KK20 proposed qualitatively in their pilot study using A3376. We tested this quantitatively by looking at the fraction of red spirals in all three cluster mergers (i.e. the number of red spirals/total number of spirals) and comparing them to that in the relaxed clusters (Fig. 8). The red spirals were selected as those above the RS–1σ boundary, individually for each and every cluster. On average, the post-mergers show a similar fraction of red spirals compared to that in the relaxed clusters, except for A3667, which shows a marginally higher fraction than the average for the relaxed clusters. However, this average fraction of ∼45% for relaxed clusters is at least twice the fraction observed by Valentinuzzi et al. (2011) of ∼20%, who used the entire WINGS cluster sample but with photometric galaxy memberships and smaller spatial coverage.
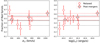 |
Fig. 8. Fraction of red spirals as a function of σcl and LX, separated into a relaxed cluster sample (red open diamonds) and a merging cluster sample (filled grey diamonds). The solid black and red lines indicate the average fraction for relaxed and merging clusters, respectively. The dotted lines correspond to the 1σ error for each respective sample. A3667 has a marginally higher fraction of red spirals compared to relaxed clusters. |
Edge-on spirals can also display red colours due to dust attenuation, which we have not controlled for in either of our samples. However, a basic visual check using publicly available Legacy Survey Data Release 10 (Dey et al. 2019) images shows that there is a comparable fraction of nearly edge-on spirals in both samples (∼10%). We do note a higher incidence of red spirals with a smooth disk (no prominent spiral arms; see also Kelkar et al. 2017), especially in A3667, compared to a general mixed collection of late-type spirals with strong bulges or smooth disk galaxies with possible S0 morphologies or barred galaxies across both the post-merger and relaxed cluster red spiral sub-samples. This highlights that the S0 versus spiral classification is not a clean dichotomy and that contamination of either morphological sample can occur, especially when considering such a galaxy population in transition. We further confirm a mean inclination of ∼48° for the red spirals in both our cluster samples (Fig. B.2), computed using the axis ratios from the OmegaWINGS B and V photometry catalogue (Gullieuszik et al. 2015).
Optically passive or red spirals have been encountered in clusters at both low-z (e.g. Wolf et al. 2009; Valentinuzzi et al. 2011; Vulcani et al. 2015) and intermediate z (Sánchez-Blázquez et al. 2009; Kelkar et al. 2017). Studies such as Bamford et al. (2009) show a higher variation in the fraction of cluster red galaxies than in the fraction of cluster early-type galaxies (ETGs), indicating that galaxies retain their spiral morphologies while turning red or passive. All these findings support a rapid, physical gas removal process (e.g. ram-pressure stripping or thermal evaporation) for the quenching of star formation with a delayed morphological transformation (see also Lopes et al. 2016; Mahajan et al. 2020). While optical colours could indicate passivity, studies such as Wolf et al. (2009) found these optically passive red spirals at z ∼ 0.17 to have substantial star formation rates, albeit lower than those of cluster blue spirals, and predominantly incident within 10 < log M*/M⊙ < 11. For cluster mergers, however, this would form the pre-merger cumulative environmental influence as a result of galaxies already in high-density environments before the cluster merging activity and hence would be a major contributor to the observed trends in the red spirals in our merging cluster sample. On the other hand, the hydrodynamic changes in the environment post cluster merger could lead to accelerated quenching, rendering the member galaxies passive.
However, a deeper understanding of the stellar ages of these odd red spirals in both post-merger and relaxed clusters is essential in order to confirm the origin of such populations (effect of a cumulative cluster environment or merger-driven) and the plausible physical processes involved with the timescales over which they are observable (Kelkar et al., in prep.).
4.4. Blue ETGs in merging clusters
Believed to be a class of evolved spirals, lenticular galaxies in both cluster and field environments result from multiple formation pathways (Johnston et al. 2021). Structurally, they are characterised by a prominent bulge with a fading disk and older stellar populations, though they have been found to be a lot more complex than this (e.g. Johnston et al. 2022). This makes them key to our understanding of the transformation of spiral galaxies in high-density environments (see also Jaffé et al. 2011). Extending the analysis to general ETG population, studies such as Bamford et al. (2009) show that blue ETGs are low-mass galaxies preferentially located in low-density environments. We explored the fractions of blue ETGs, encompassing S0s and Es in our sample, in both merging and relaxed cluster environments.
Post-merger clusters seem to host a minor but significant population of blue ETGs (0.14 ± 0.04). Such a blue ETG population is minimal for the majority of the relaxed clusters in our sample (Fig. 9), with the exception of A3560 (0.18 ± 0.03) and A151 (0.27 ± 0.05). These observations provide insights into the origins of such exotic populations in merging clusters. The bluer colours of early-type morphologies such as S0 could simply indicate rejuvenated star formation due to enhanced galaxy interactions, which the large-scale merging activity could enable. For example, Johnston et al. (2014) find bulges of S0s in Virgo and that Fornax clusters host younger stellar populations (see also Jaffé et al. 2014). On the other hand, the general blue ETG population may be introduced in the merging cluster systems through the extended cosmic web (e.g. filaments). This is supported by the higher fraction of blue ETGs for A3560, which, despite showing characteristics of relaxed clusters, is part of the broader Shapley Supercluster system and hence connected with the cosmic web network. Furthermore, Dhiwar et al. (2023) find that blue ETGs with Milky Way-like stellar masses (log M*/M⊙ ∼ 10) reside in low-density environments, making them a probable population of the cosmic filament-like environment now observed as a part of the newly forming post-merger system. Despite lacking specific stellar population information for these galaxies, our forthcoming follow-up work (Kelkar et al., in prep.) explores this through luminosity-weighted ages in the central regions of these galaxies.
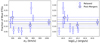 |
Fig. 9. Fraction of blue ETGs as a function of σcl and LX, separated into a relaxed cluster sample (blue open circles) and a merging cluster sample (filled grey circles). The solid black and blue lines indicate the average fraction for relaxed and merging clusters, respectively. The dotted lines correspond to the 1σ error for each sample. Merging clusters show a constant fraction of blue ETGs, while the fraction of blue ETGs varies considerably in the relaxed clusters. |
5. Discussion
This comparative analysis is geared towards bridging the gap between (i) individual cluster studies that look at the effects of merger hydrodynamics (e.g. merger shock) on star formation properties on different timescales and (ii) cluster population studies that encapsulate varied cluster dynamical ages observable over a few gigayears to collectively infer the effect on galaxy evolution in extremely violent environments. Our explorations into the morphology fractions and galaxy colours within three young post-merger systems reveal a complex effect of the cumulative environment prior to the major merger.
Dynamically young merging cluster systems are expected to be located at extreme cosmic web nodes, engulfed by the dense large-scale environment of cosmic filaments feeding into the merging system. By construction, therefore, these systems are expected to be highly evolved with respect to their galaxy populations. We find evidence of this through the analysis of CMRs; the post-merger clusters in our sample show constant scatter, suggesting that RS galaxies were already in place prior to such large-scale interactions. The variation in the blue fraction of relaxed clusters further proves that the comparison control sample is in fact an assortment of clusters with different global star formation histories. On the other hand, simulations of cluster mergers have already demonstrated that the notch-like features at the outer edge of the post-merger shock – observed in both A3667 and A3376 – are likely indications of the shock front interacting with the attached filament network surrounding the merging cluster system (Paul et al. 2011). The cosmic web network surrounding merging cluster systems would also result in a significant influx of new galaxies in the post-mergers, in addition to the global redistribution of galaxies taking place throughout the merging event. The constant fraction of spiral galaxies encountered in merging clusters, the levelling of blue fractions, and the incidence of exotic populations such as blue ETGs could be a result of this. Our study also indicates that post-merger cluster systems with radio relics are unique systems that can be used to explore such galaxy populations in filaments.
Galaxy transformations on longer timescales add an interesting arc to the story of the post-processing of galaxies in post-merger clusters. The general incidence of red spirals in both relaxed and post-merger clusters is likely a result of the cumulative pre-merger environment. However, the variation in galaxy properties presented by dynamically relaxed clusters limits our ability to identify and confirm any possible post-processing signal these cluster mergers demonstrate, such as the elevated and suppressed blue fractions in A168 and A3667, respectively, and the elevated red spiral fraction in A3667. Studies such as Im et al. (2002) demonstrate that galaxies with smooth morphologies can take ≥1 Gyr to turn red following a starburst. Physically, this 1-gigayear timescale could therefore be too short to identify the immediate effects of merger hydrodynamics on the colour and structural transformation of galaxies, as opposed to direct star formation measured in galaxies. Either way, our study underlines the crucial importance of accounting for the cumulative environmental influences galaxies would likely be subject to when hunting for galaxies directly affected by a major cluster merger. This could potentially have biased previous observations that report enhanced star formation in cluster mergers with radio relics (e.g. Ferrari et al. 2006; Sobral et al. 2015; Stroe et al. 2017; Stroe & Sobral 2021) while lending support to any “excess” in star formation rates being attributed to freshly accreted galaxies (e.g. Chung et al. 2010).
The uniformly matched coverage of 0.9 R200, while being small for the typical physical scale of post-merger clusters, gives our study two unique benefits: (i) it targets the central merging body of the system while approximately covering the area within shock fronts, ensuring their connection to the plausible post-processing signatures, and (ii) it allows for a statistical comparison of the two cluster samples across the same physical region. This approach differs from similar studies, specifically Stroe & Sobral (2021), who explored the wider infalling environment, and Mansheim et al. (2017), who utilised the super-field as a comparison dataset for the galaxies in the Musket Ball cluster.
Lastly, our analysis is not devoid of caveats, namely (i) projection effects will always play a role even if the configuration of post-merger clusters with radio relics will almost always be in the plane of the sky, and (ii) these systems have not dynamically coalesced into a single final system, making it difficult to take advantage of quantitative cluster galaxy distributions such as the projected phase-space and local density measures. Redefining the centres of cluster mergers is a step in this direction, which no literature study involving post-merger clusters with radio relics and their effects on galaxies’ star formation had before attempted. Time-sensitive stellar diagnostics would thus be the key to further targeting any plausible signal of post-processing and consequently identifying the specific merger-related hydrodynamical processes involved, which will be explored in follow-up work (Kelkar et al., in prep.).
6. Conclusions
We have presented a detailed analysis of galaxy morphologies and colours in three nearby (0.04 < z < 0.07) young (∼0.6−1 Gyr) post-merger cluster systems – A3667, A3376, and A168 – and seven complementary relaxed clusters. Exploiting the spectroscopic and photometric data from OmegaWINGS, we have presented the complex nature of the cumulative environmental effects leading up to the merging event through exotic cluster populations, such as red late-type and blue ETGs. Our primary conclusions so far are:
-
Galaxies from all three post-merger clusters show spatial distribution, implying that the major merging event has resulted in a unimodal z distribution and an elongated spatial galaxy redistribution in A3667 and A3376 but disrupted the low-mass cluster A168.
-
We present the first morphology fractions in cluster mergers with radio relics that show similar fractions of Es and S0s compared to relaxed clusters. Spiral fraction in relaxed clusters, however, show significant scatter, which is absent in cluster mergers, suggesting a uniformly mixed spiral galaxy population with possible extra influx of galaxies from the surrounding cosmic web.
-
The CMRs are independent from the cluster dynamic state; the post-merger clusters show a RS with a near-constant scatter, similar to relaxed clusters.
-
Post-mergers and relaxed clusters show similar blue fractions, albeit it with a lot of variation for relaxed clusters.
-
Both post-merger and relaxed clusters host considerable populations of red spirals, thus linking their origin to the cumulative pre-merger cluster environment.
-
The blue ETG population is characteristic of cluster mergers and relaxed clusters with known denser large-scale structure connections.
In summary, our results suggest that newly assembling cluster systems that experienced a recent (∼1 Gyr) extreme major interaction are, by construction, evolved systems with a uniform morphology and uniform colour fractions across their member galaxies irrespective of the masses of the newly forming cluster system. By restricting our study to clusters that show no obvious interaction (major or minor), the general scatter in the colour and morphology properties of the member galaxies brings to light different global star formation histories for such non-interacting relaxed clusters. We find no clear evidence of post-processing in galaxy colours due to a major cluster merger event, beyond what is expected from our understanding of galaxy evolution in high-density or “cluster” environments. We further propose that the ∼1 Gyr timescale could be too short and thus not allow us to detect observable effects in the global colours of galaxies. We also feature merging clusters as unique systems to identify and study filament galaxy populations owing to the extra influx of the cosmic web throughout the merging process. Being the first uniform and spatially matched study to directly compare galaxy populations in very young merging clusters with non-merging ones, our study presents new opportunities and challenges in the field of galaxy evolution in extreme cluster-merger environments.
Throughout this work, “post-mergers” are defined as systems that have undergone a major merging event, which includes a recent core passage, and are currently in the process of reaching maximum separation before coalescing into a single system. They have at least one radio relic, and their TSC has been confirmed through radio and, if available, X-ray studies. However, except for A3376 (see Sect. 2.1), we have not yet ascertained the precise merging dynamics of the other clusters using simulations.
Sunyaev–Zeldovich masses obtained from the Planck Union Catalog (Planck Collaboration XIII 2016).
In this work we define the BCG as the first brightest galaxy in the system as identified by L23, which may not necessarily coincide with the central galaxies of the merging subclusters.
Acknowledgments
K.K. acknowledges full financial support from ANID through FONDECYT Postdoctrorado Project 3200139, Chile. A.C.C.L. thanks the financial support of the National Agency for Research and Development (ANID)/Scholarship Program/DOCTORADO BECAS CHILE/2019-21190049. Y.J. and A.C.C.L. acknowledge financial support from ANID BASAL project No. FB210003 and FONDECYT Iniciación 2018 No. 11180558. J.F. and D.P.M. acknowledge financial support from the UNAM-DGAPA-PAPIIT IN110723 grant, Mexico. B.V. acknowledges the financial contribution from the grant PRIN MIUR 2017 n.20173ML3WW_001 (PI: Cimatti). B.V. acknowledges support from the INAF Mini Grant 2022 “Tracing filaments through cosmic time” (PI: Vulcani). J.P.C. acknowledges financial support from ANID through FONDECYT Postdoctorado Project 3210709. K.K. also thanks Arianna Cortesi and Boris Haußler for helpful science discussions. We also thank the Referee for their valuable feedback on this work. MGCLS data products were provided by the South African Radio Astronomy Observatory and the MGCLS team and were derived from observations with the MeerKAT radio telescope. The MeerKAT telescope is operated by the South African Radio Astronomy Observatory, which is a facility of the National Research Foundation, an agency of the Department of Science and Innovation. This research has made use of data obtained from the Chandra Data Archive and the Chandra Source Catalog, and software provided by the Chandra X-ray Center (CXC) in the application packages CIAO and Sherpa. This research made use of TOPCAT, an interactive graphical viewer and editor for tabular data (Taylor 2005). This research made use of Astropy (http://www.astropy.org), a community-developed core Python package for Astronomy (Astropy Collaboration 2018). This research made use of ds9, a tool for data visualisation supported by the Chandra X-ray Science Center (CXC) and the High Energy Astrophysics Science Archive Center (HEASARC) with support from the JWST Mission office at the Space Telescope Science Institute for 3D visualisation.
References
- Akamatsu, H., & Kawahara, H. 2013, PASJ, 65, 16 [NASA ADS] [CrossRef] [Google Scholar]
- Akamatsu, H., Takizawa, M., Nakazawa, K., et al. 2012, PASJ, 64, 67 [NASA ADS] [Google Scholar]
- Akamatsu, H., Fujita, Y., Akahori, T., et al. 2017, A&A, 606, A1 [NASA ADS] [CrossRef] [EDP Sciences] [Google Scholar]
- Astropy Collaboration (Price-Whelan, A. M., et al.) 2018, AJ, 156, 123 [Google Scholar]
- Bagchi, J., Durret, F., Neto, G. B. L., & Paul, S. 2006, Science, 314, 791 [NASA ADS] [CrossRef] [Google Scholar]
- Bahé, Y. M., McCarthy, I. G., Balogh, M. L., & Font, A. S. 2013, MNRAS, 430, 3017 [Google Scholar]
- Bamford, S. P., Nichol, R. C., Baldry, I. K., et al. 2009, MNRAS, 393, 1324 [NASA ADS] [CrossRef] [Google Scholar]
- Beers, T. C., Flynn, K., & Gebhardt, K. 1990, AJ, 100, 32 [Google Scholar]
- Bilton, L. E., Pimbblet, K. A., & Gordon, Y. A. 2020, MNRAS, 499, 3792 [CrossRef] [Google Scholar]
- Biviano, A., Moretti, A., Paccagnella, A., et al. 2017, A&A, 607, A81 [NASA ADS] [CrossRef] [EDP Sciences] [Google Scholar]
- Blanton, M. R., Eisenstein, D., Hogg, D. W., Schlegel, D. J., & Brinkmann, J. 2005, ApJ, 629, 143 [Google Scholar]
- Boselli, A., Fossati, M., & Sun, M. 2022, A&ARv, 30, 3 [NASA ADS] [CrossRef] [Google Scholar]
- Botteon, A., Gastaldello, F., & Brunetti, G. 2018, MNRAS, 476, 5591 [Google Scholar]
- Botteon, A., Cassano, R., van Weeren, R. J., et al. 2021, ApJ, 914, L29 [NASA ADS] [CrossRef] [Google Scholar]
- Bourdin, H., Mazzotta, P., Markevitch, M., Giacintucci, S., & Brunetti, G. 2013, ApJ, 764, 82 [Google Scholar]
- Bremer, M. N., Phillipps, S., Kelvin, L. S., et al. 2018, MNRAS, 476, 12 [NASA ADS] [CrossRef] [Google Scholar]
- Briel, U. G., Finoguenov, A., & Henry, J. P. 2004, A&A, 426, 1 [NASA ADS] [CrossRef] [EDP Sciences] [Google Scholar]
- Brough, S., van de Sande, J., Owers, M. S., et al. 2017, ApJ, 844, 59 [Google Scholar]
- Brunetti, G., & Jones, T. W. 2014, Int. J. Mod. Phys. D, 23, 1430007 [Google Scholar]
- Burchett, J. N., Tripp, T., Prochaska, J., et al. 2018, Am. Astron. Soc. Meet. Abstr., 231, 302.05 [NASA ADS] [Google Scholar]
- Caglar, T. 2018, MNRAS, 475, 2870 [NASA ADS] [CrossRef] [Google Scholar]
- Caglar, T., & Hudaverdi, M. 2017, MNRAS, 472, 2633 [NASA ADS] [CrossRef] [Google Scholar]
- Calvi, R., Poggianti, B. M., Fasano, G., & Vulcani, B. 2012, MNRAS, 419, L14 [NASA ADS] [CrossRef] [Google Scholar]
- Carretti, E., Brown, S., Staveley-Smith, L., et al. 2013, MNRAS, 430, 1414 [NASA ADS] [CrossRef] [Google Scholar]
- Cava, A., Bettoni, D., Poggianti, B. M., et al. 2009, A&A, 495, 707 [NASA ADS] [CrossRef] [EDP Sciences] [Google Scholar]
- Chabrier, G. 2003, PASP, 115, 763 [Google Scholar]
- Chibueze, J. O., Sakemi, H., Ohmura, T., et al. 2021, Nature, 593, 47 [NASA ADS] [CrossRef] [Google Scholar]
- Chibueze, J. O., Akamatsu, H., Parekh, V., et al. 2023, PASJ, 75, S97 [NASA ADS] [CrossRef] [Google Scholar]
- Chung, A., van Gorkom, J. H., Kenney, J. D. P., Crowl, H., & Vollmer, B. 2009, AJ, 138, 1741 [Google Scholar]
- Chung, S. M., Gonzalez, A. H., Clowe, D., Markevitch, M., & Zaritsky, D. 2010, ApJ, 725, 1536 [NASA ADS] [CrossRef] [Google Scholar]
- Cohen, S. A., Hickox, R. C., Wegner, G. A., Einasto, M., & Vennik, J. 2014, ApJ, 783, 136 [Google Scholar]
- Cortese, L., Catinella, B., & Smith, R. 2021, PASA, 38, e035 [NASA ADS] [CrossRef] [Google Scholar]
- Crossett, J. P., Pimbblet, K. A., Jones, D. H., Brown, M. J. I., & Stott, J. P. 2017, MNRAS, 464, 480 [NASA ADS] [CrossRef] [Google Scholar]
- Davies, L. J. M., Robotham, A. S. G., Driver, S. P., et al. 2016, MNRAS, 455, 4013 [NASA ADS] [CrossRef] [Google Scholar]
- Davies, L. J. M., Robotham, A. S. G., Lagos, C. D. P., et al. 2019, MNRAS, 483, 5444 [Google Scholar]
- de Gasperin, F., Rudnick, L., Finoguenov, A., et al. 2022, A&A, 659, A146 [NASA ADS] [CrossRef] [EDP Sciences] [Google Scholar]
- Desai, V., Dalcanton, J. J., Aragón-Salamanca, A., et al. 2007, ApJ, 660, 1151 [NASA ADS] [CrossRef] [Google Scholar]
- Dey, A., Schlegel, D. J., Lang, D., et al. 2019, AJ, 157, 168 [Google Scholar]
- Dhiwar, S., Saha, K., Dekel, A., et al. 2023, MNRAS, 518, 4943 [Google Scholar]
- D’Onofrio, M., Grado, A., Bettoni, D., et al. 2020, A&A, 637, A54 [NASA ADS] [CrossRef] [EDP Sciences] [Google Scholar]
- Dressler, A. 1980, ApJ, 236, 351 [Google Scholar]
- Dressler, A., Oemler, A., Jr., Poggianti, B. M., et al. 2013, ApJ, 770, 62 [NASA ADS] [CrossRef] [Google Scholar]
- Durret, F., Perrot, C., Lima Neto, G. B., et al. 2013, A&A, 560, A78 [NASA ADS] [CrossRef] [EDP Sciences] [Google Scholar]
- Dwarakanath, K. S., Parekh, V., Kale, R., & George, L. T. 2018, MNRAS, 477, 957 [NASA ADS] [CrossRef] [Google Scholar]
- Fakhouri, O., & Ma, C.-P. 2010, MNRAS, 401, 2245 [NASA ADS] [CrossRef] [Google Scholar]
- Fasano, G., Marmo, C., Varela, J., et al. 2006, A&A, 445, 805 [NASA ADS] [CrossRef] [EDP Sciences] [Google Scholar]
- Fasano, G., Vanzella, E., Dressler, A., et al. 2012, MNRAS, 420, 926 [Google Scholar]
- Fasano, G., Poggianti, B. M., Bettoni, D., et al. 2015, MNRAS, 449, 3927 [CrossRef] [Google Scholar]
- Ferrari, C., Arnaud, M., Ettori, S., Maurogordato, S., & Rho, J. 2006, A&A, 446, 417 [NASA ADS] [CrossRef] [EDP Sciences] [Google Scholar]
- Finoguenov, A., Sarazin, C. L., Nakazawa, K., Wik, D. R., & Clarke, T. E. 2010, ApJ, 715, 1143 [Google Scholar]
- Fritz, J., Poggianti, B. M., Bettoni, D., et al. 2007, A&A, 470, 137 [NASA ADS] [CrossRef] [EDP Sciences] [Google Scholar]
- Fritz, J., Moretti, A., Gullieuszik, M., et al. 2017, ApJ, 848, 132 [NASA ADS] [CrossRef] [Google Scholar]
- Fujita, Y. 2004, PASJ, 56, 29 [NASA ADS] [Google Scholar]
- Gavazzi, G., Fumagalli, M., Cucciati, O., & Boselli, A. 2010, A&A, 517, A73 [NASA ADS] [CrossRef] [EDP Sciences] [Google Scholar]
- George, M. R., Ma, C.-P., Bundy, K., et al. 2013, ApJ, 770, 113 [CrossRef] [Google Scholar]
- George, L. T., Dwarakanath, K. S., Johnston-Hollitt, M., et al. 2015, MNRAS, 451, 4207 [Google Scholar]
- Golovich, N., Dawson, W. A., Wittman, D. M., et al. 2019a, ApJS, 240, 39 [NASA ADS] [CrossRef] [Google Scholar]
- Golovich, N., Dawson, W. A., Wittman, D. M., et al. 2019b, ApJ, 882, 69 [NASA ADS] [CrossRef] [Google Scholar]
- Gray, M. E., Wolf, C., Meisenheimer, K., et al. 2004, MNRAS, 347, L73 [CrossRef] [Google Scholar]
- Greene, J. E., Leauthaud, A., Emsellem, E., et al. 2017, ApJ, 851, L33 [NASA ADS] [CrossRef] [Google Scholar]
- Grootes, M. W., Tuffs, R. J., Popescu, C. C., et al. 2017, AJ, 153, 111 [CrossRef] [Google Scholar]
- Gu, L., Akamatsu, H., Shimwell, T. W., et al. 2019, Nat. Astron., 3, 838 [NASA ADS] [CrossRef] [Google Scholar]
- Gullieuszik, M., Poggianti, B., Fasano, G., et al. 2015, A&A, 581, A41 [NASA ADS] [CrossRef] [EDP Sciences] [Google Scholar]
- Haines, C. P., Pereira, M. J., Smith, G. P., et al. 2013, ApJ, 775, 126 [NASA ADS] [CrossRef] [Google Scholar]
- Haines, C. P., Pereira, M. J., Smith, G. P., et al. 2015, ApJ, 806, 101 [NASA ADS] [CrossRef] [Google Scholar]
- Hallman, E. J., & Markevitch, M. 2004, ApJ, 610, L81 [Google Scholar]
- Hartigan, J. A., & Hartigan, P. M. 1985, Ann. Stat., 13, 70 [Google Scholar]
- Houghton, R. C. W. 2015, MNRAS, 451, 3427 [Google Scholar]
- Im, M., Simard, L., Faber, S. M., et al. 2002, ApJ, 571, 136 [NASA ADS] [CrossRef] [Google Scholar]
- Jaffé, Y. L., Aragón-Salamanca, A., De Lucia, G., et al. 2011, MNRAS, 410, 280 [CrossRef] [Google Scholar]
- Jaffé, Y. L., Aragón-Salamanca, A., Ziegler, B., et al. 2014, MNRAS, 440, 3491 [CrossRef] [Google Scholar]
- Jaffé, Y. L., Verheijen, M. A. W., Haines, C. P., et al. 2016, MNRAS, 461, 1202 [Google Scholar]
- Joffre, M., Fischer, P., Frieman, J., et al. 2000, ApJ, 534, L131 [NASA ADS] [CrossRef] [Google Scholar]
- Johnston, E. J., Aragón-Salamanca, A., & Merrifield, M. R. 2014, MNRAS, 441, 333 [Google Scholar]
- Johnston, E. J., Aragón-Salamanca, A., Fraser-McKelvie, A., et al. 2021, MNRAS, 500, 4193 [Google Scholar]
- Johnston, E. J., Häußler, B., Jegatheesan, K., et al. 2022, MNRAS, 514, 6141 [NASA ADS] [CrossRef] [Google Scholar]
- Kale, R., Dwarakanath, K. S., Bagchi, J., & Paul, S. 2011, J. Astrophys. Astron., 32, 533 [NASA ADS] [CrossRef] [Google Scholar]
- Kale, R., Dwarakanath, K. S., Bagchi, J., & Paul, S. 2012, MNRAS, 426, 1204 [NASA ADS] [CrossRef] [Google Scholar]
- Kale, R., Parekh, V., Rahaman, M., et al. 2022, MNRAS, 514, 5969 [NASA ADS] [CrossRef] [Google Scholar]
- Kelkar, K., Gray, M. E., Aragón-Salamanca, A., et al. 2017, MNRAS, 469, 4551 [NASA ADS] [CrossRef] [Google Scholar]
- Kelkar, K., Gray, M. E., Aragón-Salamanca, A., et al. 2019, MNRAS, 486, 868 [NASA ADS] [CrossRef] [Google Scholar]
- Kelkar, K., Dwarakanath, K. S., Poggianti, B. M., et al. 2020, MNRAS, 496, 442 [NASA ADS] [CrossRef] [Google Scholar]
- Kiuchi, R., Mori, M., Bicknell, G. V., et al. 2009, ApJ, 704, 240 [NASA ADS] [CrossRef] [Google Scholar]
- Kleiner, D., Pimbblet, K. A., Owers, M. S., Jones, D. H., & Stephenson, A. P. 2014, MNRAS, 439, 2755 [NASA ADS] [CrossRef] [Google Scholar]
- Knopp, G. P., Henry, J. P., & Briel, U. G. 1996, ApJ, 472, 125 [NASA ADS] [CrossRef] [Google Scholar]
- Knowles, K., Cotton, W. D., Rudnick, L., et al. 2022, A&A, 657, A56 [NASA ADS] [CrossRef] [EDP Sciences] [Google Scholar]
- Kraljic, K., Arnouts, S., Pichon, C., et al. 2018, MNRAS, 474, 547 [Google Scholar]
- Kuchner, U., Haggar, R., Aragón-Salamanca, A., et al. 2022, MNRAS, 510, 581 [Google Scholar]
- Larson, R. B., Tinsley, B. M., & Caldwell, C. N. 1980, ApJ, 237, 692 [Google Scholar]
- Li, F., Gu, Y.-Z., Yuan, Q.-R., et al. 2019, MNRAS, 484, 3806 [CrossRef] [Google Scholar]
- Longhetti, M., & Saracco, P. 2009, MNRAS, 394, 774 [NASA ADS] [CrossRef] [Google Scholar]
- Lopes, P. A. A., Rembold, S. B., Ribeiro, A. L. B., Nascimento, R. S., & Vajgel, B. 2016, MNRAS, 461, 2559 [NASA ADS] [CrossRef] [Google Scholar]
- Lopes, P. A. A., Ribeiro, A. L. B., & Rembold, S. B. 2017, MNRAS, 472, 409 [NASA ADS] [CrossRef] [Google Scholar]
- Lourenço, A. C. C., Jaffé, Y. L., Vulcani, B., et al. 2023, MNRAS, 526, 4831 [CrossRef] [Google Scholar]
- Machado, R. E. G., & Lima Neto, G. B. 2013, MNRAS, 430, 3249 [NASA ADS] [CrossRef] [Google Scholar]
- Mahajan, S., Gupta, K. K., Rana, R., et al. 2020, MNRAS, 491, 398 [NASA ADS] [CrossRef] [Google Scholar]
- Mansheim, A. S., Lemaux, B. C., Dawson, W. A., et al. 2017, ApJ, 834, 205 [NASA ADS] [CrossRef] [Google Scholar]
- Mazzotta, P., Fusco-Femiano, R., & Vikhlinin, A. 2002, ApJ, 569, L31 [NASA ADS] [CrossRef] [Google Scholar]
- McGee, S. L., Balogh, M. L., Bower, R. G., Font, A. S., & McCarthy, I. G. 2009, MNRAS, 400, 937 [Google Scholar]
- Monteiro-Oliveira, R., Lima Neto, G. B., Cypriano, E. S., et al. 2017, MNRAS, 468, 4566 [NASA ADS] [CrossRef] [Google Scholar]
- Moretti, A., Poggianti, B. M., Fasano, G., et al. 2014, A&A, 564, A138 [NASA ADS] [CrossRef] [EDP Sciences] [Google Scholar]
- Moretti, A., Gullieuszik, M., Poggianti, B., et al. 2017, A&A, 599, A81 [NASA ADS] [CrossRef] [EDP Sciences] [Google Scholar]
- Mulroy, S. L., McGee, S. L., Gillman, S., et al. 2017, MNRAS, 472, 3246 [NASA ADS] [CrossRef] [Google Scholar]
- Nakazawa, K., Sarazin, C. L., Kawaharada, M., et al. 2009, PASJ, 61, 339 [NASA ADS] [Google Scholar]
- Oh, S., Kim, K., Lee, J. H., et al. 2018, ApJS, 237, 14 [Google Scholar]
- Omizzolo, A., Fasano, G., Reverte Paya, D., et al. 2014, A&A, 561, A111 [NASA ADS] [CrossRef] [EDP Sciences] [Google Scholar]
- Owers, M. S., Hudson, M. J., Oman, K. A., et al. 2019, ApJ, 873, 52 [Google Scholar]
- Paul, S., Iapichino, L., Miniati, F., Bagchi, J., & Mannheim, K. 2011, ApJ, 726, 17 [Google Scholar]
- Peng, C. Y., Ho, L. C., Impey, C. D., & Rix, H.-W. 2010, AJ, 139, 2097 [Google Scholar]
- Pérez-Millán, D., Fritz, J., González-Lópezlira, R. A., et al. 2023, MNRAS, 521, 1292 [CrossRef] [Google Scholar]
- Petropoulou, V., Vílchez, J., & Iglesias-Páramo, J. 2012, ApJ, 749, 133 [NASA ADS] [CrossRef] [Google Scholar]
- Piraino-Cerda, F., Jaffé, Y., Lourenço, A., et al. 2023, MNRAS, submitted [Google Scholar]
- Planck Collaboration XIII. 2016, A&A, 594, A13 [NASA ADS] [CrossRef] [EDP Sciences] [Google Scholar]
- Poggianti, B. M., Fasano, G., Bettoni, D., et al. 2009, ApJ, 697, L137 [NASA ADS] [CrossRef] [Google Scholar]
- Pranger, F., Böhm, A., Ferrari, C., et al. 2014, A&A, 570, A40 [NASA ADS] [CrossRef] [EDP Sciences] [Google Scholar]
- Prescott, M., Baldry, I. K., James, P. A., et al. 2011, MNRAS, 417, 1374 [NASA ADS] [CrossRef] [Google Scholar]
- Press, W. H., & Schechter, P. 1974, ApJ, 187, 425 [Google Scholar]
- Rawle, T. D., Altieri, B., Egami, E., et al. 2014, MNRAS, 442, 196 [Google Scholar]
- Riseley, C. J., Scaife, A. M. M., Oozeer, N., Magnus, L., & Wise, M. W. 2015, MNRAS, 447, 1895 [NASA ADS] [CrossRef] [Google Scholar]
- Sánchez-Blázquez, P., Jablonka, P., Noll, S., et al. 2009, A&A, 499, 47 [Google Scholar]
- Sarazin, C. L., Finoguenov, A., Wik, D. R., & Clarke, T. E. 2016, ArXiv e-prints [arXiv:1606.07433] [Google Scholar]
- Shapiro, S. S., & Wilk, M. B. 1965, Biometrika, 52, 591 [Google Scholar]
- Shim, H., Im, M., Lee, H. M., et al. 2011, ApJ, 727, 14 [NASA ADS] [CrossRef] [Google Scholar]
- Skibba, R. A., Bamford, S. P., Nichol, R. C., et al. 2009, MNRAS, 399, 966 [NASA ADS] [CrossRef] [Google Scholar]
- Sobral, D., Stroe, A., Dawson, W. A., et al. 2015, MNRAS, 450, 630 [NASA ADS] [CrossRef] [Google Scholar]
- Storm, E., Vink, J., Zandanel, F., & Akamatsu, H. 2018, MNRAS, 479, 553 [NASA ADS] [Google Scholar]
- Stroe, A., & Sobral, D. 2021, ApJ, 912, 55 [CrossRef] [Google Scholar]
- Stroe, A., Oosterloo, T., Röttgering, H. J. A., et al. 2015a, MNRAS, 452, 2731 [NASA ADS] [CrossRef] [Google Scholar]
- Stroe, A., Sobral, D., Dawson, W., et al. 2015b, MNRAS, 450, 646 [NASA ADS] [CrossRef] [Google Scholar]
- Stroe, A., Sobral, D., Paulino-Afonso, A., et al. 2017, MNRAS, 465, 2916 [NASA ADS] [CrossRef] [Google Scholar]
- Taylor, M. B. 2005, in Astronomical Data Analysis Software and Systems XIV, eds. P. Shopbell, M. Britton, & R. Ebert, ASP Conf. Ser., 347, 29 [Google Scholar]
- Treu, T., Ellis, R. S., Kneib, J.-P., et al. 2003, ApJ, 591, 53 [Google Scholar]
- Urdampilleta, I., Akamatsu, H., Mernier, F., et al. 2018, A&A, 618, A74 [NASA ADS] [CrossRef] [EDP Sciences] [Google Scholar]
- Valentinuzzi, T., Poggianti, B. M., Fasano, G., et al. 2011, A&A, 536, A34 [NASA ADS] [CrossRef] [EDP Sciences] [Google Scholar]
- van Weeren, R. J., de Gasperin, F., Akamatsu, H., et al. 2019, Space Sci. Rev., 215, 16 [Google Scholar]
- Vulcani, B., Poggianti, B. M., Finn, R. A., et al. 2010, ApJ, 710, L1 [NASA ADS] [CrossRef] [Google Scholar]
- Vulcani, B., Poggianti, B. M., Aragón-Salamanca, A., et al. 2011a, MNRAS, 412, 246 [Google Scholar]
- Vulcani, B., Poggianti, B. M., Dressler, A., et al. 2011b, MNRAS, 413, 921 [NASA ADS] [CrossRef] [Google Scholar]
- Vulcani, B., Poggianti, B. M., Fritz, J., et al. 2015, ApJ, 798, 52 [Google Scholar]
- Vulcani, B., Poggianti, B. M., Moretti, A., et al. 2019, MNRAS, 487, 2278 [Google Scholar]
- Vulcani, B., Poggianti, B. M., Smith, R., et al. 2022, ApJ, 927, 91 [NASA ADS] [CrossRef] [Google Scholar]
- Vulcani, B., Poggianti, B. M., Gullieuszik, M., et al. 2023, ApJ, 949, 73 [CrossRef] [Google Scholar]
- Wayth, R. B., Lenc, E., Bell, M. E., et al. 2015, PASA, 32, e025 [Google Scholar]
- Weinmann, S. M., Kauffmann, G., von der Linden, A., & De Lucia, G. 2010, MNRAS, 406, 2249 [NASA ADS] [CrossRef] [Google Scholar]
- Wetzel, A. R., Tinker, J. L., & Conroy, C. 2012, MNRAS, 424, 232 [NASA ADS] [CrossRef] [Google Scholar]
- Wilson, E. B. 1927, J. Am. Stat. Assoc., 22, 209 [CrossRef] [Google Scholar]
- Wolf, C., Aragón-Salamanca, A., Balogh, M., et al. 2009, MNRAS, 393, 1302 [Google Scholar]
- Yang, Y., Huo, Z., Zhou, X., et al. 2004, ApJ, 614, 692 [NASA ADS] [CrossRef] [Google Scholar]
- Yoon, Y., & Im, M. 2020, ApJ, 893, 117 [NASA ADS] [CrossRef] [Google Scholar]
Appendix A: Colour–magnitude relations for the control cluster sample
We present CMRs for the seven relaxed clusters comprising our control cluster sample, using the recipe described in Sect. 4 for fitting the RS. The magnitude bins were kept fixed for the fitting for both the post-merger and relaxed cluster samples.
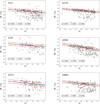 |
Fig. A.1. CMRs for control cluster samples. Each panel represents the CMR for a single cluster from our control relaxed cluster sample with the cluster members (grey filled circles) from Vulcani et al. (2022). The solid black line indicates the fitted RS, with the average scatter of the fit (σ) shown by the dash-dot red lines above and below the fit line. The inset panel gives the details of the fit for each and every cluster. |
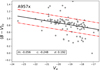 |
Fig. A.2. CMR for each of the control relaxed clusters (continued). |
Appendix B: Properties of spiral galaxies in the cluster sample
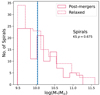 |
Fig. B.1. Mass distribution for spirals in the post-merger and relaxed cluster samples within 0.9R200, the aperture we use to compute fractions throughout this work. The inset p value denotes the Kolmogorov-Smirnov test significance under the null hypothesis that the stellar mass distributions from both cluster samples are drawn from the same parent distribution. The vertical solid and dashed lines indicate the median quantities for galaxies in the post-merger and relaxed clusters, respectively. |
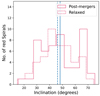 |
Fig. B.2. Distribution of the inclination of red spirals in the post-merger and relaxed cluster samples (Fig. 8), computed using the b/a ratios from Gullieuszik et al. (2015). The vertical solid and dashed lines indicate the median quantities for galaxies in the post-merger and relaxed clusters, respectively. |
Properties of the WINGS/OmegaWINGS cluster sample.
All Tables
All Figures
|
Fig. 1. Summary of the post-merger sample (thick bars annotated in red) and the relaxed control cluster sample (thin bars annotated in black) as a function of cluster redshift and velocity dispersion. |
| In the text | |
|
Fig. 2. Galaxies in the post-merger cluster sample. Left: spatial distribution of our spectroscopic galaxy sample (open white circles) of the three post-merger clusters in our cluster sample (labeled in the right-hand panels). BCGs are marked with open green squares and the centre of the system by a red star, both of which are adopted from L23. The extended blue contours denote the radio relics detected using 1280 MHz data from the MGCLS (Knowles et al. 2022) for A3667 and A3376, and 170−230 MHz continuum data from the GaLactic and Extragalactic All-sky MWA (GLEAM) survey (Wayth et al. 2015) for A168. The underlying image represents the cluster X-ray emission determined using the publicly available Chandra X-ray data, with black plus signs indicating the peak X-ray emission. The overlay of the dotted circle indicates an aperture of 0.9 R200. Right: spectroscopic z distribution of the galaxy sample and BCGs (vertical green line). The red peaks indicate the Gaussians fitted to the observed z distribution, and N denotes the number of spectroscopic members in each cluster. |
| In the text | |
|
Fig. 3. Spatial distribution of galaxies for each of the morphologies – ellipticals (top), lenticulars (middle), and spirals (bottom) – from the primary spectroscopic sample. Each panel shows the overall density contours for the distribution of each morphology type, split into red and blue galaxies according to the selection criteria discussed in Sect. 4. The faint markers indicate galaxies beyond 0.9 R200, which have been excluded from the quantitative analysis presented in this paper. As in Fig. 2, we show the BCG (open green square), system centre (white star), X-ray peak (white plus sign), and approximate location of radio relics (orange crosses). |
| In the text | |
|
Fig. 4. Fraction of galaxies of each morphology as a function of σcl (left) and X-ray luminosity (LX; right). Filled grey symbols indicate the clusters in the post-merger cluster sample. The solid coloured and black lines denote the average fractions in the post-merger and control cluster samples, respectively, with errors represented by the corresponding dashed lines. The cluster mergers have the same average fraction of spirals as the seven relaxed clusters, where the average is dominated by the scatter in the fractions. |
| In the text | |
|
Fig. 5. CMR for A3667, A3376, and A168 using the OmegaWINGS photometric sample (grey filled circles). Overplotted are galaxies in the extended spectroscopic galaxy sample (Vulcani et al. 2022) with MORPHOT T-type morphologies. The dash-dotted line represents the 1σ above and below the fitted RS (solid), and the vertical dotted red line indicates the V-band magnitude limit (V0 = −18) corresponding to the spectroscopic mass-completeness of log(M*/M⊙) = 9.48. The inset box indicates the slope (m), intercept (c), and standard deviation (σ) of the linear fit to the RS. |
| In the text | |
|
Fig. 6. Slope of the RS (m) as a function of σcl (left) and the scatter of the RS (σ) as a function of σcl (right). Filled grey symbols indicate the post-merger cluster sample. Relaxed and cluster mergers show similar slopes and scatters. |
| In the text | |
|
Fig. 7. Blue fraction as a function of the cluster dynamical state, in two mass bins. Left: average blue fraction as a function of the cluster dynamical state, in two mass bins. Right: blue fraction as a function of σcl (top) and LX (bottom) for each of the two mass bins. The solid and dotted black and blue lines represent the average fractions with 1σ errors for relaxed and cluster mergers, respectively. The blue fractions, dominated mostly by spiral galaxies, are similar in post-mergers and relaxed clusters for the lower-mass bin. Moreover, the blue fractions as a function of global cluster properties remain constant within 1σ errors for post-mergers. The relaxed clusters, on the other hand, show a lot of scatter in the blue fractions as a function of σcl and LX. |
| In the text | |
|
Fig. 8. Fraction of red spirals as a function of σcl and LX, separated into a relaxed cluster sample (red open diamonds) and a merging cluster sample (filled grey diamonds). The solid black and red lines indicate the average fraction for relaxed and merging clusters, respectively. The dotted lines correspond to the 1σ error for each respective sample. A3667 has a marginally higher fraction of red spirals compared to relaxed clusters. |
| In the text | |
|
Fig. 9. Fraction of blue ETGs as a function of σcl and LX, separated into a relaxed cluster sample (blue open circles) and a merging cluster sample (filled grey circles). The solid black and blue lines indicate the average fraction for relaxed and merging clusters, respectively. The dotted lines correspond to the 1σ error for each sample. Merging clusters show a constant fraction of blue ETGs, while the fraction of blue ETGs varies considerably in the relaxed clusters. |
| In the text | |
|
Fig. A.1. CMRs for control cluster samples. Each panel represents the CMR for a single cluster from our control relaxed cluster sample with the cluster members (grey filled circles) from Vulcani et al. (2022). The solid black line indicates the fitted RS, with the average scatter of the fit (σ) shown by the dash-dot red lines above and below the fit line. The inset panel gives the details of the fit for each and every cluster. |
| In the text | |
|
Fig. A.2. CMR for each of the control relaxed clusters (continued). |
| In the text | |
|
Fig. B.1. Mass distribution for spirals in the post-merger and relaxed cluster samples within 0.9R200, the aperture we use to compute fractions throughout this work. The inset p value denotes the Kolmogorov-Smirnov test significance under the null hypothesis that the stellar mass distributions from both cluster samples are drawn from the same parent distribution. The vertical solid and dashed lines indicate the median quantities for galaxies in the post-merger and relaxed clusters, respectively. |
| In the text | |
|
Fig. B.2. Distribution of the inclination of red spirals in the post-merger and relaxed cluster samples (Fig. 8), computed using the b/a ratios from Gullieuszik et al. (2015). The vertical solid and dashed lines indicate the median quantities for galaxies in the post-merger and relaxed clusters, respectively. |
| In the text | |
Current usage metrics show cumulative count of Article Views (full-text article views including HTML views, PDF and ePub downloads, according to the available data) and Abstracts Views on Vision4Press platform.
Data correspond to usage on the plateform after 2015. The current usage metrics is available 48-96 hours after online publication and is updated daily on week days.
Initial download of the metrics may take a while.