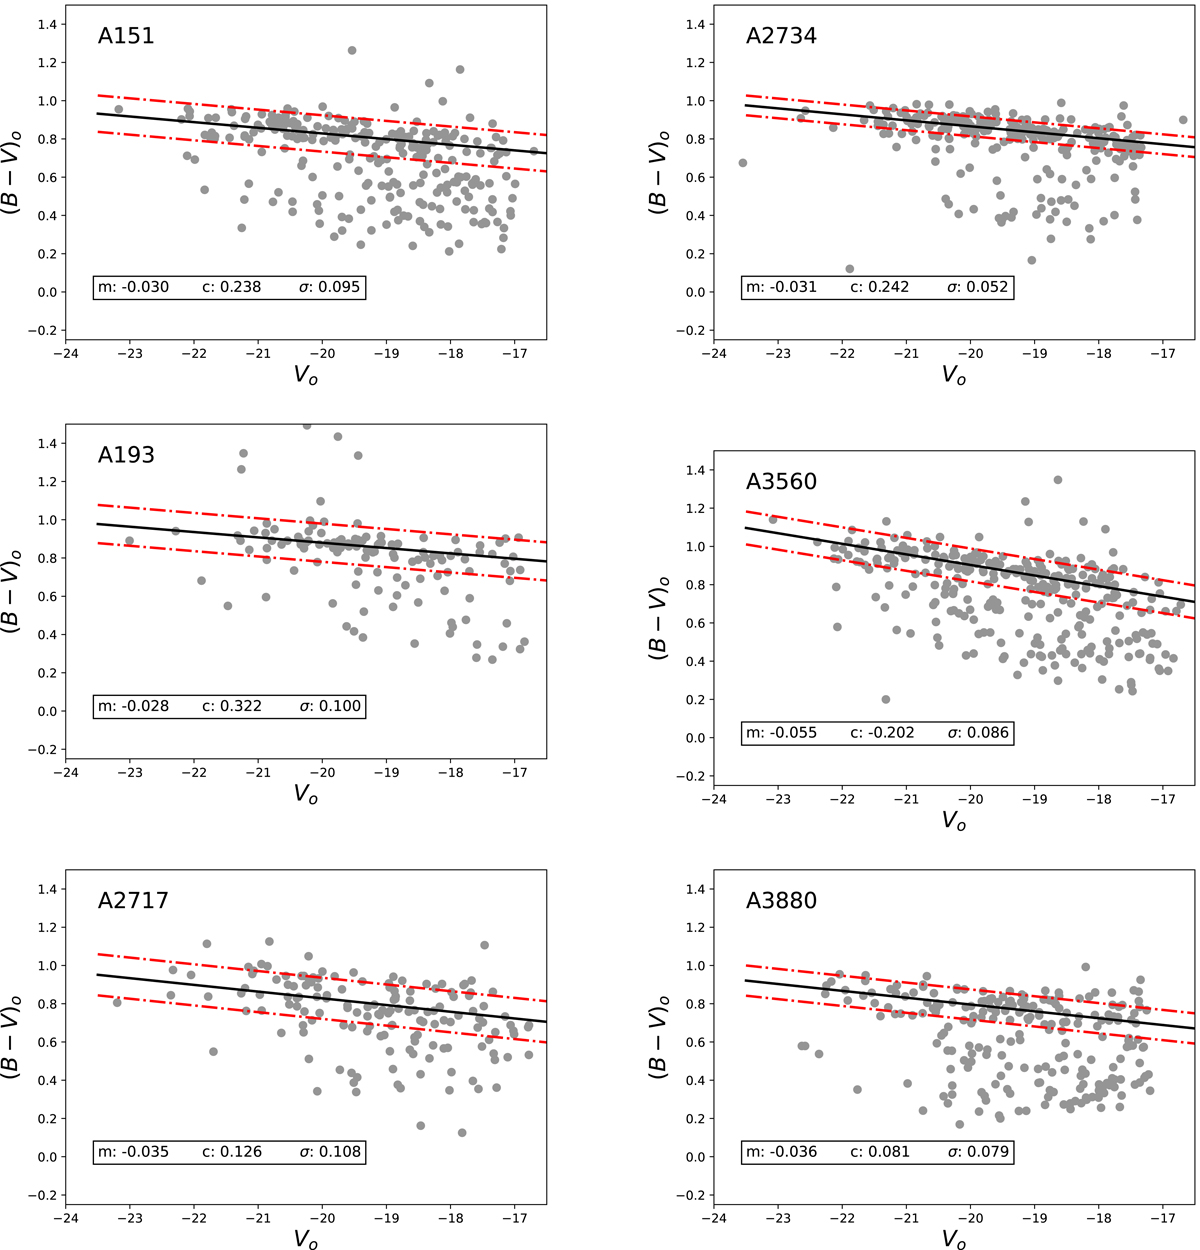
Fig. A.1.
Download original image
CMRs for control cluster samples. Each panel represents the CMR for a single cluster from our control relaxed cluster sample with the cluster members (grey filled circles) from Vulcani et al. (2022). The solid black line indicates the fitted RS, with the average scatter of the fit (σ) shown by the dash-dot red lines above and below the fit line. The inset panel gives the details of the fit for each and every cluster.
Current usage metrics show cumulative count of Article Views (full-text article views including HTML views, PDF and ePub downloads, according to the available data) and Abstracts Views on Vision4Press platform.
Data correspond to usage on the plateform after 2015. The current usage metrics is available 48-96 hours after online publication and is updated daily on week days.
Initial download of the metrics may take a while.