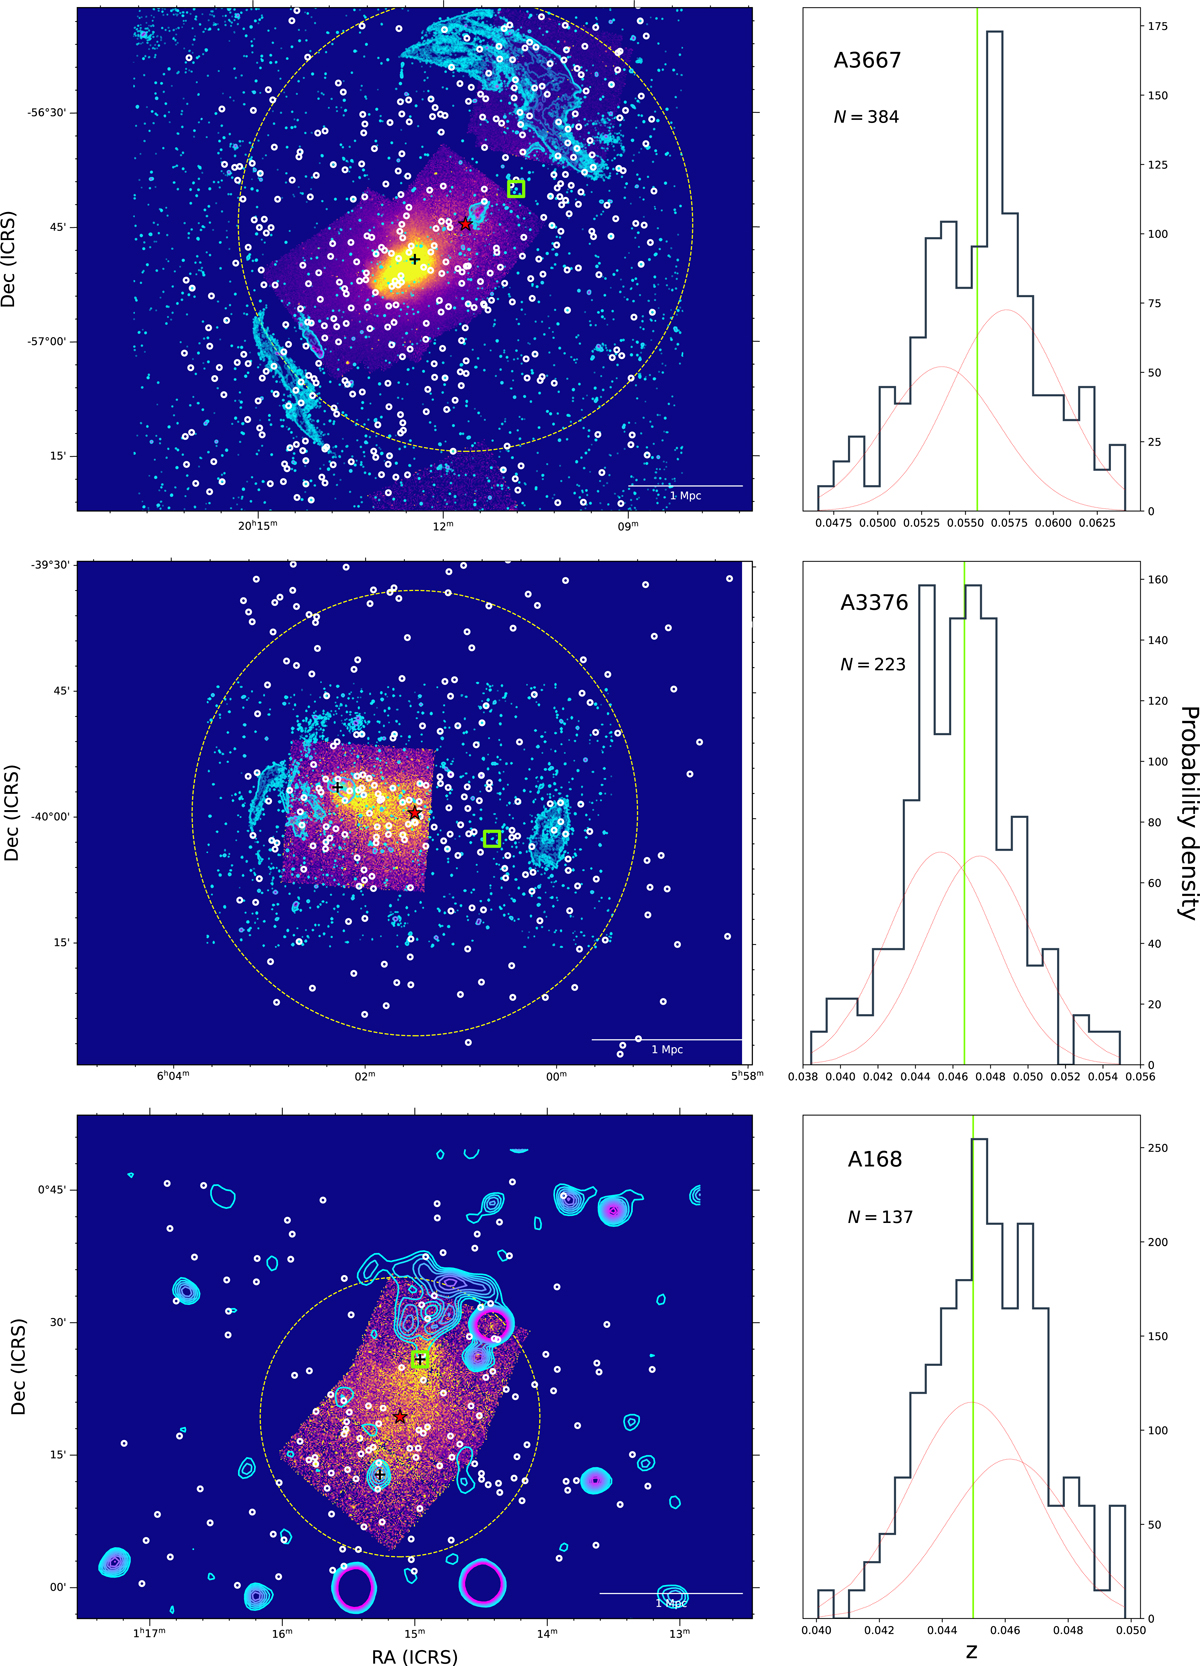
Fig. 2.
Download original image
Galaxies in the post-merger cluster sample. Left: spatial distribution of our spectroscopic galaxy sample (open white circles) of the three post-merger clusters in our cluster sample (labeled in the right-hand panels). BCGs are marked with open green squares and the centre of the system by a red star, both of which are adopted from L23. The extended blue contours denote the radio relics detected using 1280 MHz data from the MGCLS (Knowles et al. 2022) for A3667 and A3376, and 170−230 MHz continuum data from the GaLactic and Extragalactic All-sky MWA (GLEAM) survey (Wayth et al. 2015) for A168. The underlying image represents the cluster X-ray emission determined using the publicly available Chandra X-ray data, with black plus signs indicating the peak X-ray emission. The overlay of the dotted circle indicates an aperture of 0.9 R200. Right: spectroscopic z distribution of the galaxy sample and BCGs (vertical green line). The red peaks indicate the Gaussians fitted to the observed z distribution, and N denotes the number of spectroscopic members in each cluster.
Current usage metrics show cumulative count of Article Views (full-text article views including HTML views, PDF and ePub downloads, according to the available data) and Abstracts Views on Vision4Press platform.
Data correspond to usage on the plateform after 2015. The current usage metrics is available 48-96 hours after online publication and is updated daily on week days.
Initial download of the metrics may take a while.