Fig. 3.
Download original image
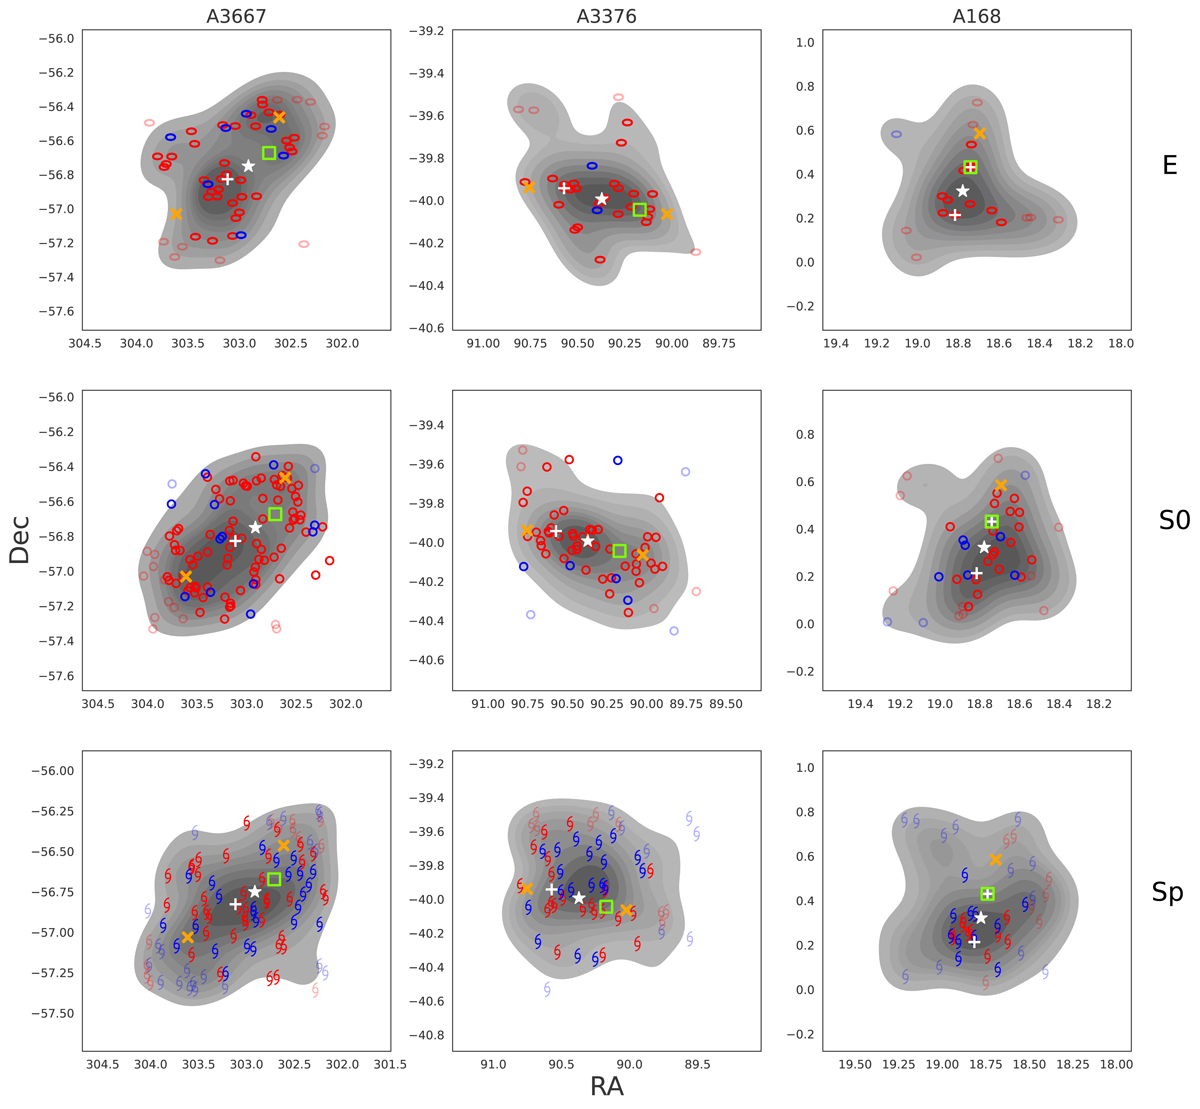
Spatial distribution of galaxies for each of the morphologies – ellipticals (top), lenticulars (middle), and spirals (bottom) – from the primary spectroscopic sample. Each panel shows the overall density contours for the distribution of each morphology type, split into red and blue galaxies according to the selection criteria discussed in Sect. 4. The faint markers indicate galaxies beyond 0.9 R200, which have been excluded from the quantitative analysis presented in this paper. As in Fig. 2, we show the BCG (open green square), system centre (white star), X-ray peak (white plus sign), and approximate location of radio relics (orange crosses).
Current usage metrics show cumulative count of Article Views (full-text article views including HTML views, PDF and ePub downloads, according to the available data) and Abstracts Views on Vision4Press platform.
Data correspond to usage on the plateform after 2015. The current usage metrics is available 48-96 hours after online publication and is updated daily on week days.
Initial download of the metrics may take a while.