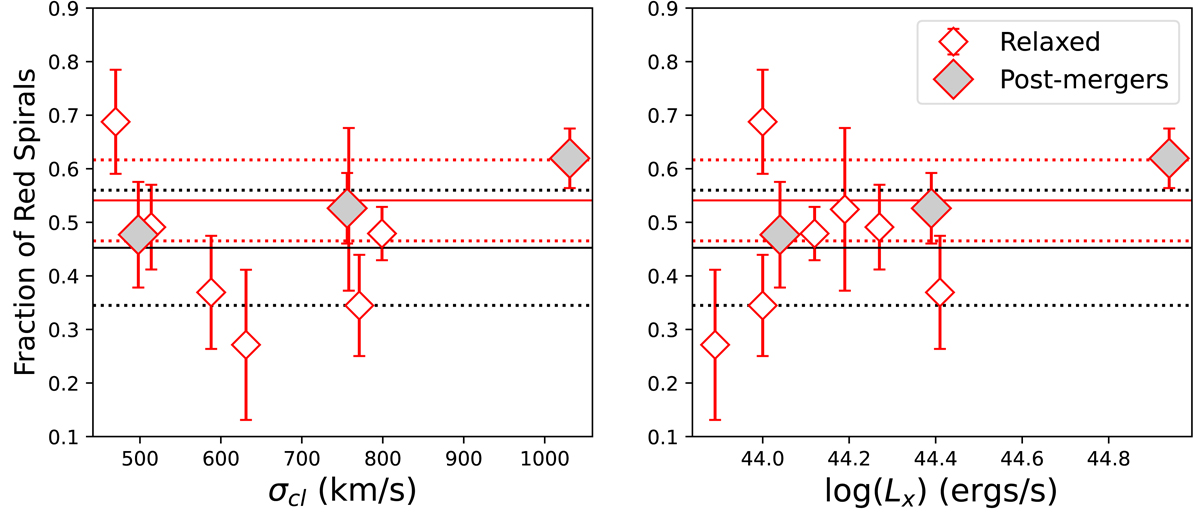
Fig. 8.
Download original image
Fraction of red spirals as a function of σcl and LX, separated into a relaxed cluster sample (red open diamonds) and a merging cluster sample (filled grey diamonds). The solid black and red lines indicate the average fraction for relaxed and merging clusters, respectively. The dotted lines correspond to the 1σ error for each respective sample. A3667 has a marginally higher fraction of red spirals compared to relaxed clusters.
Current usage metrics show cumulative count of Article Views (full-text article views including HTML views, PDF and ePub downloads, according to the available data) and Abstracts Views on Vision4Press platform.
Data correspond to usage on the plateform after 2015. The current usage metrics is available 48-96 hours after online publication and is updated daily on week days.
Initial download of the metrics may take a while.