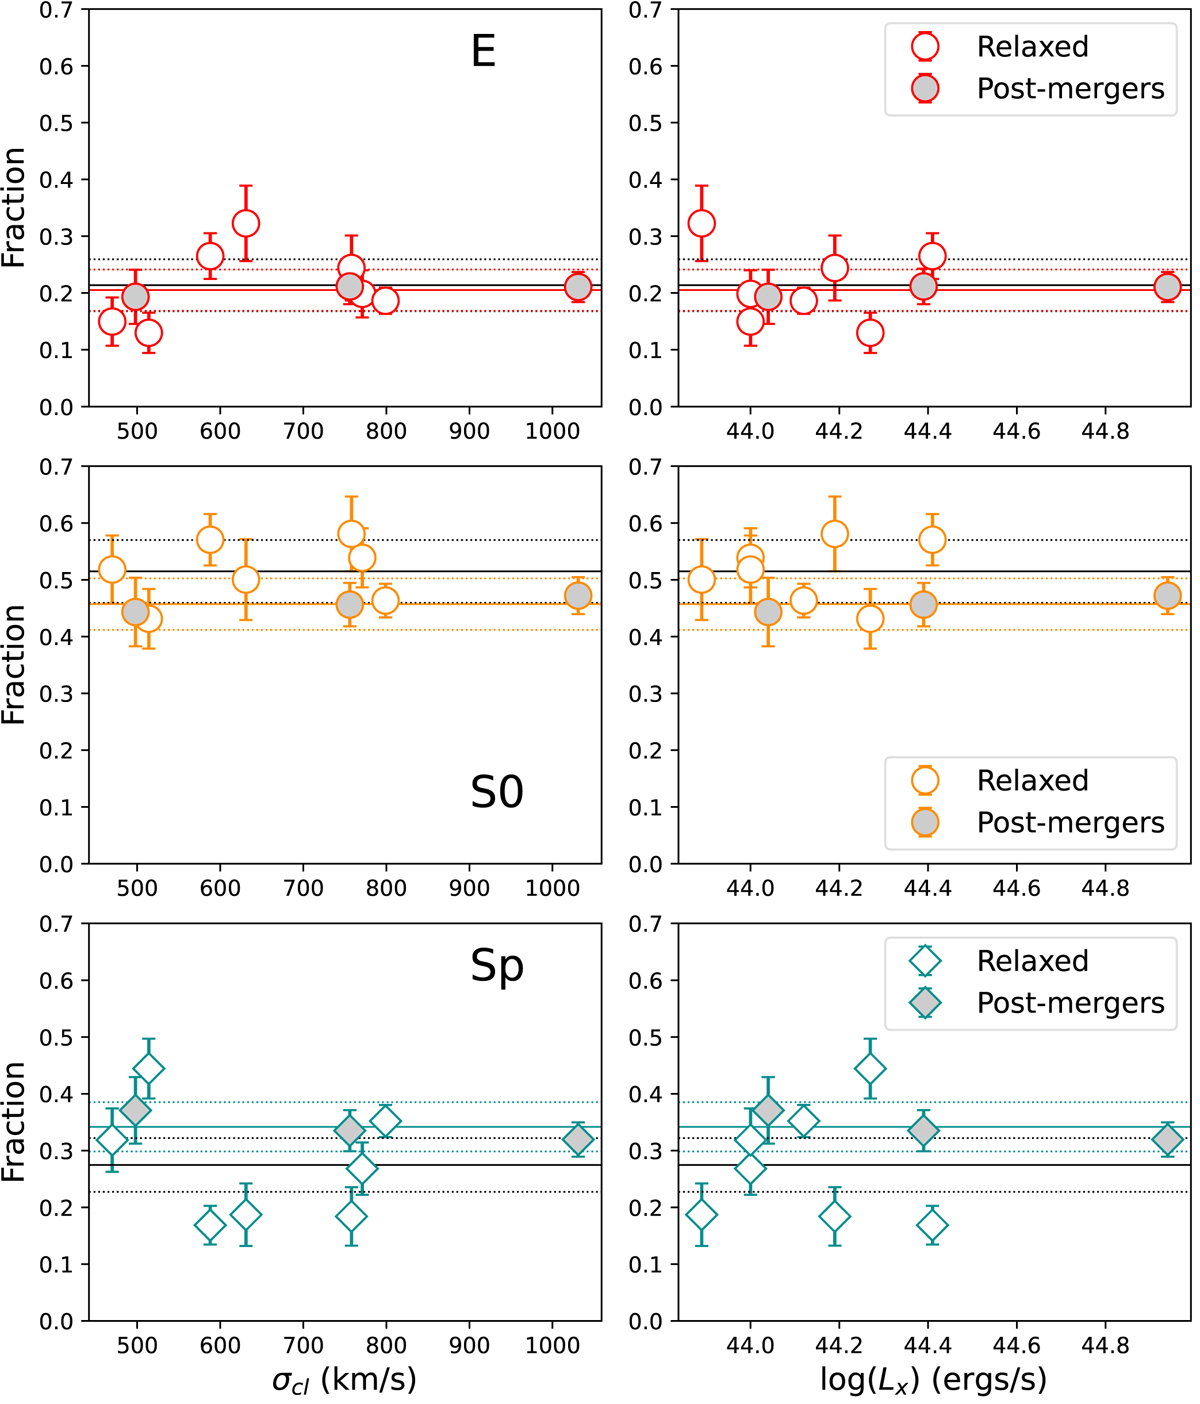
Fig. 4.
Download original image
Fraction of galaxies of each morphology as a function of σcl (left) and X-ray luminosity (LX; right). Filled grey symbols indicate the clusters in the post-merger cluster sample. The solid coloured and black lines denote the average fractions in the post-merger and control cluster samples, respectively, with errors represented by the corresponding dashed lines. The cluster mergers have the same average fraction of spirals as the seven relaxed clusters, where the average is dominated by the scatter in the fractions.
Current usage metrics show cumulative count of Article Views (full-text article views including HTML views, PDF and ePub downloads, according to the available data) and Abstracts Views on Vision4Press platform.
Data correspond to usage on the plateform after 2015. The current usage metrics is available 48-96 hours after online publication and is updated daily on week days.
Initial download of the metrics may take a while.