| Issue |
A&A
Volume 678, October 2023
|
|
|---|---|---|
| Article Number | A21 | |
| Number of page(s) | 22 | |
| Section | Stellar atmospheres | |
| DOI | https://doi.org/10.1051/0004-6361/202244938 | |
| Published online | 29 September 2023 | |
BCD spectrophotometry for massive stars in transition phases★
1
Instituto de Astrofísica La Plata, CCT La Plata, CONICET-UNLP,
Paseo del Bosque s/n,
B1900FWA
La Plata, Argentina
e-mail: aidelman@fcaglp.unlp.edu.ar
2
Departamento de Espectroscopía, Facultad de Ciencias Astronómicas y Geofísicas, Universidad Nacional de La Plata (UNLP),
Paseo del Bosque s/n,
B1900FWA,
La Plata, Argentina
3
Observatório Nacional,
Rua General José Cristino 77,
20921-400
São Cristovão, Rio de Janeiro, Brazil
4
Sorbonne Université, CNRS, UPMC, UMR7095 Institut d’Astrophysique de Paris,
98bis Bd. Arago,
75014
Paris, France
5
Astronomical Institute, Czech Academy of Sciences,
Fričova 298,
251 65
Ondřejov, Czech Republic
Received:
9
September
2022
Accepted:
3
July
2023
Context. Stars in transition phases, such as those showing the B[e] phenomenon and luminous blue variables (LBVs), undergo strong, often irregular mass-ejection events. The prediction of these phases in stellar evolution models is therefore extremely difficult, if not impossible. As a result, their effective temperatures, their luminosities, and even their true nature are not fully known.
Aims. A suitable procedure to derive the stellar parameters of these types of objects is to use the BCD spectrophotometric classification system, which is based on the analysis of the Balmer discontinuity (BD). The BCD parameters (λ1, D) have the advantage that they are independent of interstellar extinction and circumstellar contributions.
Methods. We obtained low-resolution spectra for a sample of 14 stars with the B[e] phenomenon and LBVs. Using the BCD classification system, we derived the stellar and physical parameters. The study was complemented with the information provided by the JHK colour-colour diagram.
Results. For each star under investigation, the BCD system gives a complete set of fundamental parameters and related quantities such as luminosity and distance. Among the 14 studied stars, we confirmed the classification of HK Ori, HD 323771, and HD 52721 as pre-main sequence HAeB[e] stars, AS 202 and HD 85567 as FS CMa-type stars, and HD 62623 as sgB[e]. We also classified Hen 3- 847, CD-245721, and HD 53367 as young B[e] stars or FS CMa-type candidates, and HD58647 as a slightly evolved B[e] star. In addition, Hen 3–1398 is an sgB[e] and MWC 877, CPD–59 2854, and LHA 120-S 65 are LBV candidates. The stellar parameters of the latter two LBVs are determined for the first time. We also used the size-luminosity relation to estimate the inner radius of the dust disc around the pre-main sequence and main sequence B[e] stars.
Conclusions. Our results emphasise that the BCD system is an important and highly valuable tool with which to derive the stellar parameters and physical properties of B-type stars in transition phases. This method can be combined with near-infrared (NIR) colour-colour diagrams to determine or confirm the evolutionary stage of emission-line stars with dust discs.
Key words: stars: early-type / stars: fundamental parameters / stars: mass-loss / stars: winds / outflows / circumstellar matter
Based on data obtained at Complejo Astronómico El Leoncito, operated under agreement between the Consejo Nacional de Investigaciones Científicas y Técnicas de la República Argentina and the National Universities of La Plata, Córdoba and San Juan, Argentina, and at Observatório do Pico dos Dias, LNA, Brazil.
© The Authors 2023
 Open Access article, published by EDP Sciences, under the terms of the Creative Commons Attribution License (https://creativecommons.org/licenses/by/4.0), which permits unrestricted use, distribution, and reproduction in any medium, provided the original work is properly cited.
This article is published in open access under the Subscribe to Open model. Subscribe to A&A to support open access publication.
1 Introduction
Over the last few years, there have been huge advances in the description of the internal structure of stars thanks to the inclusion of ingredients such as rotation, diffusion, mixing, mass loss, new opacities, diverse metallicities, binarity, and so on (cf. Althaus et al. 2010; Ekström et al. 2012; Farrell et al. 2019). Nevertheless, despite the significant effort made to deepen our understanding of specific short phases in the life cycle of the stars, several of these transition states are still poorly understood. Among them are the stars showing the B[e] phenomenon and luminous blue variables (LBVs). At present, the occurrence of these types of objects cannot be predicted with stellar evolution models. Whether or not this failure is due to the lack of physical inputs in the stellar evolution models of single stars is unknown. This specific evolutionary state might be connected to phenomena occurring during binary star evolution, in particular the occurrence of mergers (Podsiadlowski et al. 2006; de Mink et al. 2013), but debate is ongoing. However, noteworthy in this respect is that post-interactive binary stars display strong similarities to either blue hypergiants or LBVs due to the presence of a dense circumstellar medium similar to that of B[e] stars resulting from a high mass-transfer rate (Farrell et al. 2019).
Stars with the B[e] phenomenon present strong Balmer emission lines in their optical spectrum, as well as forbidden and permitted emission lines of neutral and singly ionized metals. They also display a strong infrared (IR) excess and linear polarisation due to the presence of a dusty ring-like structure (Coyne & Vrba 1976). Furthermore, this group of objects is very heterogeneous in an evolutionary sense. Lamers et al. (1998) classified many objects exhibiting the B[e] phenomenon into categories such as pre-main sequence (pre-MS) intermediate-mass stars (Herbig Ae/B[e], HAeB[e]), evolved low-mass (compact planetary nebulae, cPNB[e]) and high-mass (supergiants, sgB[e]) stars, and also symbiotic systems (symB[e]). However, more than 50% of the Galactic objects with the B[e] phenomenon have an unclear nature; they are referred to as unclassified B[e] (unclB[e]) stars, and require further and more exhaustive exploration (Condori et al. 2019). From this last group, Miroshnichenko (2007) identified many stars with properties similar to those of FS CMa and proposed a new group: the FS CMa stars. These authors propose that they would be B[e] binary systems that are currently undergoing or have recently undergone a phase of rapid mass exchange, showing a spectrum dominated by the B-type star.
The B[e] phenomenon itself seems to be related to the presence of a very complex circumstellar environment around B-type stars. In general, these stars have dense equatorial discs, as was initially suggested by Zickgraf et al. (1985) and confirmed later with interferometric observations, for example by Domiciano de Souza et al. (2007), Meilland et al. (2010), Borges Fernandes et al. (2011), Cidale et al. (2012), and Varga et al. (2019). The great challenge in the study of stars with the B[e] phenomenon is to understand how they form their circumstellar envelope (CE) – each with very similar spectral characteristics – whilst going through such different evolutionary stages and, furthermore, how these CEs would subsequently evolve.
The other intriguing group of stars in a transition phase are the LBVs. These are post-main sequence massive objects characterised by intense and fast mass-loss events, usually called eruptions (Humphreys & Davidson 1994; Mehner et al. 2017; Campagnolo et al. 2018; Weis & Bomans 2020). The origin of these eruptions is not well known, but many studies have indicated an instability region in the upper Hertzsprung–Russell diagram (HRD). The LBVs located in this region would have high rotational velocities close to the critical speed (Wolf 1989; Clark et al. 2005; Groh et al. 2009). However, Groh et al. (2006) suggested the existence of two groups of LBVs in the Galaxy: one with high and another with low rotational speed.
As stars with the B[e] phenomenon and LBVs are deeply embedded in their circumstellar media, it is extremely difficult to assign their fundamental parameters and classify them. Quite often, sgB[e] stars are confused with LBVs in quiescence, which share very similar optical spectroscopic characteristics (Kraus 2019). Moreover, distances to many of the peculiar Galactic objects are not well known either, because their luminosity or parallax cannot be properly determined. Furthermore, low-luminosity Galactic sgB[e] stars often overlap with the most luminous massive pre-MS objects (HAeB[e]) and cannot easily be disentangled from each other (Kraus 2009). Therefore, to solve these issues, it is important to obtain precise stellar parameters not only for classification purposes but also as input to models of stellar evolution. Furthermore, although Gaia parallaxes have been determined for many peculiar Galactic objects, there are still significant differences between photometric and parallax distances for other OB Galactic stars (Shull & Danforth 2019), and therefore their luminosities remain poorly estimated. In addition, stars with the B[e] phenomenon have very extended circumstellar discs or envelopes, whose structure is variable and not necessarily symmetric. However, the radiation they emit can contribute significantly to the overall luminosity of the object, which can significantly change the position of the overall photo centre detected by Gaia, leading to deviations in the parallax estimation (Xu et al. 2019; Stassun & Torres 2021; Chiavassa et al. 2022).
A way to overcome these difficulties is to make use of the empirical BCD spectrophotometric classification system (Barbier & Chalonge 1941; Chalonge & Divan 1952), based on the analysis of the Balmer discontinuity (BD) among F- and B-type stars. One of the major advantages of this classification system is that the parameters that characterise the BD are independent of the interstellar extinction and the circumstellar contribution (extinction or emission, Zorec & Briot 1991). This system was already successfully applied to study not only stars with the B[e] phenomenon (Cidale et al. 2001) but also Be, Bn, and B supergiant stars (Zorec et al. 2005, 2009; Cochetti et al. 2020b). These latter authors also illustrated the application of the BCD system to stars showing a second component of the BD (in absorption or emission). This second BD (SBD) is produced in a low-density gaseous environment of some emission-line stars (Divan 1979); for more details see Aidelman et al. (2012, 2018, Sects. 3.1 and 5.1, respectively). In this work, we propose the use of the BCD spectrophotometric classification system to analyse mainly Galactic stars that either show the B[e] phenomenon or were identified as LBV candidates. Particularly, the selected stars have an uncertain classification or scarce data available.
The paper has the following structure: observations are described in Sect. 2; Sect. 3 introduces a summary of the BCD spectrophotometric classification system; Sect. 4 gives the obtained stellar parameters and describes the main results for each star; Sect. 5 presents a discussion and our conclusions. In Appendix A, previous studies on each star are briefly outlined.
2 Observations
We obtained low-resolution spectra of a sample of emission-line B-type stars using a Boller and Chivens spectrograph attached to the 2.15m Jorge Sahade telescope at the Complejo Astronómico El Leoncito (CASLEO), San Juan, Argentina. The spectra were taken on several runs from 2001 to 2012 (see Table 1). Two different setups were selected. Before 2011, we used a grating with 600 ℓ mm−1 (#80, blazed at 4000 Å), a PM 512 CCD detector, and slit widths of 250 µm and 350 µm (according to the average seeing at the CASLEO). The covered spectral wavelength interval ranges from 3500 Å to 4600 Å with an inverse linear dispersion of ~4.8 Å per two pixels (that is R ~ 1000 at ~4500 Å). In 2012, we selected a grating with 600 ℓ mm−1, a CCD detector TEK 1024, and a slit width of 350 µm, covering the spectral range between 3500 Å and 5000 Å. The inverse linear dispersion is ~5.2 Å per two pixels (R ~ 700 at ~4500 Å).
A subset of our program stars was observed with a Boller and Chivens spectrograph attached to the 1.6m Perkin-Elmer telescope at the Laboratório Nacional de Astrofísica (LNA), Brazópolis, Brazil. The data were taken on 2012, February 29, and April 11. The instrumental setup made use of a grating with 600 ℓ mm−1, a slit width of 400 µm, and a Marconi CCD 42-40-1-368 (2048 × 2048 pixels) detector, which provides an inverse linear dispersion of ~2.12 Å per two pixels (R ~ 2000 at ~4500 Å). The wavelength coverage of the spectra is 3500–5000 Å.
Spectra of He–Ne–Ar (CASLEO) and He–Ar (LNA) comparison lamps were acquired at the same sky position of every science target to perform the wavelength calibration.
All spectra were reduced with the IRAF1 software package following a standard procedure, such as bias and overscan subtraction, flat-field normalisation, and wavelength calibration. The flux calibration was performed by observing flux standard stars selected from Hamuy et al. (1994) on each night of observation.
From the whole sample of observed emission-line stars, we selected a subset of 14 stars that have a measurable Balmer jump to derive their fundamental parameters and analyse their evolutionary states. This star sample and the details of our observations are given in Table 1.
Journal of available spectra.
3 The BCD spectrophotometric classification system
The BCD spectrophotometric classification system developed by D. Barbier, D. Chalonge, and L. Divan (referred to as simply the ‘BCD system’, Barbier & Chalonge 1941; Chalonge & Divan 1952, 1973, 1977), is a very useful tool for an adequate classification of stars with spectral types between O9 and F9. It is based on four measurable parameters in the vicinity of the BD: the height of the Balmer jump (D), its mean position and two colour gradients (Φuv and Φb).
A summary of the BCD parameters is presented here. The parameter D is defined as
 (1)
(1)
where F+3700 is the flux determined by extrapolating the slope of the Paschen continuum at the position λ3700, and F−3700 is defined as the flux value towards which the highest members of Balmer series converge and is given by the intersection of the vertical line at λ3700 and the lower curve wrapping the Balmer line cores (see the upper panel of Fig. 3 in Aidelman et al. 2012). The parameter λ1 is defined by the intersection point between a parallel line to the Paschen continuum, traced at D/2, and the upper wrapping of the wings of the Balmer lines. Among dwarf stars, D ranges from near 0.0 dex to about 0.5 dex. The higher values correspond to the A3–4 spectral types, while the lower ones are roughly for O4-5-type stars (the hotter side) or the F9-type stars (the cooler side). For luminous blue supergiants, the Balmer jump is no longer seen in the B early spectral types (see Fig. 10 in Zorec et al. 2009).
The colour gradients are determined from observations using the definition provided by Allen (1976),
![${{\rm{\Phi }}_{{\rm{ab}}}} = - \ln \,{{\left[ {{{\lambda _{\rm{a}}^5\,F{\,_{{\lambda _{\rm{a}}}}}} \over {\lambda _{\rm{b}}^5\,F{\,_{{\lambda _{\rm{b}}}}}}}} \right]} \mathord{\left/ {\vphantom {{\left[ {{{\lambda _{\rm{a}}^5\,F{\,_{{\lambda _{\rm{a}}}}}} \over {\lambda _{\rm{b}}^5\,F{\,_{{\lambda _{\rm{b}}}}}}}} \right]} {\left( {{1 \over {{\lambda _{\rm{a}}}}} - {1 \over {{\lambda _{\rm{b}}}}}} \right)}}} \right. \kern-\nulldelimiterspace} {\left( {{1 \over {{\lambda _{\rm{a}}}}} - {1 \over {{\lambda _{\rm{b}}}}}} \right)}},$](/articles/aa/full_html/2023/10/aa44938-22/aa44938-22-eq2.png) (2)
(2)
where λa and λb are the edges of the selected wavelength ranges. Thus, Φuv and Φb, are determined in the wavelength range of 3150–3700 Å and 4000–1800 Å, respectively.
A detailed description of the BCD system, determination of the BCD parameters, and error estimates can be found in Zorec et al. (2009, 2023), Aidelman et al. (2012, 2018), and Aidelman (2017).
The height and position of the main BD are related to the physical properties of the stellar photospheres and allow us to derive the effective temperature (Teff), surface gravity (log g), and absolute visual (Mv) and bolometric (Mbol) magnitudes through empirical relations obtained by Zorec et al. (2009), Zorec & Briot (1991), and Zorec (1986). Furthermore, as there is a direct relationship between the BCD and the MK systems, it is also possible to derive the spectral type and luminosity class.
The slope of the Paschen continuum gives the extinction, Av = Rv E(B − V). For this purpose, we prefer to use the following expression for E(B − V) given by Aidelman et al. (2012),
 (3)
(3)
where Φbb and  , are the observed and intrinsic colour gradients in the wavelength range 4000–4600 Å, while Φb, and
  are the observed and intrinsic colour gradients for the interval 4000–4800 Å. The E(B − V) expression was obtained assuming that Rv = 3.1, which is the usual value for the diffuse interstellar medium (Cardelli et al. 1989; Schlafly & Finkbeiner 2011).
To perform all these measurements, we used the interactive code MIDE37002 written by Y. A. in Python language (Aidelman 2017). By fitting the Balmer and Paschen continua and the upper and lower envelopes of the Balmer lines, the code computes both the BCD and fundamental stellar parameters.
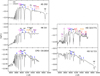 |
Fig. 1 Low-resolution flux-calibrated spectra taken in CASLEO and LNA for the sample of B[e] and LBV stars that present the BD, but the SBD is absent. The main spectral lines are highlighted. The flux units are erg cm−2 s−1 Å−1. |
4 Results
Figures 1 and 2 display the flux-calibrated spectra of the 14 stars that show a measurable Balmer jump. Typical lines identified in the B-type spectra are: H I, He I, Mg II, Ca II, Si II, Si III, Si IV, C II, and He II (for the hottest spectral types). Some other distinctive emission lines of Fe II, [Fe II], O II, Ti II, and so on are also indicated. The obtained BCD parameters from the observed BD are given in Table 2.
Only five stars show the typical photospheric BD: AS 202, HKOri, HD 52721, HD 323771, and CPD −592854 (see Fig. 1).
The peculiar star in the Large Magellanic Cloud (LMC), LHA 120–S 65, shows an SBD in emission, as is the case for the other six Galactic stars: Hen 3–847, Hen 3–1398 (very weak), CD–24 5721, HD 53367, HD 85567, and MWC 877. By contrast, in HD 62623 and HD 58647 the SBD is in absorption (see Fig. 2).
Table 3 lists the stellar parameters: spectral type (ST), Teff, log g, Φ0 ( or
or  as appropriate), Mv, and Mbol, which were derived from the pair (λ1, D); and the total absorption AV, which was computed with Eq. (3). The luminosity classes for stars with λ1 − 3700 > 70 Å are outside of the BCD spectral-type calibration and are indicated with a ‘V:’ in Table 3. On the other hand, as the BCD calibration for log g of early-type B supergiants has not yet been carried out; these values were estimated from the Teff–log g relationship found by Haucke et al. (2018, given in their Fig. 7).
An additional set of parameters is given in Table 4, such as the stellar luminosity in terms of the solar luminosity, log (L/L⊙); the inverse of the ‘flux-weighted gravity’, log (ℒ/ℒ⊙) where  (Langer & Kudritzki 2014); and the true distance modulus, (m − Mv)0 and the corresponding distance, d. Column 6 in Table 4 gives the distance, dG, to each star that results from the measured parallaxes by the Gaia mission, Early Data Release 3 (EDR3, Bailer-Jones et al. 2021), and the corresponding errors. Values of log(L/L⊙) were derived from Mbol.
BCD parameters of our star sample.
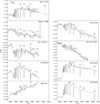 |
Fig. 2 Low-resolution flux-calibrated spectra taken in CASLEO and LNA for the sample of B[e] and LBV stars that present the BD and the SBD. The main spectral lines are highlighted. The flux units are in erg cm−2 s−1 Å−1. |
Stellar parameters obtained from the BCD system.
Additional set of stellar parameters for the star sample.
4.1 The Hertzsprung–Russell diagram
To analyse the results, the locations of the studied stars were plotted in the HRD (see Fig. 3, left panel) together with the evolutionary tracks computed with and without rotation (Ω/Ωc = 0.4 and Ω/Ωc = 0.0), respectively by Ekström et al. (2012). These values are compared with the luminosity expected from the Gaia distances (dG, grey symbols), which was obtained using the apparent magnitude mV from SIMBAD, the bolometric correction given by Flower (1996), and the colour excess E(B − V) derived from the BCD system. We also constructed a spectroscopic Hertzsprung-Russell diagram (sHRD, Langer & Kudritzki 2014), which can be seen in the right panel of Fig. 3. This diagram provides a distance-independent measurement of the stellar luminosity-to-mass ratio. This kind of diagram could help us to decipher the evolutionary stage of a star, particularly when it is ambiguous.
In the HRD, we find that most of the stars of our sample are in the main sequence (MS) or pre-MS stage, while only a few are evolved objects. Instead, in the sHRD, many stars appear to be more massive and evolved than in the classical HRD. In both diagrams of Fig. 3, stars HD 52721, HD 53367, HD 323 771, Hen 3–847, CD–24 5721, and AS 202 are located on the zero-age main sequence (ZAMS) or very near to it. The known mass discrepancy problem is briefly addressed in Sect. 5.2.
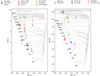 |
Fig. 3 Left: Hertzsprung—Russell diagram for the stars of our sample (coloured symbols). The grey circles indicate the positions of stars as if they were located at distances given by Gaia EDR3 (Bailer-Jones et al. 2021). The BCD and Gaia positions of the same object are connected with dotted lines. Evolutionary tracks with and without rotation (Ω/Ωç = 0.4 and Ω/Ωc = 0.0 in dotted and solid lines, respectively) were taken from Ekström et al. (2012). The positions of Hen 3–847 and AS 202 correspond to mean measurement values obtained at CASLEO and LNA. Right: spectroscopic Hertzsprung–Russell diagram. The dashed black line at log ℒ/ℒ⊙ = 4.6 corresponds to the Eddington luminosity limit for a hydrogen-rich composition (Langer & Kudritzki 2014). |
4.2 The JHK colour–colour diagram
We use the NIR JHK colour–colour diagram (shown in Fig. 4) as a supplementary tool to help us in our discussion of the controversial nature of the stars in our sample. There, we point out particular regions where B[e] supergiants (green box), LBVs (blue box), and Herbig Be/Ae stars with a moderate or large IR excess (orange box) are usually located (Cochetti et al. 2020a; Kraus 2019; Oksala et al. 2013). The NIR colours were corrected using the AV values derived from the BCD spectrophotometric system given in Table 4 and the reddening law was obtained from Wang & Jiang (2014).
For completeness, we also defined in the NIR colour–colour diagram the region where stars that present the Be phenomenon are located (box and symbols in cyan). We used 3374 Be stars taken from the literature3 to delimit this region. This region is contaminated with Herbig Ae/Be (HAeBe) stars that have a small NIR excess (Aidelman & Cidale 2023).
Based on the JHK true colours of the stars, we identify four stars (Hen 3–1398, HD 62623, CD-24 5721 and AS 202) in the region of the B[e] stars (mainly supergiants, Oksala et al. 2013); three stars (HD 52721, CPD-59 2854, and LHA 120–S 65) that are inside the LBV box; and four stars (HD 58647, HD 85567, HD 323 771, and HK Ori) that are among the HAeBe stars, although HD 58647 and HD 85567 are located in a region that is also shared by the B[e] supergiants. Finally, we identify three stars (Hen 3–847, HD 53367 and MWC 877) that are outside of the previously defined regions.
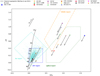 |
Fig. 4 Near-infrared colour–colour diagram. Apparent colours are marked by coloured symbols and true colours are represented by filled grey circles. Data for the same stars are connected with arrows. The thick grey line on the left defines the location of classical supergiants (Worthey & Lee 2011). |
4.3 Comments on individual objects
In previous sections, for each star of our sample, we analysed their low-resolution spectra, identified individual lines, and obtained the BCD parameters. Below we comment on our main results regarding the nature and stellar parameters of the studied stars. See Appendix A for details on previous studies.
Hen 3–847 (CD–487859, Vl028Cen, IRAS 12584–4837). This star has an uncertain evolutionary stage. Our low-resolution spectra show an SBD in emission, revealing the presence of a dense CE (see Fig. 2). The highest members of the Balmer series are in absorption. The Hγ line shows an incipient emission at its core, while the Hβ line (shown in the LNA spectrum) displays a broad photospheric absorption with a narrow central emission line. Emission lines of Fe II and [Fe II] are also present. From the spectra taken at different epochs, we derive similar BCD (λ1 D) parameters, although the colour gradients are slightly dissimilar because they are measured on spectra with different wavelength ranges. The mean stellar parameters are: Teff = 15 020 K and log g = 3.7 (see Table 3). These values are in excellent agreement with those found in the literature (see Table A.1).
We estimated a mean visual absolute magnitude of Mv = −1.13 mag, Av = 1.21 mag, and a distance of d ~ 1210 ± 180 pc. This latter value is in between the distances given by Verhoeff et al. (2012, d = 1660 pc) and Bailer-Jones et al. (2018,  ), but shows a large discrepancy with the new value listed in Gaia DR3
  .
.
Based on the location of the star in the HRD and sHRD (shown in Fig. 3), the star could be either a MS or pre-ZAMS star with an initial stellar mass of 5 M⊙ or 6 M⊙. However, the star is located outside of the HAeBe and sgB[e] regions in the NIR colour-colour diagram. Although the anomalous colours of this star are reminiscent of those observed in the FS CMa type objects (Miroshnichenko 2007), the star has not yet been confirmed as a binary system.
AS202 (Hen 3–174, IRAS 08307–3748, FXVel). Thelow-resolution spectra display mainly broad photospheric H lines in absorption that reveal an A0V star. We also identify weak He I lines.
The H and Ca II lines are variable. Particularly, the Hβ line profile presents a narrow and variable emission component at its core. This component seems to be weaker than the one reported by Miroshnichenko et al. (2007). No other emission lines are observed in the optical spectral range shown in Fig. 2.
Using the BCD spectrophotometric system, we classify the primary star as an A0-1 V spectral type located at a mean distance of 470 pc. The obtained spectral type agrees with the classification done by Eggen (1978) and Aldoretta et al. (2015), while the distance derived from the BCD parameters is somewhat greater than the one obtained from Gaia mission ( and
and  , Bailer-Jones et al. 2018, 2021, respectively). Based on the location of AS 202 in the HRD, it could either be a MS or a pre-MS star with an initial stellar mass of 2.3–3 M⊙ (see Fig. 3).
Hen 3–1398 (CPD–386814, MWC878, IRAS17213–3841, CD–3811837). The stellar spectrum shows the high members of Balmer lines in absorption. The core of Hγ, He II λ4686, and lines of Fe II and [Fe II] are in emission. Strong diffuse interstellar bands (DIBs) at λ4430 Å and λ4502 Å are present.
Based on our BCD results, the presence of a small BD (D = 0.02), and the location of the star inside the B[e] supergiant region in the NIR colour–colour diagram, we suggest that Hen 3–1398 is a massive B0-B1 Ia supergiant. The obtained Teff = 25 000 K and E(B − V) = 0.77 mag correspond to extrapolated values from the BCD calibration curves; they agree with those calculated by Carmona et al. (2010, 25 400 K and 0.74 mag). However, the spectral type of this star could be slightly earlier, namely O9 I, considering the presence of the very strong emission in the He II λ4686 line and uncertainties arising from the extrapolation. This line is a luminosity indicator in O-type stars (Conti & Leep 1974; Walborn 1977; Sota et al. 2014). Venero et al. (2002) showed that He II line profiles observed among OB stars can be attributed to different conditions in the stellar wind and their intensities are very sensitive to the gravity effect. From a theoretical point of view, the He II λ4686 line can be observed in emission also in B supergiant stars with Teff ~ 25 000 K.
The BCD absolute magnitude calibration for hot supergiants is not completed (for λ1 − 3700 < 30 Å), and extrapolating values for smThe BCD absolute magnitude calibration for hot supergiants is not completed (for λ1 − 3700 < 30 Å), and extrapolating values for small λ1 will introduce large errors. To estimate a rough distance to Hen 3–1398, we adopted the Mv value from Cox (2000). In this way, taking Mv = −6.43 mag, mv = 10.62 mag, and E(B − V) = 0.77 mag, the distance modulus is 14.53 mag this leads to a distance of 8536 ± 236 pc. Moreover, the presence of a strong DIB λ4430 can be consistent with high interstellar reddening, and therefore with a possible large distance.
HD 62623 (3Puppis, HR2996, IRAS 07418–2850). This star exhibits a spectrum dominated by H lines in absorption and has an important SBD in absorption (see Fig. 2) that reveals the presence of a prominent and dense circumstellar gaseous disc.
From the BCD system, we find that HD 62623 is a B9 Ib supergiant star (in accordance with Stephenson & Sanduleak 1971) with a large colour excess E(B − V) = 0.35 ± 0.06 mag. Then, assuming Mv = −6.25 mag (value taken from Cox 2000), for Rv = 3. 1, we calculate a distance modulus of 9.11 mag. This value gives a distance of 662 ± 54 pc, which is in excellent agreement with the distance obtained by Meilland et al. (2010, d = 650 ± 100 pc) and Bailer-Jones et al. (2018,  ) but disagrees with the Gaia EDR3 estimate
  . The NIR colours of the star support its nature as a B[e] supergiant in the JHK colour–colour diagram.
HK Ori (MWC 497, IRAS 05286+1207, TYC 709–857–1). The spectrum shown in Fig. 2 reveals weak lines of He I and Mg II, which are consistent with a B8V spectral type. The H lines are observed in absorption, but Hγ and Hδ are weak and might be partially filled in by emission. The [Fe II] lines are observed in emission. The G band is also present, supporting the presence of a cool secondary companion.
From the BCD classification system, we derived a spectral type B9V and a Teff = 11940 K, which are consistent with the He I features identified in the spectrum. These BCD stellar parameters agree with the spectral type and temperature obtained by Whittet et al. (1983) and Garrison (1978), respectively.
The NIR JHK colours put the star in the HAeBe region. Moreover, the locus of the star in the HRD is compatible with a pre-MS or MS star of 3–3.3 M⊙ at a distance of 630 pc. The location on the sHRD supports this result. The distance and stellar mass are somewhat greater than the values found in the literature (~460 pc, 1.7–2 M⊙, see Tables A.1 and A.2).
CD–245721 (Hen 3–52, ALS 612, IRAS 07370–2438). The observed Boller and Chivens spectrum displays He I lines in absorption whose intensities are consistent with an MK spectral type O8. The SBD is in strong emission, suggesting the star has a dense CE (see Fig. 2).
Using the BCD spectrophotometric system, we derived a Teff = 36600 K. We also estimated an initial stellar mass of 21 M⊙ and a distance of 4200 pc. Our spectral classification (O8 IV) agrees with that of Nordström (1975), but it does not match the previous BCD classification by Cidale et al. (2001), since the latter is based on measurements performed in a non-flux calibrated spectrum.
We find that this object to be located near the ZAMS (see Fig. 3). However, it presents NIR colours expected for sgB[e]s, as shown in Fig. 4. We return to a discussion of its nature in Sect. 5.
HD 85567 (CPD–601510, Hen 3–331, V596 Car). Our spectrum shows an SBD in emission, revealing the presence of a dense CE. The star presents broad H absorption lines with a narrow central emission. The He I lines are also in absorption, while the lines of Fe II and CaII are in emission.
The BCD system yields a B3 III star with a Teff = 20000 K, a value that is in very good agreement with those derived by Miroshnichenko et al. (2001) and Manoj et al. (2006). The star has NIR JHK colours, as typically expected for HAeBe stars and sgB[e] stars. This ambiguity is also evident in Fig. 3, where the object seems to be in the HRD as a MS star, while in the sHRD, it appears as an evolved star. We obtained a distance to the star of 913 pc, in excellent agreement with the measurement obtained from Gaia mission (Bailer-Jones et al. 2018, 2021,  and
and  , respectively) and that obtained by Fairlamb et al. (2015, d = 910 pc).
CPD–592854 (WRAY 15–689, IRAS 10538–5958). The Boller and Chivens spectrum around the BD exhibits intense hydrogen, helium, and O II absorption lines. Apart from the fact that the Hγ line seems to be filled in by emission, we do not observe any other emission feature in the observed spectral wavelength range.
Using the BCD system, we derive the stellar parameters of CPD–59 2854 for the first time (see Tables 3 and 4). We assign the star a B2 II spectral type, close to the classification by Graham (1970). In addition, the distance determined in this work (d = 3.505 ± 0.768 kpc) agrees very well with that estimated by Bailer-Jones et al. (2018, 2021,  and
and  , respectively). According to the locus of the star in the HRD and sHRD, the initial stellar mass might be 9–10 M⊙ or 20–25 M⊙, respectively. This last value is consistent with the fact that the star is inside the LBV region in the colour-colour diagram (see Fig. 4).
MWC 877 (HD 323154, CD–3811806, Hen 3–1393, IRAS 17197–3901). The blue region of the spectrum shows many narrow absorption lines of hydrogen and helium, while the cores of Hγ and the Fe II forest lines are seen in emission (see Fig. 2). The height of the Balmer jump is consistent with a spectral type B3 Ia, which is in excellent agreement with that reported by Vijapurkar & Drilling (1993). This star presents an SBD in emission and seems to be located in a region with a very anomalous interstellar extinction, that is, AV = 4.96 mag derived by the BCD. Consequently, the corrected JHK colours place the star outside (but nearby) the LBV region.
The stellar distance estimated through the BCD method (1.297 ± 0.046 kpc) is in excellent agreement with that derived from the Gaia parallax (Bailer-Jones et al. 2018,  ) but is lower than that reported from Gaia EDR3 (
 , Bailer-Jones et al. 2021).
The presence of an SBD and the location of the star in the NIR colour–colour and HRDs point to a supergiant star with a disc. We do not exclude the possibility that the star is an LBV candidate.
HD 323771 (CD–39 11602, Hen3–1425, IRAS 17306–3921). Our spectrum shows strong and broad H lines in absorption. In addition, these lines exhibit narrow emission components in their cores that are seen up to the end of the Balmer series. The star also presents very weak He I lines. The Ca II, Fe II, Ti II, and [Fe II] lines are in emission.
The BCD spectral type, B5 V:, is in very good agreement with that reported by Vieira et al. (2003) and Herbst (1975). Although, the latter proposed that the star is B5 or later. We derived a distance of 1432 ± 129 pc, which is greater than but still in fair agreement with the distance derived from Gaia DR2 and EDR3 (Bailer-Jones et al. 2018, 2021,  and
and  , respectively). Based on the features in the stellar spectrum, the BCD parameters, and the position of the star in the HR and JHK diagrams, we classify it as a HAeB[e] star of ~5.5 M⊙.
HD 52721 (GUCMa, MWC164, IRAS 06594–1113). The optical spectrum exhibits broad lines of H and He I. The Hβ line presents a weak emission in the core. Very small emission lines of the Fe II forest are present. The BCD parameters suggest a spectral type B2 V: with Teff = 27 361 ± 2611 K and log g = 4.4 at a distance d = 479 ± 76 pc. This distance was obtained considering that the star is a visual binary with a magnitude difference of ~0.7 mag (Aitken & Doolittle 1932). The effective temperature is higher than the values found in the literature, but the distance agrees with that reported by Fairlamb et al. (2015).
We also find that the star has anomalous JHK colours, which resemble those typically seen in LBV and Be stars (see Fig. 4). Its location in the HRD indicates that it is a young stellar object of 7 M⊙. This value is lower than that obtained by Fairlamb et al. (2015, 9.5 M⊙), which better agrees with the locus of the star in the sHRD.
HD 53367 (V750 Mon, MWC166, IRAS 07020–1022). The spectrum of this star displays He I and He II lines. All the lines are in absorption with the exception of the presence of a weak and narrow emission in the Hβ core. The SBD is in emission. The star is associated with a dark nebula but has a surface gravity more representative of evolved stars.
We derived a B0 III spectral type for the star. This very luminous and massive B[e] star is also located within the starforming CMa OB1 associationata distance of d = 1131 pc. This value is lower than the measurement provided by Gaia EDR3  , which is given with high uncertainty.
HD 58647 (BD–13 2008, IRAS 07236–1404). The star shows a spectrum with the Balmer lines and the Mg II λ4481 line in absorption. The star has a spectral type B9 IV and presents an SBD in absorption. This SBD could be related to the presence of the detected magnetosphere (Järvinen et al. 2019).
The BCD spectral type agrees well with that given by Jaschek et al. (1980). The distance obtained (295 ± 7.7 pc) is also in close alignment with the value reported by van den Ancker et al. (1998) and that given by Gaia EDR3 ( and 302 ± 2 pc, respectively).
The star is located within the ZAMS and has JHK colours consistent with those of Herbig Ae/Be or sgB[e] stars. The star also presents polycyclic aromatic hydrocarbon (PAH) bands (Acke et al. 2010).
LHA120–S65 (AL18, 2MASS J04470544–6816167). The spectrum of this star is shown for the first time. In the observed spectral region, it displays the He I lines and the highest members of the Balmer series in absorption. A few Fe II lines of permitted transitions are seen in emission (see Fig. 2). The Balmer jump corresponds to a B2 Ib star, showing an SBD in emission. The derived BCD stellar parameters are Teff = 22 000 K and log g = 2.6. Based on the locus of the star in the HRD and the JHK diagram, it could be an LBV in a quiescence phase.
The distance modulus derived here is a close match to the weighted mean distance modulus of the LMC, which is 18.477 ± 0.004 mag (d = 49.6 kpc; Pietrzyński et al. 2019). We note that the value reported in Gaia DR3 disagrees completely with that expected for the LMC.
5 Discussion
We studied low-resolution flux-calibrated spectra for a sample of 14 stars in transition phases showing the B[e] phenomenon and LBVs. These stars are usually deeply embedded in their circumstellar environments, rendering it difficult to derive proper stellar parameters and disentangle their evolutionary stage.
In this work, we used the BCD spectrophotometric classification system, which is independent of interstellar extinction and circumstellar contributions, and derived the stellar parameters. In addition, based on the loci of stars in the HRD, sHRD, and the JHK colour–colour diagram, we discuss their evolutionary stages.
5.1 Fundamental parameters
In general, the BCD system has proven to be a reliable tool for deriving the stellar parameters and physical properties of normal B-type stars and those with emission lines, such as Be, B[e], and LBV stars (Cidale et al. 2001; Zorec et al. 2005; Aidelman et al. 2018, among others). However, for stars showing the B[e] phenomenon, we cannot be completely sure that the BD corresponds only to some photospheric-like regions of the central star. In the same way, the spectroscopic lines of these complicated objects originate from both the stellar photosphere and circumstellar regions. Therefore, both techniques might not accurately reflect the intrinsic properties of the central object. Nevertheless, the BD is often less contaminated by circumstellar features than the optical part of the spectrum. The derived fundamental parameters may therefore better characterise the properties of the deep photospheric layers.
In the cases of interacting binary systems, the determination of the intrinsic properties of the stars is more complex. For example, a change of the spectral type from the blue to the red part of the spectrum might occur, as was reported by Strom (1983) in HKOri. This could also be the case for HD 62623. For this star, the BCD spectral type and effective temperature (B9 Ib and 11136 ± 318 K) are higher than the value obtained by Miroshnichenko et al. (2020, A3 I, Teff = 8500 K) who also derived the binary orbital parameters. The discrepancy might come from measurements made in different spectral ranges, epochs, and orbital phases. For instance, in the blue part of the spectrum (Fig. 1), the intensity of the Ca II K line relative to the hydrogen lines (in particular to Hϵ) is consistent with a B9 I spectral type (Gray & Corbally 2009). In addition, our spectrum exhibits weak lines of He I at λ 4026, 4143, and 4471 Å. However, the optical lines in the spectral range 4400–4600 Å are reminiscent of an A3 I star (Miroshnichenko et al. 2020). To help us in our discussion of the discrepancy found, we also analysed our spectrum with the University of Lyon Spectroscopic analysis Software4 (ULySS, Koleva et al. 2009), and obtained Teff = 10 392 ± 179 K and log g = 1.89 ± 0.05. These new values are also consistent with a spectral type B9 I (Cox 2000). We believe that the spectral type of the star depends on the spectral region analysed and that its spectrum also varies with the orbital phase.
Something similar could be occurring in the binary HD 85567, where the intensity of the BD leads to a Teff = 20000 ± 1639 K, while Khokhlov et al. (2017) obtained ~15 000 ± 500 K from the optical range. However, in both works, the derived luminosity for the star is the same.
Both HD 62623 and HD 85567 are good candidates for a more detailed study of their spectral variability as a function of orbital phase using the BCD classification system. This would allow us to discuss the influence of binarity in the determination of the fundamental parameters with the BCD method or the possible constraints on its use.
5.2 Evolutionary stage
(a) Pre-main sequence and main sequence stars:
In a recent work, Aidelman & Cidale (2023) confirmed three groups of HAeBe stars that present different amounts of NIR radiation excess using different reddening-free Q parameters. A group of HAeBes with small IR excess (Group I) share properties with LBVs and some classical Be (CBe) stars. These stars are located in the region bounded by −0.2 < (H − Ks) < 0.2 and −0.2 < (J − H) < 0.2 (Chen et al. 2016) and host huge amounts of cool dust at large distances from the star (Oksala et al. 2013). A second group with moderate IR excess (Group II) is located in the region shown in Fig. 4 as HAeBe. Their excesses of IR radiation probably indicate the influence of a bright nebula associated with low temperatures or thermal emission from the surrounding dust (Hillenbrand et al. 1992). Group III, with a large IR excess and hot dust (Oksala et al. 2013), shows similar properties to some sgB[e]s stars.
From the present study, we find nine stars located on the ZAMS or MS in the HRD region: Hen 3–847, HKOri, AS 202, CD–24 5721, HD 52721, HD 53367, HD 58647, HD 85567, and HD 323771. Some of these stars are associated with star-forming regions.
Considering the locations of HK Ori and HD 323771 in the HRD and NIR colour–colour diagram, they are HAeBe stars with moderate IR excess. This classification agrees with previous ones found in the literature (see Appendix A). In Table 5, we defined them as Group II HAeB[e] objects according to their NIR colours.
HD 52721 and HD 53367 have NIR colours typically seen among LBVs or CBe stars, as shown in Fig. 4. Both locations also coincide with the region delimited for the Group I HAeBe stars with less or no IR excess. As the HAeBes have masses of between ~2 M⊙ and ~15 M⊙ (Herbig 1960; Hillenbrand et al. 1992; Vioque et al. 2022), only HD 52721 fulfills the HAeBe classification criterion. Instead, HD 53367, which also belongs to a multiple system (Corporon & Lagrange 1999; Pogodin et al. 2006), has a mass of slightly higher than 15 M⊙ (Figs. 3 and 5), and the BCD classification system suggests it is a B0 Ill-type star. Therefore, we conclude it is a young massive B[e] star, likely of the FS CMa-type.
Regarding HD 58647 and HD 85567, both are located on the MS, as shown in Fig. 3, but they are not immersed in star-forming regions. On the other hand, their NIR colours locate them in the area shared by HAeBe and sgB[e] objects, suggesting processed circumstellar dust. It is also essential to address that the derived BCD distances are in very good agreement with the Gaia EDR3 ones, indicating that the spectral type and luminosity class derived in this work are plausible.
The last two stars, AS 202 and CD–24 5721, are reported as binaries or multiple systems (see Appendix A) and neither is associated with a star-forming region. Both stars, like HD 85567, are MS objects showing strong IR emission due to the presence of processed dust, as they share photometric properties with the sgB[e]. The dust emission could originate from mass-exchange binary interactions, as typically seen in the FS CMa objects. Furthermore, considering the location of CD–24 5721 in the HRD, which is near the ZAMS, it is a massive star that might undergo rejuvenation.
b) Evolved stars:
According to the BCD classification, we find five stars (Hen 3–1398, HD 62623, CPD–59 2854, MWC877, and LHA 120–S 65) that evolved from the MS and are located in the supergiant region (see Fig. 3). Two of them, HD 62623 and Hen 3–1398, also lie in the sgB[e] region in the colour–colour diagram, and therefore we accept them as sgB[e]. The other three stars (CPD–59 2854, LHA 120–S 65, and MWC 877) were classified as LBV candidates according to the BCD spectral types and NIR colours. Finally, Table 5 summarises the proposed evolutionary classification scheme for our studied star sample. The young stellar objects are plotted in Fig. 5, where the pre-MS evolutionary tracks are from Haemmerlé et al. (2019).
Evolutionary stage determined in this work for the stars in our sample.
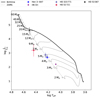 |
Fig. 5 Location of the young stellar objects in the HRD. Pre-MS evolutionary tracks are from Haemmerlé et al. (2019). The ZAMS (dotted line) and birth line (solid line) are also plotted. Numbers refer to the stellar masses (in solar masses) when reaching the ZAMS. |
5.3 HRD versus sHRD
The initial masses derived from the HRD and the pre-MS evolutionary tracks are very similar. In addition, when comparing the locations of our stars in the HRD and sHRD, we find that stars with initial masses lower than around 10 M⊙ lead to similar masses in both diagrams (at least the observed discrepancy is of the order of 1 M⊙). However, the mass discrepancy becomes significant for stars with masses above 10 M⊙.
A plausible explanation for this discrepancy might be attributed to binarity. This could be the case for HD 53367, which is reported as a multiple system (see Fig. 3). Supporting this idea, Burkholder et al. (1997) found good agreement between evolutionary and dynamical masses up to 25 M⊙. These authors also concluded that in semidetached or contact binary systems, the derived mass for each component is significantly lower than that expected from single-star evolutionary models, suggesting that the mass lost from each star is generally not accreted onto the companion. However, the same authors pointed out that for larger masses, both the HRD and sHRD would have limited applicability – because of the lack of precise distance and inclination determinations, or because the systems fill (or overfill) their Roche lobes – and would be valid only for the study of single stars. Therefore, overall, for low- and intermediate-mass stars, one can use the spectroscopically determined effective temperature and gravity to obtain the stellar mass-to-luminosity ratio, with both HRD and sHRD being adequate (Langer & Kudritzki 2014).
For the case of our LBV candidates and sgB[e] stars, the HRD indicates a mass clearly below the value given in the sHRD. According to Langer & Kudritzki (2014), both diagrams can be used together to identify overluminous stars. These authors explained that the discrepancy could be due to an additional mass-loss process not accounted for in the single-star evolutionary tracks or an unusual mixing process inside the star. Castro et al. (2018) also observed mass discrepancies in their analysis of massive stars in the Small Magellanic Cloud. These authors found that the stellar masses derived from the sHRD for Be and most luminous stars are systematically higher than those obtained from the conventional HRD. These authors suggested that the well-known spectroscopic mass-discrepancy problem may be linked to the fact that both groups of stars have outer envelopes that are nearly gravitationally unbound. When considering the previous discussion, the initial masses related to the position in the sHRD of our LBV candidates (CPD–59 2854, MWC 877 and LHA 120–S 65) seem to be more adequate compared with the typical values given by Smith (2017).
5.4 The size–luminosity relation
Interferometric studies have revealed that, for most HAeBe stars, there is a correlation between the inner size of the dust disc (rin) and the stellar luminosity (cf. Marcos-Arenal et al. 2021). There are two main models that propose a linear relationship between log rin and log (L/L⊙). The magnetospheric accretion scenario (optically thin-MA model, Uchida & Shibata 1985; Shu et al. 1994) suggests that the stellar magnetic field connects the optically thin gas discs with the central star. In this model, gaseous discs are inner to dust discs. In this scenario, the correlation  was probed through the spatially resolved NIR continuum emission (Monnier et al. 2005; Ababakr et al. 2016). Although the found correlation shows significant scatter, the characteristic size of a given source seems to be directly related to the radius of dust sublimation of relatively large grains (~1 µm), with sublimation temperatures in the range of 1000–2000 K.
The second model consists of an optically thick gas disc that partially shields the stellar radiation, allowing the dust to survive closer to the star, and therefore decreasing the value of rin. This gaseous disc could reach the stellar surface and directly accrete through a hot, dense boundary layer. This is called the ‘optically thick-BL model’ (Hillenbrand et al. 1992).
In this subsection, we estimate and discuss the dust disc inner sizes (rin) of our star sample classified as HAeB[e], young massive stars, and MS stars (Table 5) from the BCD stellar luminosity. Table 6 lists the rin values for the upper and lower limits using thin MA and thick BL models (see Fig. 3 and formulae in Marcos-Arenal et al. 2021). Mean values are given in brackets.
Mainly, HD 85567 was observed with AMBER/VLTI by Vural et al. (2014). These authors modelled the observations with geometric ring models with inner radii approximately three to five times smaller than that predicted from an optically thin disc model. They note that their result further supports the existence of an optically thick gaseous inner disc shielding the stellar radiation. Therefore, using the size-luminosity correlation for the optically thick BL model, we estimate a mean rin ~ 0.95 AU which fits within the interval 0.8–1.6 AU obtained with the AMBER instrument.
HD 58647 is another object with continuum K-band interfer-ometry listed in the work of Marcos-Arenal et al. (2021). The BCD luminosity for this star (log(L/L⊙) = 2.39) predicts a mean value of log rin = −0.3 for the optically thick BL model, which is a relatively close match to the small measured log rin = −0.29 reported in this latter work.
HD 52721 is one of the nearest objects of our sample. According to the size-luminosity relation, the expected mean inner radius of its dust disc is rin ~ 0.76 AU or rin ~ 5.26 AU for optically thick BL and optically thin MA models, respectively. Together with HD 323771 (rin ~ 0.55 AU for a thick-BL model), both stars are good candidates to study their circumstellar discs with optical interferometry.
Finally, it is interesting to note that if we assume that the size-luminosity relation for HAeBe stars also holds for sgB[e]s, we obtained for HD 62623 a rin between 1.6 AU (lower limit) and 4.2 AU (upper limit) for the optically thick-BL model. This upper limit estimate is compatible with the gaseous disc radius (4.7–5 AU) derived by Maravelias et al. (2018) by fitting forbidden optical emission lines and NIR CO emission bands using a Keplerian rotating disc model (Kraus et al. 2007, 2000). These rin values are also comparable with that estimated by Stee et al. (2004, rin = 15−20 R⋆). Thus, the size-luminosity relation should be explored in the context of evolved B[e] stars with interferometric measurements, for which the dusty discs are formed most likely from equatorially outflowing dense wind material (e.g. Borges Fernandes et al. 2007).
Estimations of inner radii of dust discs for MS and HAeB[e] stars using the optically thin MA and optically thick BL models.
6 Conclusions
The BCD system has proven to be an easy-to-use tool to derive the parameters and physical properties of stars displaying the B[e] phenomenon and LBVs. We supplemented this information with the NIR colour–colour diagram, which is especially useful for revealing the nature of stars in transition phases. We derived the spectral types and luminosity classes of all of the 14 stars in our sample.
Among these objects, we confirmed the classification of HK Ori, HD 323771, and HD 52721 as pre-MS HAeB[e] stars (the first two show moderate NIR radiation excess while the latter shows only a very small amount), AS 202 and HD 85567 as FS CMa-type stars, and HD 62623 as sgB[e]. We classified Hen 3–847, CD–24 5721, and HD 53367 as young B[e] stars or FS CMa-type candidates, and HD 58647 as a slightly evolved B[e] star. In addition, Hen 3–1398 is an sgB[e] and MWC 877, CPD–59 2854, and LHA 120-S 65 are LBV candidates. The stellar parameters we obtained for these two latter LBVs are new and without precedent.
In addition, using the size-luminosity relation, we estimated the inner radii expected for the dust discs around the young objects and provide suitable candidates for spectro-interferometric observations.
Acknowledgements
This research has made use of a) the SIMBAD database, operated at CDS, Strasbourg, France, operated at the Department of Theoretical Physics and Astrophysics of the Masaryk University, and the NASA Astrophysics Data System (ADS); b) data from the European Space Agency (ESA) mission Gaia (https://www.cosmos.esa.int/Gaia), processed by the Gaia Data Processing and Analysis Consortium (DPAC, https://www.cosmos.esa.int/web/Gaia/dpac/consortium), and BeSS database (operated at LESIA, Observatoire de Meudon, France: http://basebe.obspm.fr). Funding for the DPAC has been provided by national institutions, in particular, the institutions participating in the Gaia Multilateral Agreement. YJA, MLA and AFT thank the financial support from CONICET (PIP 1337), and the Universidad Nacional de La Plata (Programa de Incentivos 11/G160), Argentina. MBF acknowledges financial support from the National Council for Scientific and Technological Development – CNPq – Brazil (grant number: 307711/2022-6). MK acknowledges financial support from the Czech Science Foundation (GA ČR 20-00150S). The Astronomical Institute Ondřejov is supported by RVO:67985815. YRC acknowledges support from a CONICET fellowship. This project has received funding from the European Union’s Framework Programme for Research and Innovation Horizon 2020 (2014-2020) under the Marie Skłodowska-Curie Grant Agreement No. 823734.
Appendix A Brief summary of each star in the sample
Below we provide a brief summary of the descriptions that we find in the literature for the objects of our sample. Previous reported stellar parameters are summarised in Tables A.1 and A.2.
Hen 3–847: This star was included in the list of southern emission-line stars of Wray (1966) and Henize (1976). It was considered as pre-MS HAeBe star by Thé et al. (1994); de Winter et al. (2001); Valenti et al. (2003), and more recently by Verhoeff et al. (2012) and Fairlamb et al. (2015). Based on IRAS and IUE data respectively, Parthasarathy (1993) and Gauba & Parthasarathy (2003) considered Hen 3–847 to be a post-AGB candidate, although the latter authors did not rule out the possibility that the star is a massive young OB supergiant. The spectral data and the spectral energy distribution (SED) of Hen 3–847 indicate that it has a high effective temperature and presents both warm and cold circumstellar dust (Gauba & Parthasarathy 2003, 2004). Lagadec et al. (2011) recognised this star as a proto-planetary nebula and showed that its circumstellar medium cannot be resolved by VLT/VISIR images. The star was classified as an unclB[e] star by Lamers et al. (1998).
The stellar mass and radius were determined by Verhoeff et al. (2012,6.2 ± 1.2 M⊙, 5.9 ± 0.6 R⊙) and Fairlamb et al. (2015, 4.7 M⊙, 4.5 R⊙) who, in addition, estimated an age for the star of 0.59 Myr. In more recent work, Arun et al. (2019) derived a stellar mass of 2.93 M⊙ and an age of 2.28 Myr making use of the Gaia parallax.
AS 202: This object was cited as having bright Hα emission (Merrill & Burwell 1950) and was classified as an early-type emission line star with a large far-infrared (FIR) excess (Thé et al. 1994). de Winter et al. (2001) listed it as a possible HAeBe star. The star exhibits optical photometric variability (Strohmeier et al. 1968) and is reported as an eclipsing binary of spectral type B9III-IV with a period of 1.0526 days (Eggen 1978; Malkov et al. 2006), but Tisserand et al. (2013) assigned this star a spectral type of A3III. Miroshnichenko et al. (2007) proposed that AS 202 displays the B[e] phenomenon (based on the presence of [O I] emission lines) and classified it as a FS CMa binary system with components of spectral type A+K. Recently, Condori et al. (2019) not only derived the stellar parameters but also found indications for a binary system – with a low-mass star and a cool companion – associated with a circumbinary disc or ring.
Hen 3–1398: This star is listed in the catalogues of Merrill & Burwell (1949) and Henize (1976). It was classified as a nova (Henize & Haro 1961) when the star reached its maximum brightness in 1949. Observations made by Guglielmo et al. (1993) show the presence of a large NIR excess due to warm dust, which contains a weak silicate 10 µm emission feature (Volk et al. 1991). Thé et al. (1994) classified the object as a B[e] star and Miroshnichenko et al. (2001) suggested the classification of a hot and luminous MS O9/B0 star with warm dust.
Based on new high-resolution spectra, Carmona et al. (2010) provided new estimations for the stellar parameters (see Tables A.1 and A.2) and suggested that it would be an isolated pre-MS HAeBe star. These authors also reported Balmer emission lines (Hα, Hβ, and Hδ) and double-peaked broad He I and He II emission lines. Narrow forbidden emission lines of [O I], [O III], [N II], and [S III] dominate the optical spectrum. The star has a low projected rotational velocity (v sin i = 50 km s−1, Miroshnichenko et al. 2001), a mass of 20 ± 4 M⊙, and a radius of 8.9 ± 0.8 R⊙ (Verhoeff et al. 2012).
HD 62623: This object was classified in the Yale Bright Stars Catalogue (Hoffleit & Jaschek 1982) as an A2 Iabe star. A detailed optical analysis of its spectrum was carried out by Chentsov et al. (2010), who derived a spectral type of A2.7±0.3 Ib, making it the only sgA[e] in our Galaxy (Meilland et al. 2010). Its binary nature was reported for the first time by Johnson & Neubauer (1946) and confirmed later by several authors (Iriarte 1965; Levato 1972; Hinkle 1987; Rovero & Ringuelet 1994; Plets et al. 1995; Miroshnichenko 2007; Millour et al. 2011). According to Miroshnichenko et al. (2020), this binary system evolved from a 6.0 + 3.6 M⊙ pair with an initial orbital period of ~5 days, experienced an almost conservative mass transfer, and is currently observed as a 0.8 + 8.8 M⊙ object with the B[e] phenomenon. The current derived orbital period is 137.4 ± 0.1 days.
Interferometric observations of HD 62623 revealed a gaseous and dusty circumstellar environment (Bittar et al. 2001; Stee et al. 2004). The dusty and gaseous emission components were disentangled by modelling VLTI/MIDI and VLTI/AMBER observations assuming Keplerian rotation (Millour et al. 2011).
Based on the analysis of the observed double-peaked emissions in [O I], [Ca II], and Hα lines, Aret et al. (2016) found that the high-density gaseous disc is detached from the star. This gaseous structure is surrounded by a CO and SiO molecular emitting disc, also in Keplerian rotation, located in turn inside the dusty extended disc (Maravelias et al. 2018).
Ranges for the stellar mass (9 – 19 M⊙) and radius (55 – 82 R⊙) were derived by Rovero & Ringuelet (1994); Snow et al. (1994); Hohle et al. (2010); Meilland et al. (2010); Tetzlaff et al. (2011). The projected rotational velocity is around 70 - 80 km s−1 (Levato 1972; Sreedhar Rao & Abhyankar 1991; Snow et al. 1994). Tetzlaff et al. (2011) calculated an age of 8.3 ± 0.1 Myr for this star.
HK Ori: This object is associated with a nebulosity (Bidelman 1954) and has been classified as a pre-MS HAeBe star (Herbig 1960) or a HAeB[e] star (Lamers et al. 1998). Strom (1983) found a variation of the spectral type from the blue to the red part of the spectrum and suggested a combined spectrum of A+F stars. Later, HK Ori was resolved as a binary system with NIR speckle interferometry by Leinert et al. (1997), who reported the presence of a second component of T Tauri type. Furthermore, according to Baines et al. (2004), the spectral, photometric and polarimetric properties as well as the variability observed in the system indicate that the active object is a G-type T Tauri star with UX Ori characteristics.
Hillenbrand et al. (1992) and Fairlamb et al. (2015) calculated stellar masses of 2 M⊙ and 1.7 M⊙ for HK Ori, respectively. The former also derived a radius of 1.7 R⊙. Smith et al. (2005) suggested that the primary component (A) has a CE and derived the following parameters for the system: RA = 1.55 R⊙, MA = 2 M⊙,  , and RB = 4.1 R⊙, MB = 1 M⊙,
  . For the CE surrounding the primary component, these authors calculated a disc inner radius of 31 R⊙ and an outer radius of 30 AU. The age of this star was determined by Testi et al. (1998, 7.5 Myr) and Fairlamb et al. (2015, 8.73 Myr).
CD–24 5721: Merrill & Burwell (1950) were the first to report an Ha line in emission for this object. The star presents a large IR excess (Allen 1974), H lines with P Cygni profiles, and forbidden emission lines (Allen 1976). It was classified as an unclB[e] star by Lamers et al. (1998).
Miroshnichenko et al. (2003) suggested that it is a binary system that belongs to a group of Be stars with warm dust (nowadays called FS CMa stars, Miroshnichenko 2007). These authors derived a distance to the star of 3.5 kpc and estimated that it rotates at a projected rotation velocity of 200 km s−1. Lee et al. (2016) also suggested that it is an evolved star that belongs to the FS CMa group.
HD 85567: This star has been widely studied, but its evolutionary state is still debated. Some authors suggested that the star is a pre-MS HAeBe (Oudmaijer et al. 1992; Thé et al. 1994) while others considered it as a B[e] interacting binary (Miroshnichenko et al. 2001).
Tables A.1 and A.2 show the stellar parameters found in the literature. The spectral classification ranges from B2 to B9 and the star has a low rotational speed, υ sin i = 31 – 50 km s−1 (Khokhlov et al. 2017; Corporon & Lagrange 1999; Miroshnichenko et al. 2001). The stellar mass determinations are: larger than 6 M⊙ (Manoj et al. 2006), 12 ± 2 M⊙ (Verhoeff et al. 2012, and a stellar radius of 9 ± 2 R⊙), and  M⊙ (Fairlamb et al. 2015, and a stellar radius of
  R⊙). In addition, there are two age determinations, t < 0.01 Myr and
  Myr (Manoj et al. 2006; Fairlamb et al. 2015, respectively).
Malfait et al. (1998) proposed that the star has a double dust disc, and Wheelwright et al. (2013) concluded that it is a young stellar object (YSO) with an optically thick gaseous disc within a larger dust disc that is being photo-evaporated from the outer edge. The inner ring-fit radius has 0.8 – 1.6 AU (Vural et al. 2014). Additional temperature-gradient modelling resulted in an extended disc with an inner radius of  AU, a high inner temperature of
  K, and a disc inclination of
  In contrast, the SED analysis performed by Lee et al. (2016) reveals an inner envelope with a size smaller than AU, at a temperature of 600 K, and an outer envelope edge of 5 AU at 300 K. Khokhlov et al. (2017) argued that the circumstellar gas and dust were more likely produced during the evolution of the object as a binary system (containing an undetected secondary component) than as the product of a merger.
CPD–59 2854: This star is located at the southern tip of the G289.0–0.3 cloud complex, a prominent peripheral cloud in the field of view of the Carina Nebula region. Herschel maps reveal CPD–59 2854 as a bright compact FIR source surrounded by dust, with temperatures of about 18 K and 25 K (Roccatagliata et al. 2013).
The star was included in many catalogues of emission-line stars (Wray 1966; Stephenson & Sanduleak 1971; Jaschek & Egret 1982) and stars with a strong IR excess (Dong & Hu 1991). Graham (1970) classified it with a spectral type of B3IIIe, and derived a MV = −2.9 mag and d = 2.2 kpc, while Bailer-Jones et al. (2018) placed it at  kpc. Vijapurkar & Drilling (1993) classified this star as a B3Iab star, Thé et al. (1994) considered it to be part of the group of extreme emission-line objects, and de Winter et al. (2001) listed it as a B[e] star.
MWC 877: The star is listed in many catalogues and surveys of emission-line stars (e.g., Merrill & Burwell 1949; Wray 1966; Henize 1976; Drilling & Perry 1981; Jaschek & Egret 1982; Kozok 1985; Vijapurkar & Drilling 1993; Thé et al. 1994; Dong & Hu 1991, among others). According to the intensity of the optical absorption lines of He I and singly ionised atoms, Carmona et al. (2010) classified this star with the spectral type B4 IIe. Stellar parameters found in the literature are given in Table A.2.
HD 323 771: This star was classified as a Bep shell star by Herbst (1975). It is associated with a moderated surface brightening nebula of type II (van den Bergh & Herbst 1975). From the optical photometry, Kozok (1985) derived an interstellar colour excess of E(B − V) = 0.4 and a distance d = 2 kpc, which is twice the value obtained by Bailer-Jones et al. (2018).
Merrill & Burwell (1950) were the first to observe a bright Hα line of moderate intensity. The spectrum shows H lines with P Cygni profiles and Fe II emission lines (Herbst 1975). Persi et al. (1991) reported the presence of a stellar wind with a velocity of 250 – 350 km s−1 and an upper limit for the mass-loss rate of 2 × 10⁻¹⁰ M⊙ yr−1. These authors also estimated a temperature of 1 500 K for the extended dust CE.
Both Persi et al. (1991) and Gregorio-Hetem et al. (1992) identified HD 323771 as a pre-MS Herbig Ae star while Dufton et al. (2001) proposed that the red spectrum has characteristics reminiscent of planetary nebulae.
HD 52721: This star is one of the brightest and most massive objects in the CMa R1 association. According to Johnson (1955), this is the central star of the faint nebula S 169. van den Bergh (1966) noted reflection nebulosity and emission from a faint circular disc. Finkenzeller & Mundt (1984) noted that the reflection nebula is located in a region of general obscuration as required for Herbig Be stars. However, HD 52721 has IR colours and a (weak) IR-excess as a CBe, which makes its membership in the Herbig Be stars doubtful.
The star is known as a visual binary (ADS 5713, Aitken & Doolittle 1932) with a separation of 1″.6 and a magnitude difference of ~0.7 mag. It is also an eclipsing system with an orbital period of 1.61 days (Pogodin et al. 2011). Shokry et al. (2018) concluded that the system is a semidetached one, with a secondary evolved from the MS. More recently, Obolentseva et al. (2021) identified the star as a quadruple system using speckle interferometry.
HD 52721 has been classified as an emission-line star of spectral type B2Vne (Guetter 1968; Whittet & van Breda 1980), B3e (Merrill & Burwell 1933), B1 Vne (Herbst et al. 1982), and as an early-type star with a circumstellar shell (Skiff 2014). The spectrum shows broad hydrogen absorption lines but those of He I are fairly narrow and variable in strength (Copeland & Heard 1963). The Hβ line is extremely broad with a variable emission at its centre (Claria 1974; Herbst et al. 1978).
Recently, Zasche et al. (2020) roughly estimated the angular distance of the predicted third component (~40 mas) and found that the eclipse timing variation (ETV) modulation has a period of about 19.7 years.
HD 53367: This star is situated at the border of the constellation of Monoceros and is immersed in the Seagull Nebulae IC 2177. It has IR excess indicative of a circumstellar shell (Herbst et al. 1978) and shows signs of cool dust in the form of a FIR excess (Tjin A Djie et al. 2001). The circumstellar material produces a reddening E(B − V) ~ 0.55 along the line of sight but without any contribution to the diffuse band strengths.
HD 53367 was included in the young HAeBe star list as a B0IV:e by Herbig (1960). It displays emission lines in the visual spectrum, including Ha as the brightest one (Pogodin et al. 2006) and shows long-term cyclic photometric variability (P ~ 9 years). In addition, the star is part of a triple star system, showing significant radial velocity variations with a P ~ 166 days and an orbital eccentricity e ~ 0.18 (Corporon & Lagrange 1999) or P ~ 183 days and e ~ 0.28 (Pogodin et al. 2006). The system consists of a massive (~20 M⊙) primary B0e star in the MS (if not later) stage and a pre-MS secondary object of M ~ 4 – 5 M⊙ with a mean distance of about 1.7 AU between them.
HD 58647: The star was reported as an early emission line star by MacConnell (1981) and then classified as a B9 IV (Houk & Smith-Moore 1988) Herbig star with a large IR excess (Oudmaijer et al. 1992). Guzmán-Díaz et al. (2021) and Marcos-Arenal et al. (2021) derived the stellar parameters (see Table A.1) and an interferometric size for this object, respectively. A longitudinal magnetic field of 209 G was also detected (Järvinen et al. 2019). The interferometric data and the observed Brγ profile can be well reproduced with a disc wind model with its inner radius located just outside of a small magnetosphere (Kurosawa et al. 2016).
LHA 120–S 65: This star has barely been studied. It was included in the list of Hα emission stars in the LMC by Henize (1956) and Andrews & Lindsay (1964).
Stellar parameters for our sample of stars taken from the literature.
Stellar parameters for our sample of stars taken from the literature.
References
- Ababakr, K. M., Oudmaijer, R. D., & Vink, J. S. 2016, MNRAS, 461, 3089 [CrossRef] [Google Scholar]
- Abt, H. A. 2004, ApJS, 155, 175 [NASA ADS] [CrossRef] [Google Scholar]
- Acke, B., Bouwman, J., Juhász, A., et al. 2010, ApJ, 718, 558 [Google Scholar]
- Aidelman, Y. J. 2017, Bol. Asoc. Argentina Astron. Plata Argentina, 59, 13 [NASA ADS] [Google Scholar]
- Aidelman, Y., & Cidale, L. S. 2023, Galaxies, 11, 31 [NASA ADS] [CrossRef] [Google Scholar]
- Aidelman, Y., Cidale, L. S., Zorec, J., & Arias, M. L. 2012, A&A, 544, A64 [NASA ADS] [CrossRef] [EDP Sciences] [Google Scholar]
- Aidelman, Y., Cidale, L. S., Zorec, J., & Panei, J. A. 2018, A&A, 610, A30 [NASA ADS] [CrossRef] [EDP Sciences] [Google Scholar]
- Aitken, R. G., & Doolittle, E. 1932, New General Catalogue of Double Stars within 120° of the North Pole [Google Scholar]
- Aldoretta, E. J., Caballero-Nieves, S. M., Gies, D. R., et al. 2015, AJ, 149, 26 [Google Scholar]
- Alecian, E., Wade, G. A., Catala, C., et al. 2013, MNRAS, 429, 1001 [NASA ADS] [CrossRef] [Google Scholar]
- Allen, D. A. 1974, MNRAS, 168, 1 [CrossRef] [Google Scholar]
- Allen, C. W. 1976, Astrophysical Quantities (London: Athlone) [Google Scholar]
- Althaus, L. G., Córsico, A. H., Isern, J., & García-Berro, E. 2010, A&ARv, 18, 471 [NASA ADS] [CrossRef] [Google Scholar]
- Andrews, A. D., & Lindsay, E. M. 1964, Irish Astron. J., 6, 241 [NASA ADS] [Google Scholar]
- Aret, A., Kraus, M., & Šlechta, M. 2016, MNRAS, 456, 1424 [NASA ADS] [CrossRef] [Google Scholar]
- Arun, R., Mathew, B., Manoj, P., et al. 2019, AJ, 157, 159 [Google Scholar]
- Bailer-Jones, C. A. L., Rybizki, J., Fouesneau, M., Mantelet, G., & Andrae, R. 2018, AJ, 156, 58 [Google Scholar]
- Bailer-Jones, C. A. L., Rybizki, J., Fouesneau, M., Demleitner, M., & Andrae, R. 2021, AJ, 161, 147 [Google Scholar]
- Baines, D., Oudmaijer, R. D., Mora, A., et al. 2004, MNRAS, 353, 697 [NASA ADS] [CrossRef] [Google Scholar]
- Barbier, D., & Chalonge, D. 1941, Ann. Astrophys., 4, 30 [NASA ADS] [Google Scholar]
- Bidelman, W. P. 1954, ApJS, 1, 175 [NASA ADS] [CrossRef] [Google Scholar]
- Bittar, J., Tuthill, P., Monnier, J. D., et al. 2001, A&A, 368, 197 [NASA ADS] [CrossRef] [EDP Sciences] [Google Scholar]
- Borges Fernandes, M., Kraus, M., Lorenz Martins, S., & de Araújo, F. X. 2007, MNRAS, 377, 1343 [NASA ADS] [CrossRef] [Google Scholar]
- Borges Fernandes, M., Meilland, A., Bendjoya, P., et al. 2011, A&A, 528, A20 [NASA ADS] [CrossRef] [EDP Sciences] [Google Scholar]
- Burkholder, V., Massey, P., & Morrell, N. 1997, ApJ, 490, 328 [NASA ADS] [CrossRef] [Google Scholar]
- Campagnolo, J. C. N., Borges Fernandes, M., Drake, N. A., et al. 2018, A&A, 613, A33 [NASA ADS] [CrossRef] [EDP Sciences] [Google Scholar]
- Cardelli, J. A., Clayton, G. C., & Mathis, J. S. 1989, ApJ, 345, 245 [Google Scholar]
- Carmona, A., van den Ancker, M. E., Audard, M., et al. 2010, A&A, 517, A67 [NASA ADS] [CrossRef] [EDP Sciences] [Google Scholar]
- Castro, N., Oey, M. S., Fossati, L., & Langer, N. 2018, ApJ, 868, 57 [NASA ADS] [CrossRef] [Google Scholar]
- Chalonge, D., & Divan, L. 1952, Ann. Astrophys., 15, 201 [NASA ADS] [Google Scholar]
- Chalonge, D., & Divan, L. 1973, A&A, 23, 69 [NASA ADS] [Google Scholar]
- Chalonge, D., & Divan, L. 1977, A&A, 55, 117 [NASA ADS] [Google Scholar]
- Chen, P. S., Shan, H. G., & Zhang, P. 2016, New A, 44, 1 [NASA ADS] [CrossRef] [Google Scholar]
- Chentsov, E. L., Klochkova, V. G., & Miroshnichenko, A. S. 2010, Astrophys. Bull., 65, 150 [CrossRef] [Google Scholar]
- Chiavassa, A., Kudritzki, R., Davies, B., Freytag, B., & de Mink, S. E. 2022, A&A, 661, A1 [NASA ADS] [CrossRef] [EDP Sciences] [Google Scholar]
- Cidale, L., Zorec, J., & Tringaniello, L. 2001, A&A, 368, 160 [NASA ADS] [CrossRef] [EDP Sciences] [Google Scholar]
- Cidale, L. S., Borges Fernandes, M., Andruchow, I., et al. 2012, A&A, 548, A72 [NASA ADS] [CrossRef] [EDP Sciences] [Google Scholar]
- Claria, J. J. 1974, AJ, 79, 1022 [CrossRef] [Google Scholar]
- Clark, J. S., Larionov, V. M., & Arkharov, A. 2005, A&A, 435, 239 [NASA ADS] [CrossRef] [EDP Sciences] [Google Scholar]
- Cochetti, Y. R., Kraus, M., Arias, M. L., et al. 2020a, AJ, 160, 166 [NASA ADS] [CrossRef] [Google Scholar]
- Cochetti, Y. R., Zorec, J., Cidale, L. S., et al. 2020b, A&A, 634, A18 [EDP Sciences] [Google Scholar]
- Condori, C. A. H., Borges Fernandes, M., Kraus, M., Panoglou, D., & Guerrero, C. A. 2019, MNRAS, 488, 1090 [NASA ADS] [CrossRef] [Google Scholar]
- Conti, P. S., & Leep, E. M. 1974, ApJ, 193, 113 [Google Scholar]
- Copeland, J. A., & Heard, J. F. 1963, Publ. David Dunlap Observatory, 2, 317 [NASA ADS] [Google Scholar]
- Corporon, P., & Lagrange, A.-M. 1999, A&AS, 136, 429 [NASA ADS] [CrossRef] [EDP Sciences] [Google Scholar]
- Cox, A. N. 2000, Allen’s astrophysical quantities (New York: AIP Press, Springer) [Google Scholar]
- Coyne, G. V., & Vrba, F. J. 1976, ApJ, 207, 790 [NASA ADS] [CrossRef] [Google Scholar]
- Cucchiaro, A., Macau-Hercot, D., Jaschek, M., & Jaschek, C. 1978, A&AS, 33, 15 [NASA ADS] [Google Scholar]
- Danks, A. C., & Dennefeld, M. 1994, PASP, 106, 382 [NASA ADS] [CrossRef] [Google Scholar]
- de Mink, S. E., Langer, N., Izzard, R. G., Sana, H., & de Koter, A. 2013, ApJ, 764, 166 [Google Scholar]
- de Vaucouleurs, A. 1957, MNRAS, 117, 449 [NASA ADS] [Google Scholar]
- de Winter, D., van den Ancker, M. E., Maira, A., et al. 2001, A&A, 380, 609 [NASA ADS] [CrossRef] [EDP Sciences] [Google Scholar]
- Divan, L. 1979, IAU Colloq. 47, 247 [NASA ADS] [Google Scholar]
- Domiciano de Souza, A., Driebe, T., Chesneau, O., et al. 2007, A&A, 464, 81 [NASA ADS] [CrossRef] [EDP Sciences] [Google Scholar]
- Dong, Y.-S., & Hu, J.-Y. 1991, Acta Astrophys. Sinica, 15, 275 [Google Scholar]
- Drilling, J. S., & Perry, C. L. 1981, A&AS, 45, 439 [NASA ADS] [Google Scholar]
- Dufton, P. L., Smartt, S. J., & Hambly, N. C. 2001, A&A, 373, 608 [NASA ADS] [CrossRef] [EDP Sciences] [Google Scholar]
- Eggen, O. J. 1978, AJ, 83, 288 [NASA ADS] [CrossRef] [Google Scholar]
- Ekström, S., Georgy, C., Eggenberger, P., et al. 2012, A&A, 537, A146 [Google Scholar]
- Fairlamb, J. R., Oudmaijer, R. D., Mendigutía, I., Ilee, J. D., & van den Ancker, M. E. 2015, MNRAS, 453, 976 [Google Scholar]
- Farrell, E. J., Groh, J. H., Meynet, G., et al. 2019, A&A, 621, A22 [NASA ADS] [CrossRef] [EDP Sciences] [Google Scholar]
- Fernie, J. D. 1983, ApJS, 52, 7 [NASA ADS] [CrossRef] [Google Scholar]
- Finkenzeller, U., & Mundt, R. 1984, A&AS, 55, 109 [NASA ADS] [Google Scholar]
- Flower, P. J. 1996, ApJ, 469, 355 [NASA ADS] [CrossRef] [Google Scholar]
- Garrison, L. M., Jr., 1978, ApJ, 224, 535 [NASA ADS] [CrossRef] [Google Scholar]
- Garrison, R. F., Hiltner, W. A., & Schild, R. E. 1977, ApJS, 35, 111 [Google Scholar]
- Gauba, G., & Parthasarathy, M. 2003, A&A, 407, 1007 [NASA ADS] [CrossRef] [EDP Sciences] [Google Scholar]
- Gauba, G., & Parthasarathy, M. 2004, A&A, 417, 201 [NASA ADS] [CrossRef] [EDP Sciences] [Google Scholar]
- Graham, J. A. 1970, AJ, 75, 703 [NASA ADS] [CrossRef] [Google Scholar]
- Gray, R. O., & Corbally, Christopher, J. 2009, Stellar Spectral Classification (Princeton University Press) [Google Scholar]
- Gray, R. O., & Garrison, R. F. 1987, ApJS, 65, 581 [NASA ADS] [CrossRef] [Google Scholar]
- Gregorio-Hetem, J., Lepine, J. R. D., Quast, G. R., Torres, C. A. O., & de La Reza, R. 1992, AJ, 103, 549 [NASA ADS] [CrossRef] [Google Scholar]
- Groh, J. H., Hillier, D. J., & Damineli, A. 2006, ApJ, 638, L33 [Google Scholar]
- Groh, J. H., Damineli, A., Hillier, D. J., et al. 2009, ApJ, 705, L25 [NASA ADS] [CrossRef] [Google Scholar]
- Guetter, H. H. 1968, PASP, 80, 197 [NASA ADS] [CrossRef] [Google Scholar]
- Guglielmo, F., Epchtein, N., Le Bertre, T., et al. 1993, A&AS, 99, 31 [NASA ADS] [Google Scholar]
- Gutierrez-Moreno, A., Moreno, H., Loyola, P., & Cortes, G. 1986, A&AS, 64, 205 [NASA ADS] [Google Scholar]
- Guzmán-Díaz, J., Mendigutía, I., Montesinos, B., et al. 2021, A&A, 650, A182 [NASA ADS] [CrossRef] [EDP Sciences] [Google Scholar]
- Haemmerlé, L., Eggenberger, P., Ekström, S., et al. 2019, A&A, 624, A137 [NASA ADS] [CrossRef] [EDP Sciences] [Google Scholar]
- Hamuy, M., Suntzeff, N. B., Heathcote, S. R., et al. 1994, PASP, 106, 566 [NASA ADS] [CrossRef] [Google Scholar]
- Harvey, P. M. 1984, PASP, 96, 297 [NASA ADS] [CrossRef] [Google Scholar]
- Haucke, M., Cidale, L. S., Venero, R. O. J., et al. 2018, A&A, 614, A91 [NASA ADS] [CrossRef] [EDP Sciences] [Google Scholar]
- Henize, K. G. 1956, ApJS, 2, 315 [CrossRef] [Google Scholar]
- Henize, K. G. 1976, ApJS, 30, 491 [NASA ADS] [CrossRef] [Google Scholar]
- Henize, K. G., & Haro, G. 1961, PASP, 73, 360 [NASA ADS] [CrossRef] [Google Scholar]
- Herbig, G. H. 1960, ApJS, 4, 337 [Google Scholar]
- Herbst, W. 1975, AJ, 80, 212 [NASA ADS] [CrossRef] [Google Scholar]
- Herbst, W., Racine, R., & Warner, J. W. 1978, ApJ, 223, 471 [NASA ADS] [CrossRef] [Google Scholar]
- Herbst, W., Miller, D. P., Warner, J. W., & Herzog, A. 1982, AJ, 87, 98 [NASA ADS] [CrossRef] [Google Scholar]
- Hillenbrand, L. A., Strom, S. E., Vrba, F. J., & Keene, J. 1992, ApJ, 397, 613 [CrossRef] [Google Scholar]
- Hiltner, W. A., Garrison, R. F., & Schild, R. E. 1969, ApJ, 157, 313 [Google Scholar]
- Hinkle, K. H. 1987, in IAU Symp., 122, 327 [NASA ADS] [Google Scholar]
- Hoffleit, D., & Jaschek, C. 1982, The Bright Star Catalogue, 4th revised edn. (Containing data compiled through 1979) [Google Scholar]
- Hohle, M. M., Neuhäuser, R., & Schutz, B. F. 2010, Astron. Nachr., 331, 349 [NASA ADS] [CrossRef] [Google Scholar]
- Hou, W., Luo, A. L., Hu, J.-Y., et al. 2016, Res. Astron. Astrophys., 16, 138 [Google Scholar]
- Houk, N., & Cowley, A. P. 1975, University of Michigan Catalogue of Two-dimensional Spectral Types for the HD Stars, Vol. I. Declinations -90_ to -53_fnof0 [Google Scholar]
- Houk, N., & Smith-Moore, M. 1988, Michigan Catalogue of Two-dimensional Spectral Types for the HD Stars, Vol. 4, Declinations -26°.0 to -12°.0 [Google Scholar]
- Humphreys, R. M., & Davidson, K. 1994, PASP, 106, 1025 [NASA ADS] [CrossRef] [Google Scholar]
- Iriarte, B. 1965, Bol. Observ. Tonantzintla Tacubaya, 4, 33 [NASA ADS] [Google Scholar]
- Järvinen, S. P., Carroll, T. A., Hubrig, S., Ilyin, I., & Schöller, M. 2019, MNRAS, 489, 886 [Google Scholar]
- Jaschek, M., & Egret, D. 1982, in IAU Symp., 98, 261 [NASA ADS] [Google Scholar]
- Jaschek, M., Hubert-Delplace, A. M., Hubert, H., & Jaschek, C. 1980, A&AS, 42, 103 [NASA ADS] [Google Scholar]
- Johnson, H. M. 1955, ApJ, 121, 604 [NASA ADS] [CrossRef] [Google Scholar]
- Johnson, H. L., & Neubauer, F. J. 1946, PASP, 58, 248 [NASA ADS] [CrossRef] [Google Scholar]
- Khokhlov, S. A., Miroshnichenko, A. S., Mennickent, R., et al. 2017, ApJ, 835, 53 [NASA ADS] [CrossRef] [Google Scholar]
- Kilkenny, D. 1993, South Afr. Astron. Observ. Circ., 15, 53 [Google Scholar]
- Koleva, M., Prugniel, P., Bouchard, A., & Wu, Y. 2009, A&A, 501, 1269 [CrossRef] [EDP Sciences] [Google Scholar]
- Kozok, J. R. 1985, A&AS, 62, 7 [NASA ADS] [Google Scholar]
- Kraus, M. 2009, A&A, 494, 253 [NASA ADS] [CrossRef] [EDP Sciences] [Google Scholar]
- Kraus, M. 2019, Galaxies, 7, 83 [NASA ADS] [CrossRef] [Google Scholar]
- Kraus, M., Krügel, E., Thum, C., & Geballe, T. R. 2000, A&A, 362, 158 [NASA ADS] [Google Scholar]
- Kraus, M., Borges Fernandes, M., & de Araújo, F. X. 2007, A&A, 463, 627 [NASA ADS] [CrossRef] [EDP Sciences] [Google Scholar]
- Kron, G. E. 1958, PASP, 70, 561 [NASA ADS] [CrossRef] [Google Scholar]
- Kurosawa, R., Kreplin, A., Weigelt, G., et al. 2016, MNRAS, 457, 2236 [NASA ADS] [CrossRef] [Google Scholar]
- Lagadec, E., Verhoelst, T., Mékarnia, D., et al. 2011, MNRAS, 417, 32 [NASA ADS] [CrossRef] [Google Scholar]
- Lamers, H. J. G. L. M., Zickgraf, F.-J., de Winter, D., Houziaux, L., & Zorec, J. 1998, A&A, 340, 117 [NASA ADS] [Google Scholar]
- Langer, N., & Kudritzki, R. P. 2014, A&A, 564, A52 [NASA ADS] [CrossRef] [EDP Sciences] [Google Scholar]
- Lee, C.-D., Chen, W.-P., & Liu, S.-Y. 2016, A&A, 592, A130 [NASA ADS] [CrossRef] [EDP Sciences] [Google Scholar]
- Leinert, C., Richichi, A., & Haas, M. 1997, A&A, 318, 472 [NASA ADS] [Google Scholar]
- Levato, O. H. 1972, PASP, 84, 584 [NASA ADS] [CrossRef] [Google Scholar]
- Lunt, J. 1919, ApJ, 50, 161 [NASA ADS] [CrossRef] [Google Scholar]
- MacConnell, D. J. 1981, A&AS, 44, 387 [NASA ADS] [Google Scholar]
- Malfait, K., Bogaert, E., & Waelkens, C. 1998, A&A, 331, 211 [NASA ADS] [Google Scholar]
- Malkov, O. Y., Oblak, E., Snegireva, E. A., & Torra, J. 2006, A&A, 446, 785 [NASA ADS] [CrossRef] [EDP Sciences] [Google Scholar]
- Manoj, P., Bhatt, H. C., Maheswar, G., & Muneer, S. 2006, ApJ, 653, 657 [Google Scholar]
- Maravelias, G., Kraus, M., Cidale, L. S., et al. 2018, MNRAS, 480, 320 [CrossRef] [Google Scholar]
- Marcos-Arenal, P., Mendigutía, I., Koumpia, E., et al. 2021, A&A, 652, A68 [NASA ADS] [CrossRef] [EDP Sciences] [Google Scholar]
- McSwain, M. V., & Gies, D. R. 2005, ApJ, 622, 1052 [NASA ADS] [CrossRef] [Google Scholar]
- McSwain, M. V., Huang, W., & Gies, D. R. 2009, ApJ, 700, 1216 [NASA ADS] [CrossRef] [Google Scholar]
- Mehner, A., Baade, D., Groh, J. H., et al. 2017, A&A, 608, A124 [NASA ADS] [CrossRef] [EDP Sciences] [Google Scholar]
- Meilland, A., Kanaan, S., Borges Fernandes, M., et al. 2010, A&A, 512, A73 [NASA ADS] [CrossRef] [EDP Sciences] [Google Scholar]
- Mendoza, V. E. E. 1958, ApJ, 128, 207 [CrossRef] [Google Scholar]
- Merrill, P. W., & Burwell, C. G. 1933, ApJ, 78, 87 [NASA ADS] [CrossRef] [Google Scholar]
- Merrill, P. W., & Burwell, C. G. 1943, ApJ, 98, 153 [NASA ADS] [CrossRef] [Google Scholar]
- Merrill, P. W., & Burwell, C. G. 1949, ApJ, 110, 387 [NASA ADS] [CrossRef] [Google Scholar]
- Merrill, P. W., & Burwell, C. G. 1950, ApJ, 112, 72 [NASA ADS] [CrossRef] [Google Scholar]
- Millour, F., Meilland, A., Chesneau, O., et al. 2011, A&A, 526, A107 [NASA ADS] [CrossRef] [EDP Sciences] [Google Scholar]
- Miroshnichenko, A. S. 2007, ApJ, 667, 497 [NASA ADS] [CrossRef] [Google Scholar]
- Miroshnichenko, A. S., Levato, H., Bjorkman, K. S., & Grosso, M. 2001, A&A, 371, 600 [NASA ADS] [CrossRef] [EDP Sciences] [Google Scholar]
- Miroshnichenko, A. S., Klochkova, V. G., & Bjorkman, K. S. 2003, Astron. Lett., 29, 336 [NASA ADS] [CrossRef] [Google Scholar]
- Miroshnichenko, A. S., Manset, N., Kusakin, A. V., et al. 2007, ApJ, 671, 828 [NASA ADS] [CrossRef] [Google Scholar]
- Miroshnichenko, A. S., Danford, S., Zharikov, S. V., et al. 2020, ApJ, 897, 48 [NASA ADS] [CrossRef] [Google Scholar]
- Monnier, J. D., Millan-Gabet, R., Billmeier, R., et al. 2005, ApJ, 624, 832 [NASA ADS] [CrossRef] [Google Scholar]
- Montesinos, B., Eiroa, C., Mora, A., & Merín, B. 2009, A&A, 495, 901 [NASA ADS] [CrossRef] [EDP Sciences] [Google Scholar]
- Mora, A., Merín, B., Solano, E., et al. 2001, A&A, 378, 116 [NASA ADS] [CrossRef] [EDP Sciences] [Google Scholar]
- Nordström, B. 1975, A&AS, 21, 193 [Google Scholar]
- Obolentseva, M. A., Dyachenko, V. V., Pogodin, M. A., et al. 2021, Astrophys. Bull., 76, 292 [CrossRef] [Google Scholar]
- Oksala, M. E., Kraus, M., Cidale, L. S., Muratore, M. F., & Borges Fernandes, M. 2013, A&A, 558, A17 [NASA ADS] [CrossRef] [EDP Sciences] [Google Scholar]
- Oudmaijer, R. D., van der Veen, W. E. C. J., Waters, L. B. F. M., et al. 1992, A&AS, 96, 625 [NASA ADS] [Google Scholar]
- Parthasarathy, M. 1993, ASP Conf. Ser., 45, 173 [NASA ADS] [Google Scholar]
- Persi, P., Polcaro, V. F., Viotti, R., & Origlia, L. 1991, MNRAS, 251, 1P [CrossRef] [Google Scholar]
- Pietrzyński, G., Graczyk, D., Gallenne, A., et al. 2019, Nature, 567, 200 [Google Scholar]
- Plets, H., Waelkens, C., & Trams, N. R. 1995, A&A, 293, 363 [NASA ADS] [Google Scholar]
- Podsiadlowski, P., Morris, T. S., & Ivanova, N. 2006, ASP Conf. Ser., 355, 259 [NASA ADS] [Google Scholar]
- Pogodin, M. A., Malanushenko, V. P., Kozlova, O. V., Tarasova, T. N., & Franco, G. A. P. 2006, A&A, 452, 551 [NASA ADS] [CrossRef] [EDP Sciences] [Google Scholar]
- Pogodin, M. A., Beskrovnaya, N. G., Guseva, I. S., Pavlovskiy, S. E., & Rusomarov, N. 2011, Astrophysics, 54, 214 [NASA ADS] [CrossRef] [Google Scholar]
- Pogodin, M. A., Beskrovnaya, N. G., Pavlovskiy, S. E., et al. 2020, Azerbaijani Astron. J., 15, 143 [NASA ADS] [Google Scholar]
- Raddi, R., Drew, J. E., Steeghs, D., et al. 2015, MNRAS, 446, 274 [CrossRef] [Google Scholar]
- Reed, B. C., & Fitzgerald, M. P. 1984, MNRAS, 211, 235 [NASA ADS] [CrossRef] [Google Scholar]
- Roccatagliata, V., Preibisch, T., Ratzka, T., & Gaczkowski, B. 2013, A&A, 554, A6 [NASA ADS] [CrossRef] [EDP Sciences] [Google Scholar]
- Rovero, A. C., & Ringuelet, A. E. 1994, MNRAS, 266, 203 [NASA ADS] [CrossRef] [Google Scholar]
- Sartori, M. J., Gregorio-Hetem, J., Rodrigues, C. V., Hetem, A., Jr., & Batalha, C. 2010, AJ, 139, 27 [NASA ADS] [CrossRef] [Google Scholar]
- Schlafly, E. F., & Finkbeiner, D. P. 2011, ApJ, 737, 103 [Google Scholar]
- Shokry, A., Saad, S. M., Hamdy, M. A., et al. 2018, New A, 59, 8 [CrossRef] [Google Scholar]
- Shu, F. H., Najita, J., Ruden, S. P., & Lizano, S. 1994, ApJ, 429, 797 [Google Scholar]
- Shull, J. M., & Danforth, C. W. 2019, ApJ, 882, 180 [NASA ADS] [CrossRef] [Google Scholar]
- Skiff, B. A. 2014, VizieR Online Data Catalog: B/mk [Google Scholar]
- Smith, K. W., Balega, Y. Y., Duschl, W. J., et al. 2005, A&A, 431, 307 [NASA ADS] [CrossRef] [EDP Sciences] [Google Scholar]
- Smith, N. 2017, Philos. Trans. Roy. Soc. Lond. A, 375, 20160268 [NASA ADS] [Google Scholar]
- Snow, T. P., Lamers, H. J. G. L. M., Lindholm, D. M., & Odell, A. P. 1994, ApJS, 95, 163 [NASA ADS] [CrossRef] [Google Scholar]
- Sota, A., Maíz Apellániz, J., Morrell, N. I., et al. 2014, ApJS, 211, 10 [Google Scholar]
- Sreedhar Rao, S., & Abhyankar, K. D. 1991, J. Astrophys. Astron., 12, 133 [NASA ADS] [CrossRef] [Google Scholar]
- Stassun, K. G., & Torres, G. 2021, ApJ, 907, L33 [NASA ADS] [CrossRef] [Google Scholar]
- Stee, P., Bittar, J., & Lopez, B. 2004, ApJ, 602, 978 [NASA ADS] [CrossRef] [Google Scholar]
- Stephenson, C. B., & Sanduleak, N. 1971, Publ. Warner Swasey Observ., 1 [Google Scholar]
- Strohmeier, W., Ott, H., & Schoffel, E. 1968, Inform. Bull. Variable Stars, 261 [Google Scholar]
- Strom, S. E. 1983, Rev. Mex. Astron. Astrofis, 7, 201 [Google Scholar]
- Terranegra, L., Chavarria, K.C., Diaz, S., & Gonzalez-Patino, D. 1994, A&AS, 104 [Google Scholar]
- Testi, L., Palla, F., & Natta, A. 1998, A&AS, 133, 81 [NASA ADS] [CrossRef] [EDP Sciences] [Google Scholar]
- Tetzlaff, N., Neuhäuser, R., & Hohle, M. M. 2011, MNRAS, 410, 190 [Google Scholar]
- Thé, P. S., de Winter, D., & Pérez, M. R. 1994, A&AS, 104, 315 [Google Scholar]
- Tisserand, P., Clayton, G. C., Welch, D. L., et al. 2013, A&A, 551, A77 [NASA ADS] [CrossRef] [EDP Sciences] [Google Scholar]
- Tjin A Djie, H. R. E., van den Ancker, M. E., Blondel, P. F. C., et al. 2001, MNRAS, 325, 1441 [NASA ADS] [CrossRef] [Google Scholar]
- Uchida, Y., & Shibata, K. 1985, PASJ, 37, 515 [NASA ADS] [Google Scholar]
- Valenti, J. A., Fallon, A. A., & Johns-Krull, C. M. 2003, ApJS, 147, 305 [NASA ADS] [CrossRef] [Google Scholar]
- van den Ancker, M. E., de Winter, D., & Tjin A Djie, H. R. E. 1998, A&A, 330, 145 [Google Scholar]
- van den Bergh, S. 1966, AJ, 71, 990 [NASA ADS] [CrossRef] [Google Scholar]
- van den Bergh, S., & Herbst, W. 1975, AJ, 80, 208 [NASA ADS] [CrossRef] [Google Scholar]
- Varga, J., Gerják, T., Ábrahám, P., et al. 2019, MNRAS, 485, 3112 [CrossRef] [Google Scholar]
- Venero, R. O. J., Cidale, L. S., & Ringuelet, A. E. 2002, ApJ, 578, 450 [NASA ADS] [CrossRef] [Google Scholar]
- Verhoeff, A. P., Waters, L. B. F. M., van den Ancker, M. E., et al. 2012, A&A, 538, A101 [NASA ADS] [CrossRef] [EDP Sciences] [Google Scholar]
- Vickers, S. B., Frew, D. J., Parker, Q. A., & Bojičić, I. S. 2015, MNRAS, 447, 1673 [NASA ADS] [CrossRef] [Google Scholar]
- Vieira, S. L. A., Corradi, W. J. B., Alencar, S. H. P., et al. 2003, AJ, 126, 2971 [Google Scholar]
- Vijapurkar, J., & Drilling, J. S. 1993, ApJS, 89, 293 [NASA ADS] [CrossRef] [Google Scholar]
- Vioque, M., Oudmaijer, R. D., Baines, D., Mendigutía, I., & Pérez-Martínez, R. 2018, A&A, 620, A128 [NASA ADS] [CrossRef] [EDP Sciences] [Google Scholar]
- Vioque, M., Oudmaijer, R. D., Schreiner, M., et al. 2020, A&A, 638, A21 [NASA ADS] [CrossRef] [EDP Sciences] [Google Scholar]
- Vioque, M., Oudmaijer, R. D., Wichittanakom, C., et al. 2022, ApJ, 930, 39 [NASA ADS] [CrossRef] [Google Scholar]
- Volk, K., Kwok, S., Stencel, R. E., & Brugel, E. 1991, ApJS, 77, 607 [NASA ADS] [CrossRef] [Google Scholar]
- Vural, J., Kraus, S., Kreplin, A., et al. 2014, A&A, 569, A25 [NASA ADS] [CrossRef] [EDP Sciences] [Google Scholar]
- Walborn, N. R. 1977, ApJ, 215, 53 [NASA ADS] [CrossRef] [Google Scholar]
- Wang, S., & Jiang, B. W. 2014, ApJ, 788, L12 [NASA ADS] [CrossRef] [Google Scholar]
- Weis, K., & Bomans, D. J. 2020, Galaxies, 8, 20 [NASA ADS] [CrossRef] [Google Scholar]
- Wheelwright, H. E., Weigelt, G., Caratti o Garatti, A., & Garcia Lopez, R. 2013, A&A, 558, A116 [NASA ADS] [CrossRef] [EDP Sciences] [Google Scholar]
- Whittet, D. C. B., & van Breda, I. G. 1980, MNRAS, 192, 467 [NASA ADS] [CrossRef] [Google Scholar]
- Whittet, D. C. B., Williams, P. M., Zealey, W. J., Bode, M. F., & Davies, J. K. 1983, A&A, 123, 301 [NASA ADS] [Google Scholar]
- Witham, A. R., Knigge, C., Drew, J. E., et al. 2008, MNRAS, 384, 1277 [NASA ADS] [CrossRef] [Google Scholar]
- Wolf, B. 1989, A&A, 217, 87 [NASA ADS] [Google Scholar]
- Worthey, G., & Lee, H.-C. 2011, ApJS, 193, 1 [CrossRef] [Google Scholar]
- Wray, J. D. 1966, PhD thesis, Northwestern University (USA) [Google Scholar]
- Xu, S., Zhang, B., Reid, M. J., Zheng, X., & Wang, G. 2019, ApJ, 875, 114 [NASA ADS] [CrossRef] [Google Scholar]
- Zasche, P., Uhlar, R., Svoboda, P., Cagaš, P., & Mašek, M. 2020, A&A, 643, A130 [NASA ADS] [CrossRef] [EDP Sciences] [Google Scholar]
- Zhang, P., Chen, P. S., & He, J. H. 2004, New A, 9, 509 [NASA ADS] [CrossRef] [Google Scholar]
- Zickgraf, F.-J., Wolf, B., Stahl, O., Leitherer, C., & Klare, G. 1985, A&A, 143, 421 [NASA ADS] [Google Scholar]
- Zorec, J. 1986, Thèse d’État: Structure et rotation différentielle dans les étoiles B avec et sans émission, Université Paris VII (France) [Google Scholar]
- Zorec, J. 2023, Galaxies, 11, 54 [NASA ADS] [CrossRef] [Google Scholar]
- Zorec, J., & Briot, D. 1991, A&A, 245, 150 [NASA ADS] [Google Scholar]
- Zorec, J., Frémat, Y., & Cidale, L. 2005, A&A, 441, 235 [NASA ADS] [CrossRef] [EDP Sciences] [Google Scholar]
- Zorec, J., Cidale, L., Arias, M. L., et al. 2009, A&A, 501, 297 [NASA ADS] [CrossRef] [EDP Sciences] [Google Scholar]
The Be Star Spectra database (BeSS); the CoRoT spectroscopic Be stars Atlas; SIMBAD database; Cochetti et al. (2020b); Hou et al. (2016); Jaschek & Egret (1982); McSwain & Gies (2005); McSwain et al. (2009); Raddi et al. (2015); Vioque et al. (2020), and Witham et al. (2008).
All Tables
Estimations of inner radii of dust discs for MS and HAeB[e] stars using the optically thin MA and optically thick BL models.
All Figures
|
Fig. 1 Low-resolution flux-calibrated spectra taken in CASLEO and LNA for the sample of B[e] and LBV stars that present the BD, but the SBD is absent. The main spectral lines are highlighted. The flux units are erg cm−2 s−1 Å−1. |
| In the text | |
|
Fig. 2 Low-resolution flux-calibrated spectra taken in CASLEO and LNA for the sample of B[e] and LBV stars that present the BD and the SBD. The main spectral lines are highlighted. The flux units are in erg cm−2 s−1 Å−1. |
| In the text | |
|
Fig. 3 Left: Hertzsprung—Russell diagram for the stars of our sample (coloured symbols). The grey circles indicate the positions of stars as if they were located at distances given by Gaia EDR3 (Bailer-Jones et al. 2021). The BCD and Gaia positions of the same object are connected with dotted lines. Evolutionary tracks with and without rotation (Ω/Ωç = 0.4 and Ω/Ωc = 0.0 in dotted and solid lines, respectively) were taken from Ekström et al. (2012). The positions of Hen 3–847 and AS 202 correspond to mean measurement values obtained at CASLEO and LNA. Right: spectroscopic Hertzsprung–Russell diagram. The dashed black line at log ℒ/ℒ⊙ = 4.6 corresponds to the Eddington luminosity limit for a hydrogen-rich composition (Langer & Kudritzki 2014). |
| In the text | |
|
Fig. 4 Near-infrared colour–colour diagram. Apparent colours are marked by coloured symbols and true colours are represented by filled grey circles. Data for the same stars are connected with arrows. The thick grey line on the left defines the location of classical supergiants (Worthey & Lee 2011). |
| In the text | |
|
Fig. 5 Location of the young stellar objects in the HRD. Pre-MS evolutionary tracks are from Haemmerlé et al. (2019). The ZAMS (dotted line) and birth line (solid line) are also plotted. Numbers refer to the stellar masses (in solar masses) when reaching the ZAMS. |
| In the text | |
Current usage metrics show cumulative count of Article Views (full-text article views including HTML views, PDF and ePub downloads, according to the available data) and Abstracts Views on Vision4Press platform.
Data correspond to usage on the plateform after 2015. The current usage metrics is available 48-96 hours after online publication and is updated daily on week days.
Initial download of the metrics may take a while.