| Issue |
A&A
Volume 677, September 2023
|
|
|---|---|---|
| Article Number | A61 | |
| Number of page(s) | 16 | |
| Section | Galactic structure, stellar clusters and populations | |
| DOI | https://doi.org/10.1051/0004-6361/202347120 | |
| Published online | 04 September 2023 | |
The chemical DNA of the Magellanic Clouds
II. High-resolution spectroscopy of the SMC globular clusters NGC 121, NGC 339, and NGC 419⋆
1
Dipartimento di Fisica e Astronomia “Augusto Righi”, Alma Mater Studiorum, Università di Bologna, Via Gobetti 93/2, 40129 Bologna, Italy
e-mail: alessio.mucciarelli2@unibo.it
2
INAF – Osservatorio di Astrofisica e Scienza dello Spazio di Bologna, Via Gobetti 93/3, 40129 Bologna, Italy
Received:
7
June
2023
Accepted:
6
July
2023
The Small Magellanic Cloud (SMC) is the host of a rich system of globular clusters (GCs) that span a wide age range. The chemical composition of the SMC clusters is still poorly understood, despite their significance to chemical-evolution studies. Here, we provide the first detailed chemical study of evolved giants in three distinct clusters, NGC 121 (10.5 Gyr), NGC 339 (6 Gyr), and NGC 419 (1.4 Gyr). The results are based on high-resolution spectra obtained with FLAMES at the Very Large Telescope. The chemical fingerprints of these clusters closely resemble those of SMC field stars, supporting the SMC’s specific history of chemical enrichment relative to the Milky Way. The approximately solar-scaled [α/Fe] observed in all three clusters, independent of their [Fe/H], demonstrate the SMC’s low star formation efficiency. Compared to their Milky Way counterparts, elements primarily produced by massive stars are severely under-represented. In particular, the young cluster NGC 419’s extremely low [Zn/Fe] shows that hypernovae have contributed relatively little during the past 2 Gyr. The three GCs have high [Eu/Fe] values regardless of their age. This suggests that the production of the r-process elements in the SMC was extremely efficient up to 1.5 Gyr ago, with an enrichment timescale comparable to that from Type Ia supernovae. When the properties of the oldest SMC object, NGC 121, are compared to those of in situ Milky Way clusters and accreted clusters linked to the Gaia-Enceladus merger event, it is shown that the SMC had already attained the same metallicity as Gaia-Enceladus but with lower [Fe/H] ratios at the age of NGC 121. This suggests that the chemical enrichment histories of the early SMC and Gaia-Enceladus differed, and that the SMC probably had a lower mass in its early ages than Gaia-Enceladus.
Key words: Magellanic Clouds / techniques: spectroscopic / stars: abundances
© The Authors 2023
 Open Access article, published by EDP Sciences, under the terms of the Creative Commons Attribution License (https://creativecommons.org/licenses/by/4.0), which permits unrestricted use, distribution, and reproduction in any medium, provided the original work is properly cited.
This article is published in open access under the Subscribe to Open model. Subscribe to A&A to support open access publication.
1. Introduction
The Milky Way’s (MW) most massive satellites, the Large and Small Magellanic Clouds (LMC and SMC, respectively), offer observers the chance to study a pair of interacting galaxies before they merge and are cannibalised by the Galaxy. The currently prevailing view for the two galaxies’ formation and evolution is that they evolved independently and only recently formed a binary pair (Diaz & Bekki 2011; D’Onghia & Fox 2016). This binary system is probably in its first peri-Galactic passage (Shuter 1992; Byrd et al. 1994; Besla et al. 2007, 2012). The tidal interactions occurring between these galaxies are responsible for the disturbed structure of the SMC, as well as of the LMC disc warp and of the complex star formation (SF) history of both galaxies, characterised by different, synchronous SF bursts (Harris & Zaritsky 2009; Rubele et al. 2012; Nidever et al. 2020; Massana et al. 2022).
In the last decade, there has been a renewed interest in the turbulent evolution of these irregular galaxies and their star populations, as evidenced by several dedicated photometric surveys, such as VMC (VISTA survey of the Magellanic Clouds system, Cioni et al. 2011), STEP (the SMC in Time: Evolution of a Prototype interacting late-type dwarf galaxy, Ripepi et al. 2014), SMASH (Survey of the MAgellanic Stellar History, Nidever et al. 2017), and VISCACHA (VIsible Soar photometry of star Clusters in tApii and Coxi HuguA, Maia et al. 2019). Additionally, they will be privileged targets for forthcoming multi-object spectrographs, such as 4MOST (4-m Multi-Object Spectrograph Telescope, see Cioni et al. 2019) and MOONS (Multi-Object Optical and Near-infrared Spectrograph, see Gonzalez et al. 2020).
The study of the chemical composition of SMC stars has received limited attention, despite its importance in understanding the chemical enrichment history of this galaxy. Chemical analyses of high-resolution spectra of SMC red giant branch (RGB) stars have been presented only recently. The APOGEE-2 survey measured abundances for ∼1000 SMC RGB stars, in particular Fe, α-elements (Nidever et al. 2020), Al, Ni, Ce (Hasselquist et al. 2021), and Mn (Fernandes et al. 2023). This dataset shows a quite flat behaviour of [α/Fe] ratios in the range of [Fe/H] between –1.2 and –0.2 dex, and a knee (the metallicity corresponding to the decrease in [α/Fe] abundance ratios) likely located at [Fe/H] < –2.2 dex. All the measured abundance ratios reveal a clear difference with respect to the MW stars, pointing to a lower SF efficiency in the SMC than in the MW. Reggiani et al. (2021) derived the chemical composition of four SMC metal-poor stars ([Fe/H] < −2 dex) and for two of them also measured the abundance of the r-process element Eu. They find that the SMC is more enriched in Eu than the MW and that elements such as Ba and La are produced from this nucleosynthesis channel at these metallicities. These two stars are the only ones in the SMC where Eu has been measured. Mucciarelli et al. (2023, hereafter Paper I) measured Na and α, iron-peak, and s-process elements for 206 SMC stars that belong to three distinct fields around as many globular clusters (GCs). They find that different regions in the SMC are characterised by different metallicity and radial velocity (RV) distributions. Some systematic differences in some abundance ratios are identified in different fields. This suggests that the chemical enrichment history in the SMC has not been uniform, with the presence of possible chemically and kinematically distinct substructures. Also, all the abundance ratios of species produced by massive stars are significantly lower than those measured in the MW, indicating that these stars contribute less to the chemical enrichment of the SMC than in the MW, according to the low SF rate expected for this galaxy.
Globular clusters are an excellent tool in the reconstruction of the origin and evolution of the stellar populations in a galaxy as they enable the simultaneous derivation of ages and metallicities and therefore the determination of a reliable age-metallicity relation (AMR). In particular, at large distances (as for external resolved galaxies), the ages of GCs are more accurate and precise than those of field stars that are largely affected by uncertainties arising from reddening and distance. Therefore, the abundances derived in GCs provide time-resolved chemical information and are complementary to those of the field stars. The SMC is the only galaxy in the Local Group that has formed and preserved GCs more or less continuously over the past 11 Gyr. The LMC, on the other hand, hosts 15 old GCs, coeval to the MW ones (Brocato et al. 1996; Olsen et al. 1998; Wagner-Kaiser et al. 2017), and a populous family of clusters younger than ∼3 Gyr, with a lack of GCs over a broad age range – the so-called Age Gap; the few clusters (ESO 121-SC03, KMHK 1592, and KMHK 1762) falling in this age interval were likely accreted by the SMC (Mackey et al. 2006; Piatti 2022; Gatto et al. 2022). Several SMC GCs fill the age range corresponding to the LMC Age Gap. The metallicities of SMC GCs have been widely investigated, using photometry (Glatt et al. 2008a,b; Narloch et al. 2021) and low-resolution spectroscopy (Da Costa & Hatzidimitriou 1998; Parisi et al. 2009, 2015; Dias et al. 2021, 2022; Parisi et al. 2022), to explore the global chemical evolution of the galaxy and its AMR. The missing pieces of evidence in our current comprehension of the SMC GCs (and of the SMC stellar populations in general) are their abundance patterns. The only chemical analyses of SMC GCs based on high-resolution spectroscopy available so far are for the very young (∼30 Myr) cluster NGC 330 (Hill 1999) and for the old cluster NGC 121 (Dalessandro et al. 2016, limited to Fe, Na, O, Mg and Al). Consequently, the investigation of their chemical composition is still entirely unexplored.
This paper is part of a series aimed at deriving the finer chemical details of field and stellar clusters in the Magellanic Clouds and thus providing new clues about the evolution of these galaxies. In Paper I, we analysed the properties of 206 stars located in three fields around three GCs. In this work, we examine the chemical composition of these three SMC GCs (namely, NGC 121, NGC 339, and NGC 419), which span a wide age range. The aim is to study the SMC’s chemical-enrichment history at various ages and to compare the chemical patterns of these clusters with those of field stars derived in Paper I. In this work we discuss 18 species in order to study different sites and channels of nucleosynthesis. We do not discuss the light elements (O, Na, Mg, and Al) involved in the CNO cycle and observed to vary from star to star in GCs; this phenomenon is usually referred to as multiple populations (see Gratton et al. 2012; Bastian & Lardo 2018, and references therein) and will be discussed in a companion paper. The present paper is structured as follows: in Sect. 2 we summarise the observations and describe the spectroscopic dataset. Sects. 3 and 4 present the atmospheric parameter determination and the chemical analysis, respectively. We discuss our results in Sects. 5–8. Finally, we summarise our findings and draw our conclusions in Sect. 9.
2. Spectroscopic dataset
NGC 121 is the oldest SMC GC, with an age of 10.5 ± 0.5 Gyr (Glatt et al. 2008a) and a metallicity of –1.28 ± 0.03 dex (Dalessandro et al. 2016). According to the classification proposed by Parisi et al. (2022), this cluster is associated with the SMC West Halo, a part of the SMC moving outwards with respect to the main body of the galaxy (Dias et al. 2016) and probably part of the more extended Counter Bridge (Diaz & Bekki 2012).
NGC 339 is a cluster with an age of 6 ± 0.5 Gyr (Glatt et al. 2008b) and [Fe/H] = −1.12 ± 0.10 dex (Da Costa & Hatzidimitriou 1998) that has been found to be dynamically un-evolved based on its blue stragglers’ spatial distribution (Dresbach et al. 2022). It is an example of the SMC intermediate-age clusters lacking in the LMC. This cluster is associated with the Southern Bridge, a second branch of the stellar Magellanic Bridge (Belokurov et al. 2017). No high-resolution spectroscopic analysis of this cluster is available in the literature.
NGC 419 is the youngest among the three observed GCs, with an age of 1.4 ± 0.2 Gyr and [Fe/H] = −0.67 ± 0.12 dex (Glatt et al. 2008b). Parisi et al. (2022) associated NGC 419 with the main body of the SMC, and stars from the Magellanic Bridge have been found in its field of view (Massari et al. 2021). No high-resolution spectroscopic data exist for this cluster either.
The spectra analysed in this work were collected with the Fiber Large Array Multi-Element Spectrograph (FLAMES; Pasquini et al. 2002) mounted at the Very Large Telescope of the European Southern Observatory under the programme 086.D-0665 (PI: Mucciarelli). The observations with the UVES-FLAMES spectrograph were performed using the Red Arm 580 UVES setup (spectral resolution of R = 47 000 and spectral coverage ∼4800–6800 Å). The observations made with the GIRAFFE spectrograph were obtained with the MEDUSA setups HR11 (5597–5840 Å and R = 24 200) and HR13 (6120–6406 Å and R = 22 500). The exposure times and the number of individual exposures for each setup and cluster are reported in Table 1. In particular, NGC 121 was observed with 12 exposures of 2700 s and one of 2200 s, NGC 339 with 14 exposures of 2700 s, and NGC 419 with 10 exposures of 2700 s. For each cluster the same targets were observed during all the exposures.
Coordinates of the FLAMES pointings, the number of exposures, and exposure times for the GIRAFFE and UVES setups.
After the reduction, performed with the dedicated ESO pipelines1 (including bias subtraction, flat-fielding, wavelength calibration, spectral extraction, and order merging), the sky contribution to the individual spectra of each exposure was cleaned by subtracting the spectra of some close sky regions observed at the same time as the science targets. Subsequently, single exposures of the same target were combined into an individual spectrum for each star.
Target stars were selected from the near-infrared photometric catalogues obtained with SofI at the New Technology Telescope (Mucciarelli et al. 2009) in the brightest portion of the RGB (Ks ∼ 13–14). Cluster membership was determined using the derived RV and metallicity information, taking into consideration the targets located within the cluster’s tidal radius (according to Glatt et al. 2009). In particular, stars located within the cluster’s tidal radius with discrepant values of RVs and/or [Fe/H] have been considered as SMC field stars and not cluster member stars, and they have been discussed in Paper I (see Table 2 of Paper I). The positions in the (K, J − Ks) colour-magnitude diagrams of the cluster member stars analysed in this work are shown in Fig. 1.
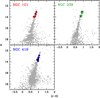 |
Fig. 1. (K, J − Ks) colour-magnitude diagrams of the three SMC GCs are plotted as small grey dots. Large coloured circles in each panel represent the spectroscopic targets analysed in this work. |
The final sample of cluster stars includes five members of NGC 121 (all observed with UVES), seven stars of NGC 339 (four observed with UVES and three with GIRAFFE), and eight stars of NGC 419 (five observed with UVES and three with GIRAFFE).
Similar to what we did in our previous works (Minelli et al. 2021; Mucciarelli et al. 2021b, Paper I), we defined a control sample of MW GCs analysed using the same approach as for the SMC targets. The MW control sample includes spectra of giant stars of 16 GCs retrieved from the ESO archive and obtained with the same UVES-FLAMES configuration (Red Arm 580) used for the majority of the target stars of this work. The clear advantage of defining a MW control sample is to erase the systematics of the analysis when comparing the measured abundances in SMC clusters to those of their MW counterparts. These systematics arise mainly from the zero point of the adopted Teff scale, the adopted solar reference values, the used atomic data (in particular the log gf values), the model atmospheres, and the code used for the analysis, so that a simple re-scaling to the same solar reference values does not suffice to put different datasets on the same scale.
3. Atmospheric parameters
For consistency with Paper I, in which the effective temperature (Teff) was derived using the colour-Teff transformations from Mucciarelli et al. (2021a), here we used the (J − Ks)0 − Teff relation from González Hernández & Bonifacio (2009) because these two sets of transformations are based on the same calibration stars. We used the near-infrared photometry by Mucciarelli et al. (2009). Since the colour-Teff relation has a mild dependence on stellar metallicity, we adopted the [Fe/H] values available in the literature as a first step and then we recomputed Teff with metallicity values determined from the spectroscopic analysis (leading to variation of less than 20 K with respect to the first run). Colour excess E(B − V) values are from the reddening maps in Schlafly & Finkbeiner (2011), for example E(B − V) = 0.028, 0.042, and 0.089 mags for NGC 121, NGC 339, and NGC 419, respectively. We compared these values with those of the reddening maps from Skowron et al. (2021), finding an excellent agreement: the colour excess values towards NGC 121 and NGC 339 differ by less than 0.01 mag, and a difference of 0.03 mag is found for NGC 419. The latter difference in E(B − V) leads to variations in Teff of about 30 K and in logg of 0.01 dex, with a negligible impact on the derived abundances.
Surface gravity (log g) values were then derived by projecting Teff of a given star on the appropriate isochrone (in terms of age and metallicity) for each GC, computed with the Dartmouth Stellar Evolution Database (Dotter et al. 2008). In order to choose the most appropriate isochrone, we first used the age and metallicity determined by Glatt et al. (2008b), refining the metallicity value using those determined in the following analysis. The final values chosen for the isochrones are: 10.5 Gyr and [Fe/H] = –1.2 dex for NGC 121, 6 Gyr and [Fe/H] = –1.2 dex for NGC 339, and 1.4 Gyr and [Fe/H] = –0.6 dex for NGC 419. We used solar-scaled isochrones according to our results for the α-element abundances (see Sect. 7).
Finally, the micro-turbulent velocities, vt, for UVES spectra were determined spectroscopically with the code GALA (Mucciarelli et al. 2013), minimising the slope between the abundances from Fe I lines and the logarithm of the equivalent widths (EWs) normalised to the wavelength. For the GIRAFFE spectra, the spectroscopically determined vt risked being affected by uncertainties due to the low number of available Fe lines. Therefore we computed them from the log g–vt relation provided by Mucciarelli & Bonifacio (2020). We checked that the two approaches provide consistent results for the targets and they do, with an average difference of +0.14 km s−1 (σ = 0.13 km s−1) between vt from the relation and those obtained from the optimisation process. Final atmospheric parameters for the target stars are listed in Table 2.
Adopted atmospheric parameters for SMC GC targets.
4. Chemical analysis
4.1. Determination of the chemical abundances
In order to select only unblended and linear or poorly saturated lines for the chemical analysis, we compared the observed spectra with synthetic ones computed with the appropriate atmospheric parameters and metallicity by using the code SYNTHE (Kurucz 2005). Model atmospheres were calculated with the code ATLAS9 (Kurucz 1993, 2005). As a first guess, we assumed for the model atmospheres of all the target clusters an α-enhanced chemical mixture. The results of the first run of chemical analysis indicated that these stars have solar-scaled [α/Fe] abundance ratios, and we repeated the analysis adopting solar-scaled model atmospheres.
Atomic and molecular data (such as excitation potential, χ, log gf, damping constants, and hyperfine and/or isotopic splitting) used for synthetic spectra are from the last release of the Kurucz/Castelli linelists2, with some exceptions for more recent or more accurate data for some transitions of Fe, Si, Ca, Ti, Ni, Ba, and Eu (see Mucciarelli et al. 2017, for additional references). Hyperfine and/or isotopic splitting are taken into account for Sc, V, Mn, Co, Cu, Ba, La, and Eu. The synthetic spectra were convolved with a Gaussian profile in order to reproduce the observed broadening of GIRAFFE and UVES spectra. The final linelists include transitions of elements belonging to the main groups, such as α, iron-peak, and neutron-capture, including 18 elements for UVES spectra and 12 elements for GIRAFFE spectra.
For species with unblended lines (Fe, Ca, Ti, Si, Cr, Ni, Zr, Y, and Nd), we measured their EWs with DAOSPEC (Stetson & Pancino 2008) through the wrapper 4DAO (Mucciarelli 2013), which also provides RVs of sample stars. Chemical abundances were derived from the measured EWs by using the code GALA (Mucciarelli et al. 2013). The line fitting was visually inspected line by line, with the purpose of identifying possible poorly fitted lines or erroneous determinations of the local continuum.
A different approach was adopted for the species with lines characterised by hyperfine and/or isotopic structure (Sc, V, Mn, Co, Cu, Ba, La, and Eu) or transitions located in noisy or complex spectral regions (Zn). Their abundances were derived with our own code, SALVADOR, which performs a χ2 minimisation between the observed line and a grid of synthetic models computed with the SYNTHE code, for which we only varied the abundance of the investigated element.
Solar values were taken from Grevesse & Sauval (1998) for all the elements. All the abundance ratios for individual stars are listed in Tables 3 and 4, together with the corresponding uncertainties described in Sect. 4.2. We adopted a maximum likelihood algorithm (see e.g. Pryor & Meylan 1993; Walker et al. 2006; Mucciarelli et al. 2012) to estimate for each cluster the average abundance ratios and their intrinsic scatter together with the associated uncertainty, obtained by taking into account the uncertainties of abundance ratios in individual stars. Table 5 lists the average abundance ratios for all the targets, together with the intrinsic (σint) and observed (σobs) spread.
Chemical abundances for the SMC GC stars.
Chemical abundances for the SMC GC stars.
Average abundance ratios for the SMC GCs, together with the error of the mean, the typical uncertainty of individual stars, and the number of stars.
4.2. Error estimates
Abundance uncertainties were computed by combining in quadrature the errors arising from the measure of line strengths and the uncertainties arising from atmospheric parameters (see Paper I for a detailed description). Internal errors due to the measurements were estimated as the standard error of the mean of the abundances of individual stars. For abundances from only one line, we propagated the error in the EW provided by DAOSPEC. For abundances from spectral synthesis, we relied on Monte Carlo simulations (see Minelli et al. 2021, for details). The uncertainties arising from the atmospheric parameters were computed by deriving the abundance variation due to the change in only one parameter at a time, and keeping the others fixed, except for Teff, which affects the values derived for log g and vt and which had to be changed accordingly.
The log g value depends on Teff and on the isochrone adopted. Uncertainties related to the choice of a specific isochrone were derived from the age and metallicity values adopted for each cluster. To be exact, we computed the variation in log g determined by a change of 1 Gyr in age and 0.1 dex in metallicity, which are the typical errors associated with these parameters. Specifically, variations in metallicity mainly affect the typical error associated with log g measurements, which is of the order of 0.07 dex.
Finally, typical errors associated with vt measurements are again different for GIRAFFE and UVES spectra, depending on the method used to derive their values. For UVES spectra, vt is derived spectroscopically and the typical uncertainties are of the order of 0.1 km s−1. For GIRAFFE targets, vt values have been derived from the log g − vt relation from Mucciarelli & Bonifacio (2020) and the adopted uncertainty is of 0.15 km s−1, taking into account the errors in log g and in the adopted calibration.
5. [Fe/H] abundances and RVs
Here we discuss iron abundances and the systemic RVs for the three target clusters, comparing them with estimates from the literature. For each cluster we provide the average [Fe/H] and RV together with the standard error of the average and the observed standard deviation (σobs).
For NGC 121 we derive an iron abundance of [Fe/H] = –1.18 ± 0.02 (σobs = 0.05) dex. Da Costa & Hatzidimitriou (1998) derived [Fe/H]=–1.19 ± 0.12 dex for this cluster using the Ca II triplet. The same high-resolution dataset discussed here was previously analysed by Dalessandro et al. (2016). They find an average [Fe/H] of –1.28 ± 0.03 dex (σ = 0.06 dex). The small difference between the two values is due to the differences in Teff. Indeed, the average difference between the Teff values derived in this study and those by Dalessandro et al. (2016) is +122 K, reflecting the difference in the zero point of the adopted Teff scales – Alonso et al. (1999) in Dalessandro et al. (2016) and González Hernández & Bonifacio (2009) in this study. The mean RV of this cluster is +144.7 ± 0.9 km s−1 (σobs = 1.9 km s−1), in good agreement with previous estimates based on low-resolution spectra. Radial velocities measured from integrated spectra of NGC 121 provide +139 ± 20 km s−1 (Zinn & West 1984), +138 ± 15 km s−1 (Hesser et al. 1986), and +147 ± 2 km s−1 (Dubath et al. 1997), while measures based on Ca II triplet lines of individual stars provide +138 ± 4 km s−1 (Da Costa & Hatzidimitriou 1998).
The intermediate-age GC NGC 339 has a metallicity similar to that of NGC 121, with [Fe/H] = –1.24 ± 0.01 (σobs = 0.02) dex. This value is consistent with those obtained from the Ca II triplet, [Fe/H]=–1.19 ± 0.10 dex (Da Costa & Hatzidimitriou 1998), and from photometry, [Fe/H]=–1.10 ± 0.12 dex (Narloch et al. 2021). The mean RV of NGC 339 is +113.4 ± 0.7 km s−1 (σobs = 1.9 km s−1), in excellent agreement with the value from Song et al. (2021) of +112.9 ± 0.4 km s−1 obtained from high-resolution spectra collected with M2FS on the Magellan/Clay Telescope. On the other hand, the average RV provided by Parisi et al. (2022) from low-resolution spectra is ∼10 km s−1 lower than ours. They attribute the similar difference with respect to the Song et al. (2021) estimate to a mis-centring of their stars in the slit.
Finally, the intermediate-age GC NGC 419 has a metallicity significantly higher than that of the other two clusters ([Fe/H] = –0.58 ± 0.02 dex, σobs = 0.04 dex). For this cluster, Parisi et al. (2022) provided [Fe/H] = –0.62 ± 0.02 dex from the Ca II triplet. Its mean RV is +188.2 ± 0.9 km s−1 (σobs = 2.5 km s−1). As with NGC 339, we have a good agreement with the measure provided by Song et al. (2021), 189.9 ± 0.3 km s−1, while the value from Parisi et al. (2022) is lower by ∼17 km s−1.
6. Age-metallicity relation
The left panel of Fig. 2 shows the behaviour of the measured [Fe/H] for the three target GCs as a function of the age. Age estimates are from Glatt et al. (2008a,b). Thanks to NGC 121, the metallicity reached by the SMC ∼2–3 Gyr after the earliest SF bursts can be precisely determined. Its metallicity ([Fe/H] = –1.18 dex) is lower than that reached by the LMC (Pagel & Tautvaisiene 1998; Harris & Zaritsky 2009) and MW (Haywood et al. 2013; Snaith et al. 2015) at the same epoch, as expected for a galaxy characterised by a lower SF efficiency. In Sect. 8 we compare in detail the properties of NGC 121 with the empirical AMR defined by the MW clusters.
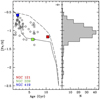 |
Fig. 2. AMR of the SMC clusters. Left panel: Average metallicity as a function of age (Glatt et al. 2009) for the three SMC GCs analysed in this work (same colour code as Fig. 1). SMC GCs from previous low-resolution works (Parisi et al. 2009, 2015, 2022; Dias et al. 2021) are plotted as open circles. Theoretical AMRs calculated by Pagel & Tautvaisiene (1998) are also reported (the solid curve is the bursting model and the dashed line the continuous model). Right panel: Metallicity distribution of the SMC field stars (Paper I). |
The [Fe/H] distribution of the SMC field stars analysed in Paper I is displayed in the right panel of Fig. 2. The comparison between this [Fe/H] distribution and the metallicity reached by the SMC at the different ages of the three target GCs allows us to constrain the age of the most metal-poor SMC field stars. In fact, it is likely that SMC field stars with [Fe/H] < –1.4/–1.5 dex, considerably lower than that of NGC 121, were created in the early epochs of the galaxy, showing its early enrichment (Nidever et al. 2020; Reggiani et al. 2021, Paper I).
Despite the large difference in their ages (∼4–5 Gyr), NGC 121 and NGC 339 have similar [Fe/H], hinting at a very low SF efficiency at those epochs that leads to an almost constant [Fe/H] over a large age range, or, perhaps, the effects of outflows. However, it is worth noting that the population of SMC GCs coeval to NGC 339 exhibits a significant spread in [Fe/H], as estimated using the Ca II triplet strength (Parisi et al. 2009, 2015, 2022; Dias et al. 2021). This [Fe/H] dispersion can only be partially explained by the metallicity gradient inside the SMC (see e.g. Carrera et al. 2008; Parisi et al. 2016; Grady et al. 2021, Paper I), and it may be indicative of different regions of the SMC being characterised by different chemical enrichment histories and AMRs (as already suggested by Dias et al. 2016, and Paper I). The metallicity of NGC 339 alone is not sufficient to disentangle the origin of the metallicity spread at those ages, but it could suggest a low SF efficiency in the Southern Bridge (the region where NGC 339 is located) with respect to other regions of the SMC.
Finally, NGC 419 has a significant higher [Fe/H] abundance, likely due to the sequence of intense bursts of SF occurring in the last 3 Gyr (Harris & Zaritsky 2009; Rubele et al. 2012; Massana et al. 2022), confirming that the chemical enrichment of the SMC has continued at a quicker pace over the past gigayear, increasing [Fe/H] up to ∼–0.6 dex.
In Fig. 2 we compare our results with the two theoretical AMR trends computed by Pagel & Tautvaisiene (1998), the first one assuming a closed-box model with a continuous SF rate and the second one with a long period without SF (or characterised by very low-level activity) between 12 and 4 Gyr ago and a SF burst 4 Gyr ago. Other AMRs have been proposed in the literature, both theoretical (Tsujimoto & Bekki 2009) and based on observed SF histories (Harris & Zaritsky 2004; Cignoni et al. 2013), and that are consistent with or intermediate between the two models from Pagel & Tautvaisiene (1998). The two models from Pagel & Tautvaisiene (1998) are similar to each other at the ages of NGC 121 and NGC 419 but clearly diverge at intermediate ages (corresponding to the age of NGC 339 and to where a large [Fe/H] scatter among GCs has been observed). This highlights the importance of deriving with high-resolution spectroscopy the chemical composition of other clusters coeval to NGC 339.
7. Abundance ratios
We discuss the abundance ratios of the three target GCs for α (Si, Ca, and Ti), iron-peak (Sc, V, Cr, Mn, Co, Ni, Cu, and Zn), s-process (Y, Zr, Ba, La, and Nd), and r-process (Eu) elements. For all the abundance ratios discussed in this section, the observed scatters are compatible with null intrinsic scatter (see Table 5). Figures 3–5 show the individual abundance ratios as a function of [Fe/H] for the SMC GCs, the MW GCs of the control sample, and the SMC field stars from Paper I. It is worth noting that we take the stars of Paper I into consideration regardless of their position within the galaxy. However, differences in the metallicity distribution of different regions, as well as some small systematic differences in the abundance patterns of some elements, have been detected, enforcing the idea that the SMC has been characterised by a spatially non-uniform chemical enrichment history. In addition, literature abundances from high-resolution spectra for MW field stars are shown for reference. Mean abundance ratios for the MW control sample are listed in Appendix A.
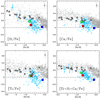 |
Fig. 3. α-elements abundance ratios (Si, Ca, and Ti, and their mean value, from the top-left panel to the bottom-right panel) as a function of [Fe/H] for SMC GCs (coloured squares: NGC 121 in red, NGC 339 in green, and NGC 419 in blue), SMC field stars (light blue open dots, Mucciarelli et al. 2021b), MW GCs from the control sample (grey squares), and MW field stars (grey dots). Arrows indicate upper limits. MW field stars are from Edvardsson et al. (1993), Fulbright (2000), Stephens & Boesgaard (2002), Gratton et al. (2003), Reddy et al. (2003, 2006), Barklem et al. (2005), Bensby et al. (2005), Adibekyan et al. (2012), Roederer & Lawler (2012), Mishenina et al. (2013) and Reggiani et al. (2017). The abundance errors for the SMC GCs are reported as error bars; the thin bar is the typical total uncertainty for individual stars, and the thick bar is the error of the mean value of the GC. |
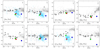 |
Fig. 4. Iron-peak elements’ abundance ratios as a function of [Fe/H], for SMC and MW GCs and field stars (same symbols and data as in Fig. 3). MW field stars data are from Fulbright (2000), Stephens & Boesgaard (2002), Gratton et al. (2003), Reddy et al. (2003, 2006), Bensby et al. (2005), Adibekyan et al. (2012), Roederer & Lawler (2012) and Reggiani et al. (2017). |
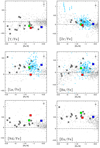 |
Fig. 5. Neutron-capture elements’ abundance ratios (Y, Zr, Ba, La, Nd, and Eu, from the top-left panel to the bottom-right panel) as a function of [Fe/H], for SMC and MW GCs and field stars (same symbols and data as in Fig. 3). MW field star data are from Edvardsson et al. (1993), Burris et al. (2000), Fulbright (2000), Stephens & Boesgaard (2002), Reddy et al. (2003, 2006), Barklem et al. (2005), Bensby et al. (2005), Roederer & Lawler (2012), Mishenina et al. (2013), Yan et al. (2015), Battistini & Bensby (2016), Reggiani et al. (2017) and Forsberg et al. (2019). |
7.1. α-elements
Figure 3 shows the abundance ratios of the explosive α-elements Si, Ca, and Ti and their average abundance. These elements are mainly produced in massive stars and ejected into the interstellar medium via core-collapse supernovae, with a small but not negligible contribution from Type Ia supernovae, especially for Ca and Ti (see e.g. Kobayashi et al. 2020).
The abundance ratios of the SMC GCs nicely agree with those of the SMC field stars. All the clusters display [α/Fe] lower than those measured in MW (field and GCs) stars of similar metallicity. In particular, NGC 121 has nearly solar-scaled [α/Fe] abundance ratios, showing that at that age (∼10.5 Gyr) the SMC had already been enriched by SNe Ia (see also Sect. 8).
NGC 339 shows only marginally higher (by ∼0.1 dex) [Si/Fe] and [Ca/Fe] values and similar [Ti/Fe]. We can infer that these two clusters have similar [α/Fe]. This is evidence for a poor enrichment both in Fe and α-elements over the large range of time covered by these two clusters, which points to a low SF rate when the SMC evolved in isolation. Lower [α/Fe] values are found in NGC 419, demonstrating that at that age, too, the chemical enrichment is dominated by SNe Ia. Overall, the run of [α/Fe] with [Fe/H] for these three GCs is consistent with the results from the APOGEE survey (Nidever et al. 2020; Hasselquist et al. 2021; Fernandes et al. 2023).
7.2. Iron-peak elements
Iron-peak elements are mainly produced in CC-SNe (both standard Type II and hypernovae (HNe)), with some of them receiving an important contribution from SNe Ia. In particular, Sc, Cu, and Zn are almost completely produced by massive stars, V and Co are mainly produced by massive stars but with a small contribution from SNe Ia, and Cr, Mn, and Ni are mostly from SNe Ia (Romano et al. 2010; Kobayashi et al. 2020; Palla et al. 2020). We stress that the abundances of these elements in the SMC are still poorly investigated; apart from the Sc, V, Ni, and Cu abundances we derived in Paper I, only abundances of Ni for SMC field stars obtained by the APOGEE survey have been discussed (Hasselquist et al. 2021).
Almost all the iron-peak elements measured in these GCs exhibit abundance ratios lower than those observed in MW stars. In particular, these differences are more pronounced in those elements produced mainly in massive stars, such as Sc, V, and Zn. NGC 419 generally shows the most pronounced discrepancies, with differences reaching –0.8 and –0.7 dex for [Cu/Fe] and [Zn/Fe], respectively. In the following we discuss in detail the abundances of three key iron-peak elements that are crucial for constraining the chemical enrichment history of the SMC, namely Mn (produced almost totally in SNe Ia), Cu (produced via the s-process in massive stars), and Zn (almost totally built by HN).
In our Galaxy, [Mn/Fe] is sub-solar until [Fe/H] ∼ –1 dex because at these metallicities it is produced only by CC-SNe and in a small amount. At higher metallicities, [Mn/Fe] significantly increases due to the dominant contribution by SNe Ia. The Mn yields increase with the metallicity of the SN Ia progenitor and are also sensitive to the explosion mechanism of the SNe Ia (Badenes et al. 2008). This behaviour is well reproduced by our MW control sample (see also Sobeck et al. 2006). Concerning the SMC, NGC 121 and NGC 339 have [Mn/Fe] values compatible with those of the MW control sample, indicating a similarly low production of Mn in early times. At higher metallicities, NGC 419 has a [Mn/Fe] comparable with the other two GCs but in stark disagreement with the MW stars of similar [Fe/H]. This suggests that at these ages the enrichment of Mn has been dominated by metal-poor SNe Ia (or at least more-metal poor SNe Ia than those dominating the Mn production in our Galaxy).
Copper is mainly produced in massive stars via the weak s-process. In our Galaxy, [Cu/Fe] increases with the metallicity, reflecting the metallicity dependence of the Cu yields (Romano & Matteucci 2007). As discussed in Paper I, the SMC field stars exhibit lower [Cu/Fe] than the MW stars, despite the large star-to-star scatter, limiting our conclusions about the average trend of [Cu/Fe] with [Fe/H]. As for the SMC clusters, NGC 121 and NGC 419 have significantly lower [Cu/Fe] than the MW stars and GCs, while NGC 339 has a value barely consistent with the MW control sample but still compatible with the SMC field stars. In general, the low [Cu/Fe] values in these clusters, in particular in NGC 419, support a scenario in which the contribution by massive stars is significantly reduced in the SMC.
Zinc is produced mainly in HNe, explosions with significantly more energy than those of standard CC-SNe and associated with stars more massive than ∼30–35 M⊙ (Kobayashi et al. 2006; Nomoto et al. 2013). Therefore, Zn offers crucial hints regarding the contribution of HNe and high-mass stars. We are able to measure Zn only in NGC 339 and NGC 419, both having [Zn/Fe] values lower than the MW stars. In particular, NGC 419 has [Zn/Fe] ≃ –0.7 dex, while the MW stars at similar metallicities have nearly solar abundance ratios. This element also supports a chemical enrichment in the SMC in which the contribution by massive stars (and in particular by HNe) is significantly reduced with respect to the MW. Low [Zn/Fe] abundance ratios have been measured in other dwarf galaxies characterised by a low SF efficiency and a small contribution by massive stars, such as Sagittarius (Sbordone et al. 2007; Minelli et al. 2021), Sculptor (Skúladóttir et al. 2017), and the LMC (Mucciarelli et al. 2021b), confirming that systems less massive than the MW have a lower contribution from HNe.
7.3. Slow neutron-capture elements
The derived abundance ratios for Y, Zr, Ba, La, and Nd are reported in Fig. 5 as a function of the metallicity. These elements are mainly produced through s-processes in asymptotic giant branch (AGB) stars. In particular, the light s-process elements Y and Zr are produced by AGB stars over a large mass range, while the heavy s-process elements Ba, La, and Nd are mainly produced by AGB stars with masses lower than 4 M⊙. The ratio of heavy-to-light s-process elements is sensitive to the metallicity (Gallino et al. 1998; Busso et al. 1999): when the metallicity of AGB stars increases, the production of light s-process elements is favoured over heavy ones.
The SMC GCs have similar [Y/Fe] and [Zr/Fe], consistent with the MW stars, suggesting a similar enrichment by high-metallicity and/or intermediate-mass AGB stars. Interesting differences are observed for Ba and La (Nd is known to be produced equally by s- and r-processes). In fact, NGC 121 has slightly lower [Ba/Fe] and [La/Fe] than the MW GCs, while NGC 339 has [Ba/Fe] and [La/Fe] ratios higher by ∼0.3 dex than MW clusters at similar [Fe/H]. NGC 419 has enhanced values for both the abundance ratios.
We used the [(Ba+La)/(Y+Zr)] abundance ratio to evaluate the relative contributions of heavy and light s-process elements. This ratio increases with a decrease in the cluster age, from ∼+0.1 dex in NGC 121 up to +0.4 dex in NGC 419. This indicates that at younger ages the production of these elements is dominated by metal-poor AGB stars that produce especially heavy s-process elements, as expected.
7.4. Rapid neutron-capture elements
The r-processes occur in the presence of a very high neutron flux (> 1020 neutron cm−3). Several sites of production have been proposed, such as neutron-star mergers (Lattimer & Schramm 1974), collapsars (Siegel et al. 2019), and proto-magnetars (Nishimura et al. 2015). The detection of r-process elements in the kilonova event associated with the gravitational wave GW170817 (Abbott et al. 2017) confirmed that neutron-star mergers are an important r-process production site, even if the time-delay distribution for the merging process remains unknown. However, chemical evolution models that include neutron-star mergers as the only r-process source are not able to reproduce the Galactic [Eu/Fe] distribution (see e.g. Molero et al. 2021).
We derived abundances for the pure r-process element Eu. The only measures of Eu abundances in the SMC available so far are provided by Reggiani et al. (2021), who measured [Eu/Fe] in two metal-poor ([Fe/H] < –2.0 dex) SMC field stars. These two stars are characterised by a high value of [Eu/Fe] (∼+0.8/+1.0 dex), similar to those measured in the LMC and MW stars of similar metallicity. The three SMC GCs discussed here have enhanced [Eu/Fe] values compatible with those of the MW GC control sample. This finding suggests that the production of the r-process is very efficient in the SMC over a large range of ages. In particular, it also continues at an age of ∼1.5 Gyr (the age of NGC 419), at which the contribution of SNe Ia is significant, as demonstrated by the low [α/Fe] ratios of NGC 419. The consistent [Eu/Fe] at various [Fe/H] ratios seems to indicate that the timescales for the synthesis of Eu and Fe (the production of the latter being dominated by SNe Ia) are fairly similar. The measured [Eu/Fe] ratios thus provide a crucial constraint on the timescale of Eu production and seem to suggest a dominant contribution from neutron-star mergers. This issue will be further analysed by us by means of detailed chemical-evolution models (D. Romano et al., in prep.).
7.5. Relative contribution of r- and s-processes
The simultaneous measure of s-process elements produced by AGB stars and the pure r-process element Eu allows us to study the contribution of the r-process at different ages. In fact, because elements such as Ba and La are mainly produced by AGB stars, this contribution starts to dominate the enrichment with a delay after the onset of the SF. Therefore, at low metallicity, the production of Ba and La is dominated by the r-processes. The ratio [(Ba+La)/Eu] provides the relative contribution of these two processes. NGC 121 and NGC 339 have similar [(Ba+La)/Eu] ratios (∼–0.5 dex), close to the theoretical values predicted in the case of the pure r-process (see e.g. Bisterzo et al. 2014). This finding suggests that the production of Ba and La in these clusters is still dominated by the r-processes and the contribution by AGB stars is negligible. However, in NGC 419, this ratio climbs to −0.2 dex, indicating a rising contribution from AGB stars. A similar increase in the ratio between the s-process and Eu with the metallicity has been observed in other dwarf galaxies (see e.g. Van der Swaelmen et al. 2013; McWilliam et al. 2013; Hill et al. 2019; Minelli et al. 2021).
8. Comparison between NGC 121, in situ Milky Way clusters, and Gaia-Enceladus clusters
The old cluster NGC 121 allows us to compare the chemical properties of the SMC in its early stages with those of MW GCs of similar ages. The SMC reached an iron content of [Fe/H] ∼ –1.2 dex at an age of ∼10.5 Gyr. We compare the properties (age, [Fe/H], and [α/Fe]) of NGC 121 with those of the MW in situ GCs and those associated with the main marger event of the MW, named Gaia-Enceladus (G-E, Helmi et al. 2018). It has been suggested that the stellar mass of the progenitor of G-E should be comparable with the present-day stellar mass of the SMC, ∼5 − 6 × 10⁸ M⊙ (van der Marel et al. 2009; Helmi et al. 2018).
We consider the trends of age versus metallicity for the MW in situ and G-E clusters, adopting the dynamical selection by Massari et al. (2019). The upper panel of Fig. 6 shows the behaviour of age from VandenBerg et al. (2013) as a function of [Fe/H] for the MW in situ and G-E clusters, in comparison with NGC 121. For [Fe/H] > –1.5 dex, the MW in situ and G-E clusters define two distinct sequences in the age-[Fe/H] plane. It is remarkable that the MW in situ GCs at a comparable age to that of NGC 121 are significantly more metal-rich, reaching [Fe/H] ∼ –0.5 dex. On the other hand, NGC 121 closely matches the AMR described by G-E GCs. Yet, despite the consistency between NGC 121 and the G-E AMR suggesting that its former progenitor (the SMC) might have followed an evolution similar to that of G-E, a significant difference arises when considering their α elements, in the form of [(Si+Ca)/Fe] ratios (we consider only these two α-elements because they are available for a large number of GCs, while Ti abundances are not available for some of them). The lower panel of Fig. 6 shows the behaviour of [(Si+Ca)/Fe] as a function of [Fe/H] for MW in situ clusters, G-E clusters, and NGC 121. The clusters associated with G-E, despite starting to deviate from the sequence of the MW in situ GCs at lower [Fe/H], still show values of [(Si+Ca)/Fe] ∼ 0.2 dex at the metallicity of NGC 121. NGC 121, by contrast, shows a nearly solar value, indicating a formation environment already dominated by SN Ia enrichment, at odds with the G-E clusters for which SNe Ia have just started to pollute their CC-SNe-dominated star-forming gas. This comparison provides robust evidence for distinct chemical-evolution histories between the SMC and GE, with the SMC having experienced a slower and less efficient SF compared to G-E. This is consistent with the fact that the SMC mass at ∼10.5 Gyr was likely significantly lower than that of G-E. A similar result has also been suggested by Hasselquist et al. (2021) and Fernandes et al. (2023) based on the chemical patterns of SMC and G-E field stars (hence without taking the stellar ages into account, which can be done via GCs). It should be emphasised that the interaction of G-E with the MW during the cannibalisation process might have triggered a SF burst and, hence, higher SF rates than experienced by the SMC during its quiet evolution in isolation. A sudden SF burst is expected to restore the [α/Fe] ratios to values more typical of those of CC-SN ejecta.
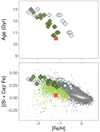 |
Fig. 6. Behaviour of age and [(Si+Ca)/Fe] as a function of [Fe/H] (upper and lower panel, respectively) for the MW in situ GCs (grey diamonds), for G-E (green diamonds), and for NGC 121 (red square). For MW GCs, the ages are from VandenBerg et al. (2013). The chemical abundances are from the MW control sample of this study and from Marino et al. (2011, 2015, 2021), Carretta et al. (2013, 2014), Muñoz et al. (2013), Koch & McWilliam (2014), San Roman et al. (2015), Johnson et al. (2016), Rojas-Arriagada et al. (2016), Villanova et al. (2016), Massari et al. (2017), Mura-Guzmán et al. (2018), Masseron et al. (2019), and Koch-Hansen et al. (2021). Dynamical associations of the GCs are from Massari et al. (2019). In the lower panel, [(Si+Ca)/Fe] from the APOGEE results from the 17th Data Release of the Sloan Digital Sky Survey (Abdurro’uf et al. 2022) are shown for the sake of comparison, and consider MW giant stars within 2 kpc (grey points) and G-E stars (light green circles) selected according to Hasselquist et al. (2021). |
9. Summary
This study provides a time-resolved reconstruction of the chemical enrichment history of the SMC galaxy by presenting for the first time the detailed chemical composition, based on high-resolution spectra, of three clusters over a wide age range. The following is a summary of the main findings:
-
We can place constraints on the metallicity that the SMC attained at certain ages using the derived [Fe/H] of the three GCs. The relationship between [Fe/H] and cluster age is in excellent accord with the theoretical AMR proposed by Pagel & Tautvaisiene (1998), which incorporated a sizeable halt in SF between the first burst and the subsequent one at 4 Gyr. However, given the wide metallicity variance seen at any age (see e.g. Parisi et al. 2022), our sample of clusters should not be seen as being as indicative of the entire SMC. This spread may have been influenced by the SMC’s metallicity gradient and the existence of varied chemical enrichment histories at different SMC sites (as originally mentioned in Paper I), which reflect turbulent interactions between the SMC and the LMC.
-
We derived the abundance ratios for elements belonging to the main groups (α, iron-peak, and neutron-capture) and compared them with the abundances of SMC field stars (Paper I). The two samples have similar (homogenous) abundances in all the elements, indicating that GCs and field stars experienced a similar chemical enrichment. The comparison between abundances of SMC and MW GCs highlights their different chemical enrichment histories. In particular, the enrichment of the SMC (at least in the age range explored in this study) is dominated by SNe Ia and displays a lower contribution from massive stars.
-
Despite having an age difference of about 4–5 Gyr, the ancient cluster NGC 121 and the intermediate-age cluster NGC 339 exhibit identical [Fe/H] values and similar abundances for the majority of the measured elements. Differences of about 0.2–0.3 dex are observed only for heavy s-process elements. These results suggest a similar chemical enrichment by CC-SNe and SNe Ia but an increase in the contribution of the metal-poor AGB stars with age.
-
The young (1.4 Gyr) cluster NGC 419 has chemical patterns that are markedly different from those of the other GCs, including higher [Fe/H], lower [α/Fe] and [Zn/Fe], and higher heavy s-process elements. These abundances show that the metal-poor AGB stars and SNe Ia made a significant contribution to the evolution of the SMC at that age, although HNe also made an, albeit less significant, contribution, as shown by the extremely low [Zn/Fe] ratio. It is interesting to note that [Eu/Fe] in this cluster is enhanced, indicating that r-process production in the SMC is extremely efficient over a wide range of ages, including at an age of around 1.5 Gyr, at which the contribution of SNe Ia is considerable, as evidenced by its low [α/Fe] ratios.
-
We contrasted the characteristics of the old SMC cluster NGC 121 with those of MW clusters formed in situ and clusters connected to the G-E merger event. The early SMC and G-E have both attained the same metallicity at the same age as NGC 121, but their [α/Fe] ratios are different, with the SMC and G-E displaying larger values than NGC 121, which has solar-scaled [α/Fe] ratios. This shows that the SMC and G-E have distinct histories of chemical enrichment, most likely a quiet and a bursty one, respectively, because of the interaction of G-E with the MW as opposed to the evolution in isolation of the SMC. Furthermore, the SMC at early ages had a mass lower than G-E.
Acknowledgments
We thank the anonymous referee for the useful and constructive suggestions. This research is funded by the project “Light-on-Dark”, granted by the Italian MIUR through contract PRIN-2017K7REXT. C. Lardo acknowledges funding from Ministero dell’Universitá e della Ricerca through the Programme Rita Levi Montalcini (grant PGR18YRML1).
References
- Abbott, B. P., Abbott, R., Abbott, T. D., et al. 2017, Phys. Rev. Lett., 119, 161101 [Google Scholar]
- Abdurro’uf, Accetta, K., Aerts, C., et al. 2022, ApJS, 259, 35 [NASA ADS] [CrossRef] [Google Scholar]
- Adibekyan, V. Z., Sousa, S. G., Santos, N. C., et al. 2012, A&A, 545, A32 [NASA ADS] [CrossRef] [EDP Sciences] [Google Scholar]
- Alonso, A., Arribas, S., & Martinez-Roger, C. 1999, A&AS, 140, 261 [CrossRef] [EDP Sciences] [Google Scholar]
- Badenes, C., Bravo, E., & Hughes, J. P. 2008, ApJ, 680, L33 [NASA ADS] [CrossRef] [Google Scholar]
- Barklem, P. S., Christlieb, N., Beers, T. C., et al. 2005, A&A, 439, 129 [NASA ADS] [CrossRef] [EDP Sciences] [Google Scholar]
- Bastian, N., & Lardo, C. 2018, ARA&A, 56, 83 [Google Scholar]
- Battistini, C., & Bensby, T. 2016, A&A, 586, A49 [NASA ADS] [CrossRef] [EDP Sciences] [Google Scholar]
- Belokurov, V., Erkal, D., Deason, A. J., et al. 2017, MNRAS, 466, 4711 [Google Scholar]
- Bensby, T., Feltzing, S., Lundström, I., et al. 2005, A&A, 433, 185 [NASA ADS] [CrossRef] [EDP Sciences] [Google Scholar]
- Besla, G., Kallivayalil, N., Hernquist, L., et al. 2007, ApJ, 668, 949 [Google Scholar]
- Besla, G., Kallivayalil, N., Hernquist, L., et al. 2012, MNRAS, 421, 2109 [Google Scholar]
- Bihain, G., Israelian, G., Rebolo, R., et al. 2004, A&A, 423, 777 [NASA ADS] [CrossRef] [EDP Sciences] [Google Scholar]
- Bisterzo, S., Travaglio, C., Gallino, R., et al. 2014, ApJ, 787, 10 [NASA ADS] [CrossRef] [Google Scholar]
- Brocato, E., Castellani, V., Ferraro, F. R., et al. 1996, MNRAS, 282, 614 [NASA ADS] [CrossRef] [Google Scholar]
- Burris, D. L., Pilachowski, C. A., Armandroff, T. E., et al. 2000, ApJ, 544, 302 [Google Scholar]
- Busso, M., Gallino, R., & Wasserburg, G. J. 1999, ARA&A, 37, 239 [Google Scholar]
- Byrd, G., Valtonen, M., McCall, M., et al. 1994, AJ, 107, 2055 [NASA ADS] [CrossRef] [Google Scholar]
- Carrera, R., Gallart, C., Aparicio, A., et al. 2008, AJ, 136, 1039 [Google Scholar]
- Carretta, E., Bragaglia, A., Gratton, R. G., et al. 2013, A&A, 557, A138 [NASA ADS] [CrossRef] [EDP Sciences] [Google Scholar]
- Carretta, E., Bragaglia, A., Gratton, R. G., et al. 2014, A&A, 564, A60 [NASA ADS] [CrossRef] [EDP Sciences] [Google Scholar]
- Cignoni, M., Cole, A. A., Tosi, M., et al. 2013, ApJ, 775, 83 [Google Scholar]
- Cioni, M.-R. L., Clementini, G., Girardi, L., et al. 2011, A&A, 527, A116 [CrossRef] [EDP Sciences] [Google Scholar]
- Cioni, M.-R. L., Storm, J., Bell, C. P. M., et al. 2019, The Messenger, 175, 54 [NASA ADS] [Google Scholar]
- Da Costa, G. S., & Hatzidimitriou, D. 1998, AJ, 115, 1934 [Google Scholar]
- Dalessandro, E., Lapenna, E., Mucciarelli, A., et al. 2016, ApJ, 829, 77 [NASA ADS] [CrossRef] [Google Scholar]
- Dias, B., Kerber, L., Barbuy, B., et al. 2016, A&A, 591, A11 [NASA ADS] [CrossRef] [EDP Sciences] [Google Scholar]
- Dias, B., Angelo, M. S., Oliveira, R. A. P., et al. 2021, A&A, 647, L9 [NASA ADS] [CrossRef] [EDP Sciences] [Google Scholar]
- Dias, B., Parisi, M. C., Angelo, M., et al. 2022, MNRAS, 512, 4334 [NASA ADS] [CrossRef] [Google Scholar]
- Diaz, J., & Bekki, K. 2011, MNRAS, 413, 2015 [Google Scholar]
- Diaz, J. D., & Bekki, K. 2012, ApJ, 750, 36 [Google Scholar]
- Dresbach, F., Massari, D., Lanzoni, B., et al. 2022, ApJ, 928, 47 [NASA ADS] [CrossRef] [Google Scholar]
- D’Onghia, E., & Fox, A. J. 2016, ARA&A, 54, 363 [CrossRef] [Google Scholar]
- Dotter, A., Chaboyer, B., Jevremović, D., et al. 2008, ApJS, 178, 89 [Google Scholar]
- Dubath, P., Meylan, G., & Mayor, M. 1997, A&A, 324, 505 [NASA ADS] [Google Scholar]
- Edvardsson, B., Andersen, J., Gustafsson, B., et al. 1993, A&A, 500, 391 [NASA ADS] [Google Scholar]
- Fernandes, L., Mason, A. C., Horta, D., et al. 2023, MNRAS, 519, 3611 [NASA ADS] [CrossRef] [Google Scholar]
- Forsberg, R., Jönsson, H., Ryde, N., et al. 2019, A&A, 631, A113 [NASA ADS] [CrossRef] [EDP Sciences] [Google Scholar]
- Fulbright, J. P. 2000, AJ, 120, 1841 [NASA ADS] [CrossRef] [Google Scholar]
- Gallino, R., Arlandini, C., Busso, M., et al. 1998, ApJ, 497, 388 [Google Scholar]
- Gatto, M., Ripepi, V., Bellazzini, M., et al. 2022, A&A, 664, L12 [NASA ADS] [CrossRef] [EDP Sciences] [Google Scholar]
- Glatt, K., Gallagher, J. S., Grebel, E. K., et al. 2008a, AJ, 135, 1106 [NASA ADS] [CrossRef] [Google Scholar]
- Glatt, K., Grebel, E. K., Sabbi, E., et al. 2008b, AJ, 136, 1703 [Google Scholar]
- Glatt, K., Grebel, E. K., Gallagher, J. S., et al. 2009, AJ, 138, 1403 [NASA ADS] [CrossRef] [Google Scholar]
- Gonzalez, O. A., Mucciarelli, A., Origlia, L., et al. 2020, The Messenger, 180, 18 [NASA ADS] [Google Scholar]
- González Hernández, J. I., & Bonifacio, P. 2009, A&A, 497, 497 [Google Scholar]
- Grady, J., Belokurov, V., & Evans, N. W. 2021, ApJ, 909, 150 [Google Scholar]
- Gratton, R. G., Carretta, E., Claudi, R., et al. 2003, A&A, 404, 187 [NASA ADS] [CrossRef] [EDP Sciences] [Google Scholar]
- Gratton, R. G., Carretta, E., & Bragaglia, A. 2012, A&ARv, 20, 50 [CrossRef] [Google Scholar]
- Grevesse, N., & Sauval, A. J. 1998, Space Sci. Rev., 85, 161 [Google Scholar]
- Johnson, C. I., Caldwell, N., Rich, R. M., et al. 2016, AJ, 152, 21 [NASA ADS] [CrossRef] [Google Scholar]
- Harris, J., & Zaritsky, D. 2004, AJ, 127, 1531 [NASA ADS] [CrossRef] [Google Scholar]
- Harris, J., & Zaritsky, D. 2009, AJ, 138, 1243 [NASA ADS] [CrossRef] [Google Scholar]
- Hasselquist, S., Hayes, C. R., Lian, J., et al. 2021, ApJ, 923, 172 [NASA ADS] [CrossRef] [Google Scholar]
- Haywood, M., Di Matteo, P., Lehnert, M. D., et al. 2013, A&A, 560, A109 [NASA ADS] [CrossRef] [EDP Sciences] [Google Scholar]
- Helmi, A., Babusiaux, C., Koppelman, H. H., et al. 2018, Nature, 563, 85 [Google Scholar]
- Hesser, J. E., Shawl, S. J., & Meyer, J. E. 1986, PASP, 98, 403 [Google Scholar]
- Hill, V. 1999, A&A, 345, 430 [NASA ADS] [Google Scholar]
- Hill, V., Skúladóttir, Á., Tolstoy, E., et al. 2019, A&A, 626, A15 [NASA ADS] [CrossRef] [EDP Sciences] [Google Scholar]
- Kobayashi, C., Umeda, H., Nomoto, K., et al. 2006, ApJ, 653, 1145 [NASA ADS] [CrossRef] [Google Scholar]
- Kobayashi, C., Karakas, A. I., & Lugaro, M. 2020, ApJ, 900, 179 [Google Scholar]
- Koch, A., & McWilliam, A. 2014, A&A, 565, A23 [NASA ADS] [CrossRef] [EDP Sciences] [Google Scholar]
- Koch-Hansen, A. J., Hansen, C. J., & McWilliam, A. 2021, A&A, 653, A2 [NASA ADS] [CrossRef] [EDP Sciences] [Google Scholar]
- Kurucz, R. L. 1993, VizieR Online Data Catalog: VI/39 [Google Scholar]
- Kurucz, R. L. 2005, Mem. Soc. Astron. It. Suppl., 8, 14 [Google Scholar]
- Lattimer, J. M., & Schramm, D. N. 1974, ApJ, 192, L145 [NASA ADS] [CrossRef] [Google Scholar]
- Mackey, A. D., Payne, M. J., & Gilmore, G. F. 2006, MNRAS, 369, 921 [NASA ADS] [CrossRef] [Google Scholar]
- Maia, F. F. S., Dias, B., Santos, J. F. C., et al. 2019, MNRAS, 484, 5702 [Google Scholar]
- Marino, A. F., Sneden, C., Kraft, R. P., et al. 2011, A&A, 532, A8 [NASA ADS] [CrossRef] [EDP Sciences] [Google Scholar]
- Marino, A. F., Milone, A. P., Karakas, A. I., et al. 2015, MNRAS, 450, 815 [NASA ADS] [CrossRef] [Google Scholar]
- Marino, A. F., Milone, A. P., Renzini, A., et al. 2021, ApJ, 923, 22 [CrossRef] [Google Scholar]
- Massana, P., Ruiz-Lara, T., Noël, N. E. D., et al. 2022, MNRAS, 513, L40 [CrossRef] [Google Scholar]
- Massari, D., Mucciarelli, A., Dalessandro, E., et al. 2017, MNRAS, 468, 1249 [Google Scholar]
- Massari, D., Koppelman, H. H., & Helmi, A. 2019, A&A, 630, L4 [NASA ADS] [CrossRef] [EDP Sciences] [Google Scholar]
- Massari, D., Raso, S., Libralato, M., et al. 2021, MNRAS, 500, 2012 [Google Scholar]
- Masseron, T., García-Hernández, D. A., Mészáros, S., et al. 2019, A&A, 622, A191 [NASA ADS] [CrossRef] [EDP Sciences] [Google Scholar]
- McWilliam, A., Wallerstein, G., & Mottini, M. 2013, ApJ, 778, 149 [NASA ADS] [CrossRef] [Google Scholar]
- Milone, A. P., Piotto, G., Renzini, A., et al. 2017, MNRAS, 464, 3636 [Google Scholar]
- Minelli, A., Mucciarelli, A., Romano, D., et al. 2021, ApJ, 910, 114 [CrossRef] [Google Scholar]
- Mishenina, T. V., Pignatari, M., Korotin, S. A., et al. 2013, A&A, 552, A128 [NASA ADS] [CrossRef] [EDP Sciences] [Google Scholar]
- Molero, M., Simonetti, P., Matteucci, F., et al. 2021, MNRAS, 500, 1071 [Google Scholar]
- Mucciarelli, A. 2013, ArXiv e-prints [arXiv:1311.1403] [Google Scholar]
- Mucciarelli, A., & Bonifacio, P. 2020, A&A, 640, A87 [NASA ADS] [CrossRef] [EDP Sciences] [Google Scholar]
- Mucciarelli, A., Origlia, L., Maraston, C., & Ferraro, F. R. 2009, ApJ, 690, 288 [NASA ADS] [CrossRef] [Google Scholar]
- Mucciarelli, A., Bellazzini, M., Ibata, R., et al. 2012, MNRAS, 426, 2889 [Google Scholar]
- Mucciarelli, A., Pancino, E., Lovisi, L., et al. 2013, ApJ, 766, 78 [NASA ADS] [CrossRef] [Google Scholar]
- Mucciarelli, A., Monaco, L., Bonifacio, P., et al. 2017, A&A, 603, L7 [NASA ADS] [CrossRef] [EDP Sciences] [Google Scholar]
- Mucciarelli, A., Bellazzini, M., & Massari, D. 2021a, A&A, 653, A90 [NASA ADS] [CrossRef] [EDP Sciences] [Google Scholar]
- Mucciarelli, A., Massari, D., Minelli, A., et al. 2021b, Nat. Astron., 5, 1247 [NASA ADS] [CrossRef] [Google Scholar]
- Mucciarelli, A., Minelli, A., Bellazzini, M., et al. 2023, A&A, 671, A124 [NASA ADS] [CrossRef] [EDP Sciences] [Google Scholar]
- Muñoz, C., Geisler, D., & Villanova, S. 2013, MNRAS, 433, 2006 [Google Scholar]
- Mura-Guzmán, A., Villanova, S., Muñoz, C., et al. 2018, MNRAS, 474, 4541 [CrossRef] [Google Scholar]
- Narloch, W., Pietrzyński, G., Gieren, W., et al. 2021, A&A, 647, A135 [NASA ADS] [CrossRef] [EDP Sciences] [Google Scholar]
- Nidever, D. L., Olsen, K., Walker, A. R., et al. 2017, AJ, 154, 199 [Google Scholar]
- Nidever, D. L., Hasselquist, S., Hayes, C. R., et al. 2020, ApJ, 895, 88 [Google Scholar]
- Nishimura, N., Takiwaki, T., & Thielemann, F.-K. 2015, ApJ, 810, 109 [Google Scholar]
- Nomoto, K., Kobayashi, C., & Tominaga, N. 2013, ARA&A, 51, 457 [CrossRef] [Google Scholar]
- Olsen, K. A. G., Hodge, P. W., Mateo, M., et al. 1998, MNRAS, 300, 665 [NASA ADS] [CrossRef] [Google Scholar]
- Pagel, B. E. J., & Tautvaisiene, G. 1998, MNRAS, 299, 535 [Google Scholar]
- Palla, M., Matteucci, F., Spitoni, E., et al. 2020, MNRAS, 498, 1710 [NASA ADS] [CrossRef] [Google Scholar]
- Parisi, M. C., Grocholski, A. J., Geisler, D., et al. 2009, AJ, 138, 517 [NASA ADS] [CrossRef] [Google Scholar]
- Parisi, M. C., Geisler, D., Clariá, J. J., et al. 2015, AJ, 149, 154 [Google Scholar]
- Parisi, M. C., Geisler, D., Carraro, G., et al. 2016, AJ, 152, 58 [NASA ADS] [Google Scholar]
- Parisi, M. C., Gramajo, L. V., Geisler, D., et al. 2022, A&A, 662, A75 [NASA ADS] [CrossRef] [EDP Sciences] [Google Scholar]
- Pasquini, L., Avila, G., Blecha, A., et al. 2002, The Messenger, 110, 1 [Google Scholar]
- Piatti, A. E. 2022, MNRAS, 511, L72 [NASA ADS] [CrossRef] [Google Scholar]
- Pryor, C., & Meylan, G. 1993, Structure and Dynamics of Globular Clusters, 50, 357 [NASA ADS] [Google Scholar]
- Reddy, B. E., Tomkin, J., Lambert, D. L., et al. 2003, MNRAS, 340, 304 [NASA ADS] [CrossRef] [Google Scholar]
- Reddy, B. E., Lambert, D. L., & Allende Prieto, C. 2006, MNRAS, 367, 1329 [Google Scholar]
- Reggiani, H., Meléndez, J., Kobayashi, C., et al. 2017, A&A, 608, A46 [NASA ADS] [CrossRef] [EDP Sciences] [Google Scholar]
- Reggiani, H., Schlaufman, K. C., Casey, A. R., et al. 2021, AJ, 162, 229 [NASA ADS] [CrossRef] [Google Scholar]
- Ripepi, V., Cignoni, M., Tosi, M., et al. 2014, MNRAS, 442, 1897 [NASA ADS] [CrossRef] [Google Scholar]
- Roederer, I. U., & Lawler, J. E. 2012, ApJ, 750, 76 [NASA ADS] [CrossRef] [Google Scholar]
- Rojas-Arriagada, A., Zoccali, M., Vásquez, S., et al. 2016, A&A, 587, A95 [NASA ADS] [CrossRef] [EDP Sciences] [Google Scholar]
- Romano, D., & Matteucci, F. 2007, MNRAS, 378, L59 [NASA ADS] [Google Scholar]
- Romano, D., Karakas, A. I., Tosi, M., et al. 2010, A&A, 522, A32 [NASA ADS] [CrossRef] [EDP Sciences] [Google Scholar]
- Rubele, S., Kerber, L., & Girardi, L. 2010, MNRAS, 403, 1156 [NASA ADS] [CrossRef] [Google Scholar]
- Rubele, S., Kerber, L., Girardi, L., et al. 2012, A&A, 537, A106 [NASA ADS] [CrossRef] [EDP Sciences] [Google Scholar]
- San Roman, I., Muñoz, C., Geisler, D., et al. 2015, A&A, 579, A6 [Google Scholar]
- Sbordone, L., Bonifacio, P., Buonanno, R., et al. 2007, A&A, 465, 815 [NASA ADS] [CrossRef] [EDP Sciences] [Google Scholar]
- Schlafly, E. F., & Finkbeiner, D. P. 2011, ApJ, 737, 103 [Google Scholar]
- Shuter, W. L. H. 1992, ApJ, 386, 101 [NASA ADS] [CrossRef] [Google Scholar]
- Siegel, D. M., Barnes, J., & Metzger, B. D. 2019, Nature, 569, 241 [Google Scholar]
- Skowron, D. M., Skowron, J., Udalski, A., et al. 2021, ApJS, 252, 23 [Google Scholar]
- Skúladóttir, Á., Tolstoy, E., Salvadori, S., et al. 2017, A&A, 606, A71 [NASA ADS] [CrossRef] [EDP Sciences] [Google Scholar]
- Snaith, O., Haywood, M., Di Matteo, P., et al. 2015, A&A, 578, A87 [NASA ADS] [CrossRef] [EDP Sciences] [Google Scholar]
- Sobeck, J. S., Ivans, I. I., Simmerer, J. A., et al. 2006, AJ, 131, 2949 [Google Scholar]
- Song, Y.-Y., Mateo, M., Bailey, J. I., et al. 2021, MNRAS, 504, 4160 [NASA ADS] [CrossRef] [Google Scholar]
- Stephens, A., & Boesgaard, A. M. 2002, AJ, 123, 1647 [NASA ADS] [CrossRef] [Google Scholar]
- Stetson, P. B., & Pancino, E. 2008, PASP, 120, 1332 [Google Scholar]
- Tsujimoto, T., & Bekki, K. 2009, ApJ, 700, L69 [Google Scholar]
- VandenBerg, D. A., Brogaard, K., Leaman, R., et al. 2013, ApJ, 775, 134 [NASA ADS] [CrossRef] [Google Scholar]
- van der Marel, R. P., Kallivayalil, N., & Besla, G. 2009, The Magellanic System: Stars, Gas, and Galaxies, 256, 81 [NASA ADS] [Google Scholar]
- Van der Swaelmen, M., Hill, V., Primas, F., et al. 2013, A&A, 560, A44 [NASA ADS] [CrossRef] [EDP Sciences] [Google Scholar]
- Villanova, S., Monaco, L., Moni Bidin, C., et al. 2016, MNRAS, 460, 2351 [CrossRef] [Google Scholar]
- Wagner-Kaiser, R., Mackey, D., Sarajedini, A., et al. 2017, MNRAS, 471, 3347 [Google Scholar]
- Walker, M. G., Mateo, M., Olszewski, E. W., et al. 2006, AJ, 131, 2114 [Google Scholar]
- Yan, H. L., Shi, J. R., & Zhao, G. 2015, ApJ, 802, 36 [NASA ADS] [CrossRef] [Google Scholar]
- Zinn, R., & West, M. J. 1984, ApJS, 55, 45 [Google Scholar]
Appendix A: Chemical abundance ratios for the MW control sample
The MW control sample includes spectra of the giant stars of 16 GCs retrieved from the ESO archive. All the spectra were secured with UVES-FLAMES adopting the Red Arm 580 configuration. We refer to Mucciarelli et al. (2021b) for further details on the MW GC sample (i.e. the number of observed stars and the corresponding observative programmes) and its analysis.
In Tables A.1, A.2, A.3, and A.4 we list for each MW target cluster the average abundance ratios together with the corresponding standard error and the observed dispersion of the mean, σobs.
MW GCs: average abundance ratios of iron and α elements (Si, Ca, Ti I, and Ti II) together with the corresponding standard error and dispersion of the mean.
MW GCs: average abundance ratios of iron-peak elements (Sc, V, Cr, and Mn) together with the corresponding standard error and dispersion of the mean.
MW GCs: average abundance ratios of iron-peak elements (Co, Ni, Cu, and Zn) together with the corresponding standard error and dispersion of the mean.
MW GCs: average abundance ratios of neutron-capture elements (Y, Zr, Ba, La, Nd, and Eu) together with the corresponding standard error and dispersion of the mean.
Appendix B: Comparison with APOGEE abundances
We compared the average abundance ratios for the three SMC target clusters discussed in this paper with the abundances derived in the APOGEE survey of SMC field stars using H-band high-resolution spectra. We used the results from the 17th Data Release of the Sloan Digital Sky Survey (Abdurro’uf et al. 2022), adopting the selection provided by Hasselquist et al. (2021) for the SMC stars. The elements in common between our analysis and APOGEE are the explosive α-elements Si, Ca, and Ti and the iron-peak elements V, Mn, and Ni. Fig. B.1 shows the behaviour of the abundance ratios of these six elements as a function of [Fe/H] for the three SMC clusters, the SMC field stars measured in Paper I, and the SMC field stars measured by APOGEE.
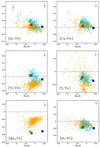 |
Fig. B.1. Behaviour of [Si/Fe], [Ca/Fe], [Ti/Fe], [V/Fe], [Mn/Fe], and [Ni/Fe] as a function of [Fe/H] for the three SMC target clusters (squares, same colours in Fig. 1.), SMC field stars of Paper I (cyan circles), and SMC field stars measured by APOGEE (orange circles). |
The [Si/Fe], [Ca/Fe], and [Ni/Fe] from APOGEE and FLAMES spectra agree well with one another. [Ti/Fe] measured by APOGEE is 0.2-0.3 dex lower than the values obtained with FLAMES and disagrees with the average values of the other [α/Fe] measured by APOGEE. We note that the abundances of the three explosive α-elements measured in Paper I are in better agreement with one another. This different behaviour is also reported in the APOGEE documentation3, in which the Ti abundances in giant stars are classified as ‘deviant’ because the measured trends are discrepant with respect to literature expectations. [V/Fe] exhibits a significant star-to-star scatter in the APOGEE data, larger than that of Paper I. According to the APOGEE documentation, V abundances in giant stars are classified as ‘less reliable.’ Finally, [Mn/Fe] is measured by APOGEE but not discussed in Paper I. There is an offset of ∼0.3 dex between the APOGEE [Mn/Fe] values and those measured in our SMC clusters. Mn abundances from APOGEE are classified as ‘most reliable’ and we attribute this offset to a systematic between the optical and near-infrared Mn transitions.
All Tables
Coordinates of the FLAMES pointings, the number of exposures, and exposure times for the GIRAFFE and UVES setups.
Average abundance ratios for the SMC GCs, together with the error of the mean, the typical uncertainty of individual stars, and the number of stars.
MW GCs: average abundance ratios of iron and α elements (Si, Ca, Ti I, and Ti II) together with the corresponding standard error and dispersion of the mean.
MW GCs: average abundance ratios of iron-peak elements (Sc, V, Cr, and Mn) together with the corresponding standard error and dispersion of the mean.
MW GCs: average abundance ratios of iron-peak elements (Co, Ni, Cu, and Zn) together with the corresponding standard error and dispersion of the mean.
MW GCs: average abundance ratios of neutron-capture elements (Y, Zr, Ba, La, Nd, and Eu) together with the corresponding standard error and dispersion of the mean.
All Figures
|
Fig. 1. (K, J − Ks) colour-magnitude diagrams of the three SMC GCs are plotted as small grey dots. Large coloured circles in each panel represent the spectroscopic targets analysed in this work. |
| In the text | |
|
Fig. 2. AMR of the SMC clusters. Left panel: Average metallicity as a function of age (Glatt et al. 2009) for the three SMC GCs analysed in this work (same colour code as Fig. 1). SMC GCs from previous low-resolution works (Parisi et al. 2009, 2015, 2022; Dias et al. 2021) are plotted as open circles. Theoretical AMRs calculated by Pagel & Tautvaisiene (1998) are also reported (the solid curve is the bursting model and the dashed line the continuous model). Right panel: Metallicity distribution of the SMC field stars (Paper I). |
| In the text | |
|
Fig. 3. α-elements abundance ratios (Si, Ca, and Ti, and their mean value, from the top-left panel to the bottom-right panel) as a function of [Fe/H] for SMC GCs (coloured squares: NGC 121 in red, NGC 339 in green, and NGC 419 in blue), SMC field stars (light blue open dots, Mucciarelli et al. 2021b), MW GCs from the control sample (grey squares), and MW field stars (grey dots). Arrows indicate upper limits. MW field stars are from Edvardsson et al. (1993), Fulbright (2000), Stephens & Boesgaard (2002), Gratton et al. (2003), Reddy et al. (2003, 2006), Barklem et al. (2005), Bensby et al. (2005), Adibekyan et al. (2012), Roederer & Lawler (2012), Mishenina et al. (2013) and Reggiani et al. (2017). The abundance errors for the SMC GCs are reported as error bars; the thin bar is the typical total uncertainty for individual stars, and the thick bar is the error of the mean value of the GC. |
| In the text | |
|
Fig. 4. Iron-peak elements’ abundance ratios as a function of [Fe/H], for SMC and MW GCs and field stars (same symbols and data as in Fig. 3). MW field stars data are from Fulbright (2000), Stephens & Boesgaard (2002), Gratton et al. (2003), Reddy et al. (2003, 2006), Bensby et al. (2005), Adibekyan et al. (2012), Roederer & Lawler (2012) and Reggiani et al. (2017). |
| In the text | |
|
Fig. 5. Neutron-capture elements’ abundance ratios (Y, Zr, Ba, La, Nd, and Eu, from the top-left panel to the bottom-right panel) as a function of [Fe/H], for SMC and MW GCs and field stars (same symbols and data as in Fig. 3). MW field star data are from Edvardsson et al. (1993), Burris et al. (2000), Fulbright (2000), Stephens & Boesgaard (2002), Reddy et al. (2003, 2006), Barklem et al. (2005), Bensby et al. (2005), Roederer & Lawler (2012), Mishenina et al. (2013), Yan et al. (2015), Battistini & Bensby (2016), Reggiani et al. (2017) and Forsberg et al. (2019). |
| In the text | |
|
Fig. 6. Behaviour of age and [(Si+Ca)/Fe] as a function of [Fe/H] (upper and lower panel, respectively) for the MW in situ GCs (grey diamonds), for G-E (green diamonds), and for NGC 121 (red square). For MW GCs, the ages are from VandenBerg et al. (2013). The chemical abundances are from the MW control sample of this study and from Marino et al. (2011, 2015, 2021), Carretta et al. (2013, 2014), Muñoz et al. (2013), Koch & McWilliam (2014), San Roman et al. (2015), Johnson et al. (2016), Rojas-Arriagada et al. (2016), Villanova et al. (2016), Massari et al. (2017), Mura-Guzmán et al. (2018), Masseron et al. (2019), and Koch-Hansen et al. (2021). Dynamical associations of the GCs are from Massari et al. (2019). In the lower panel, [(Si+Ca)/Fe] from the APOGEE results from the 17th Data Release of the Sloan Digital Sky Survey (Abdurro’uf et al. 2022) are shown for the sake of comparison, and consider MW giant stars within 2 kpc (grey points) and G-E stars (light green circles) selected according to Hasselquist et al. (2021). |
| In the text | |
|
Fig. B.1. Behaviour of [Si/Fe], [Ca/Fe], [Ti/Fe], [V/Fe], [Mn/Fe], and [Ni/Fe] as a function of [Fe/H] for the three SMC target clusters (squares, same colours in Fig. 1.), SMC field stars of Paper I (cyan circles), and SMC field stars measured by APOGEE (orange circles). |
| In the text | |
Current usage metrics show cumulative count of Article Views (full-text article views including HTML views, PDF and ePub downloads, according to the available data) and Abstracts Views on Vision4Press platform.
Data correspond to usage on the plateform after 2015. The current usage metrics is available 48-96 hours after online publication and is updated daily on week days.
Initial download of the metrics may take a while.