Fig. 3.
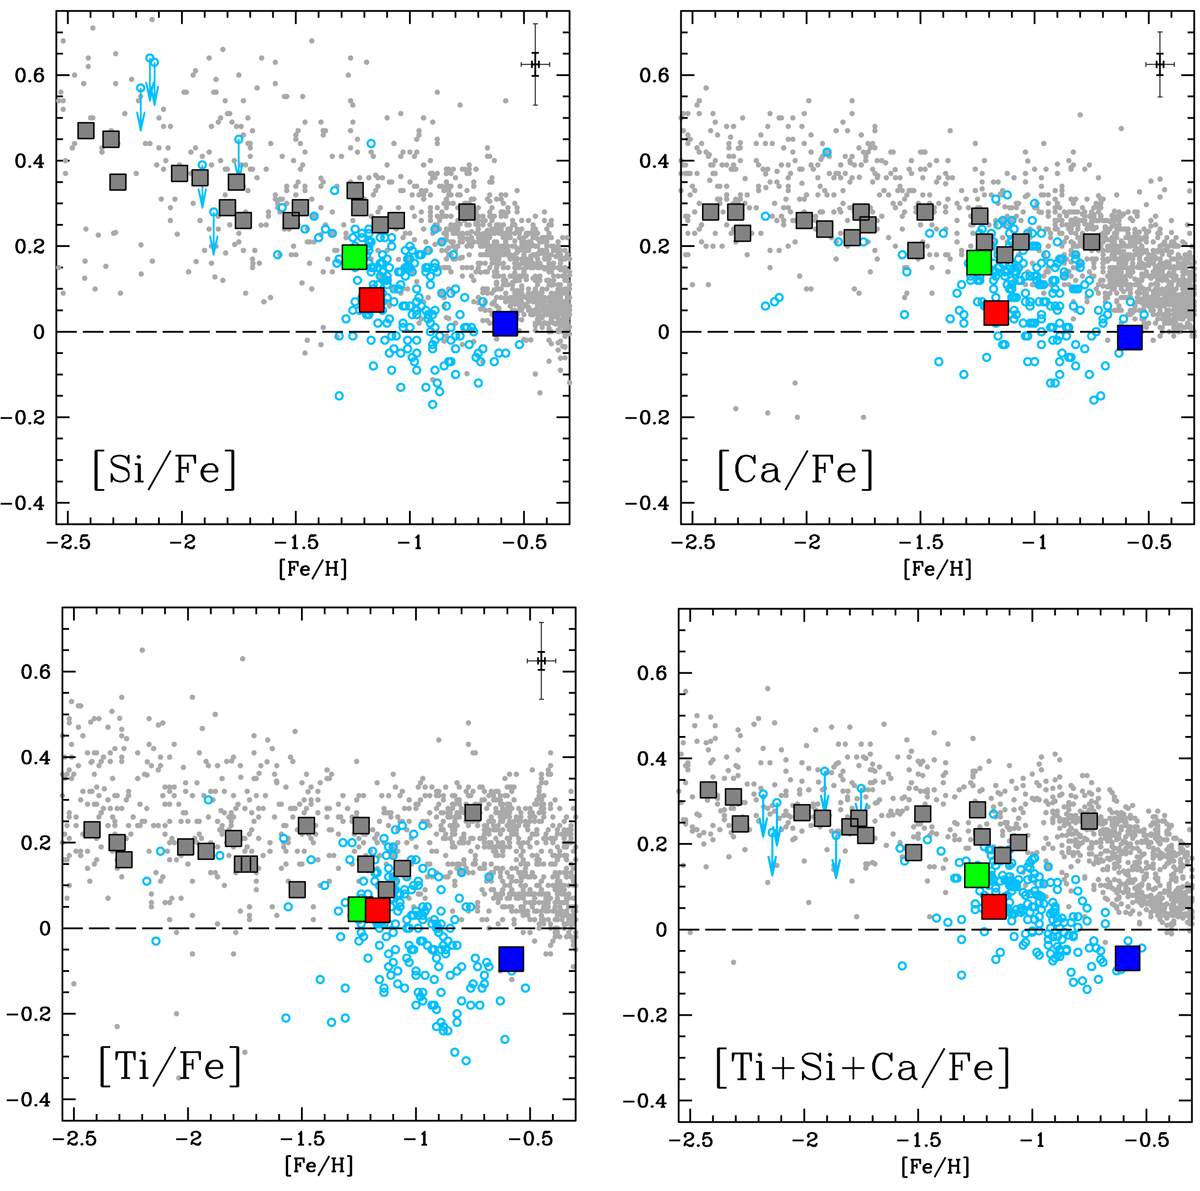
Download original image
α-elements abundance ratios (Si, Ca, and Ti, and their mean value, from the top-left panel to the bottom-right panel) as a function of [Fe/H] for SMC GCs (coloured squares: NGC 121 in red, NGC 339 in green, and NGC 419 in blue), SMC field stars (light blue open dots, Mucciarelli et al. 2021b), MW GCs from the control sample (grey squares), and MW field stars (grey dots). Arrows indicate upper limits. MW field stars are from Edvardsson et al. (1993), Fulbright (2000), Stephens & Boesgaard (2002), Gratton et al. (2003), Reddy et al. (2003, 2006), Barklem et al. (2005), Bensby et al. (2005), Adibekyan et al. (2012), Roederer & Lawler (2012), Mishenina et al. (2013) and Reggiani et al. (2017). The abundance errors for the SMC GCs are reported as error bars; the thin bar is the typical total uncertainty for individual stars, and the thick bar is the error of the mean value of the GC.
Current usage metrics show cumulative count of Article Views (full-text article views including HTML views, PDF and ePub downloads, according to the available data) and Abstracts Views on Vision4Press platform.
Data correspond to usage on the plateform after 2015. The current usage metrics is available 48-96 hours after online publication and is updated daily on week days.
Initial download of the metrics may take a while.