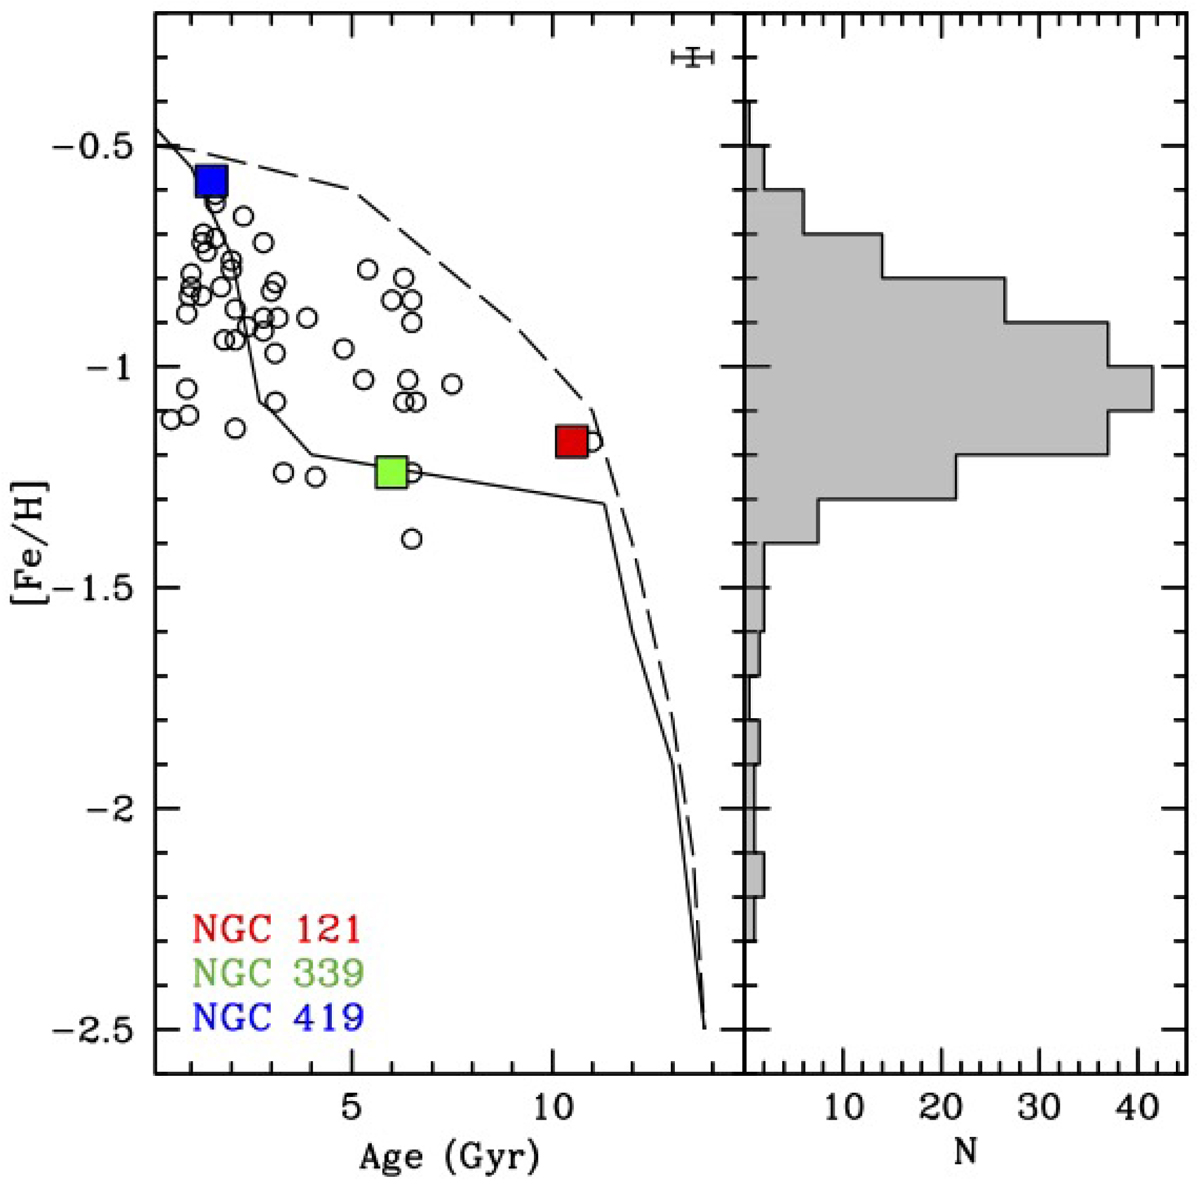
Fig. 2.
Download original image
AMR of the SMC clusters. Left panel: Average metallicity as a function of age (Glatt et al. 2009) for the three SMC GCs analysed in this work (same colour code as Fig. 1). SMC GCs from previous low-resolution works (Parisi et al. 2009, 2015, 2022; Dias et al. 2021) are plotted as open circles. Theoretical AMRs calculated by Pagel & Tautvaisiene (1998) are also reported (the solid curve is the bursting model and the dashed line the continuous model). Right panel: Metallicity distribution of the SMC field stars (Paper I).
Current usage metrics show cumulative count of Article Views (full-text article views including HTML views, PDF and ePub downloads, according to the available data) and Abstracts Views on Vision4Press platform.
Data correspond to usage on the plateform after 2015. The current usage metrics is available 48-96 hours after online publication and is updated daily on week days.
Initial download of the metrics may take a while.