| Issue |
A&A
Volume 677, September 2023
|
|
|---|---|---|
| Article Number | A31 | |
| Number of page(s) | 14 | |
| Section | Planets and planetary systems | |
| DOI | https://doi.org/10.1051/0004-6361/202347040 | |
| Published online | 30 August 2023 | |
TESS discovery of a super-Earth orbiting the M-dwarf star TOI-1680
1
Astrobiology Research Unit, Université de Liège,
Allée du 6 Août 19C,
4000
Liège,
Belgium
e-mail: This email address is being protected from spambots. You need JavaScript enabled to view it.
2
Oukaimeden Observatory, High Energy Physics and Astrophysics Laboratory, Cadi Ayyad University,
Marrakech,
Morocco
3
Departamento de Fisica e Astronomia, Faculdade de Ciencias, Universidade do Porto,
Rua do Campo Alegre,
4169-007
Porto,
Portugal
4
Instituto de Astrofísica e Ciencias do Espaco, Universidade do Porto, CAUP,
Rua das Estrelas,
150-762
Porto,
Portugal
5
Center for Space and Habitability, University of Bern,
Gesellschaftsstrasse 6,
3012,
Bern,
Switzerland
6
Department of Earth, Atmospheric and Planetary Science, Massachusetts Institute of Technology,
77 Massachusetts Avenue,
Cambridge, MA
02139,
USA
7
Kavli Institute for Astrophysics and Space Research, Massachusetts Institute of Technology,
Cambridge, MA
02139,
USA
8
School of Physics & Astronomy, University of Birmingham, Edgbaston,
Birmimgham
B15 2TT,
UK
9
Department of Astronomy, University of California Berkeley,
Berkeley, CA
94720,
USA
10
Department of Physics and Astronomy, Vanderbilt University,
Nashville, TN
37235,
USA
11
NASA Exoplanet Science Institute-Caltech/IPAC,
1200 E. California Blvd,
Pasadena, CA
91125
USA
12
Center for Astrophysics | Harvard & Smithsonian,
60 Garden Street,
Cambridge, MA
02138,
USA
13
Universidad Nacional Autónoma de México, Instituto de Astronomía,
AP 70-264,
Ciudad de México,
04510,
Mexico
14
Space Sciences, Technologies and Astrophysics Research (STAR) Institute, Université de Liège,
Allée du 6 Août 19C,
4000
Liège,
Belgium
15
Instituto de Astrofísica de Canarias (IAC),
Calle Vía Láctea s/n,
38200
La Laguna, Tenerife,
Spain
16
AIM, CEA, CNRS, Université Paris-Saclay, Université de Paris,
F91191
Gif-sur-Yvette,
France
17
Universidad Nacional Autónoma de México, Instituto de Astronomía,
AP 106,
Ensenada 22800,
BC,
Mexico
18
Cavendish Laboratory,
JJ Thomson Avenue,
Cambridge,
CB3 0HE,
UK
19
Instituto de Astrofísica de Andalucía (IAA-CSIC),
Glorieta de la Astronomía s/n,
18008
Granada,
Spain
20
Department of Astronomy and Astrophysics, University of California, Santa Cruz,
1156 High St.
Santa Cruz, CA
95064,
USA
21
Center for Astrophysics and Space Science, University of California San Diego,
La Jolla, CA
92093,
USA
22
Center for Interdisciplinary Exploration and Research in Astrophysics (CIERA), Northwestern University,
1800 Sherman,
Evanston, IL
60201,
USA
23
NASA Ames Research Center,
Moffett Field, CA
94035,
USA
24
Department of Physics, Massachusetts Institute of Technology,
Cambridge, MA
02139,
USA
25
Department of Aeronautics and Astronautics, MIT,
77 Massachusetts Avenue,
Cambridge, MA
02139,
USA
26
Department of Physics and Kavli Institute for Astrophysics and Space Research, Massachusetts Institute of Technology,
Cambridge, MA
02139,
USA
27
SETI Institute,
Mountain View, CA
94043,
USA
28
Department of Astrophysical Sciences, Princeton University,
Princeton, NJ
08544,
USA
29
George Mason University,
4400 University Drive,
Fairfax, VA
22030,
USA
30
Komaba Institute for Science, The University of Tokyo,
3-8-1 Komaba,
Meguro, Tokyo
153-8902,
Japan
31
Instituto de Astrofísica de Canarias (IAC),
38205
La Laguna, Tenerife,
Spain
32
Department of Astronomy and Tsinghua Centre for Astrophysics, Tsinghua University,
Beijing
100084,
PR China
33
Astrobiology Center,
2-21-1 Osawa,
Mitaka, Tokyo
181-8588,
Japan
Received:
29
May
2023
Accepted:
3
July
2023
Abstract
We report the discovery by the TESS mission of a super-Earth on a 4.8-days orbit around an inactive M4.5 dwarf (TOI-1680), validated by ground-based facilities. The host star is located 37.14 pc away, with a radius of 0.2100 ± 0.0064 R⊙, mass of 0.1800 ± 0.0044 M⊙, and an effective temperature of 3211 ±100 K. We validated and characterized the planet using TESS data, ground-based multi-wavelength photometry from TRAPPIST, SPECULOOS, and LCO, as well as high-resolution AO observations from Keck/NIRC2 and Shane. Our analyses have determined the following parameters for the planet: a radius of 1.466−0.049+0.063 R⊕ and an equilibrium temperature of 404 ± 14 K, assuming no albedo and perfect heat redistribution. Assuming a mass based on mass-radius relations, this planet is a promising target for atmospheric characterization with the James Webb Space Telescope (JWST).
Key words: techniques: photometric / planets and satellites: detection
51 Pegasi b Fellow.
Paris Region Fellow, Marie Sklodowska-Curie Action.
© The Authors 2023
 Open Access article, published by EDP Sciences, under the terms of the Creative Commons Attribution License (https://creativecommons.org/licenses/by/4.0), which permits unrestricted use, distribution, and reproduction in any medium, provided the original work is properly cited.
This article is published in open access under the Subscribe to Open model. This email address is being protected from spambots. You need JavaScript enabled to view it. to support open access publication.
1 Introduction
The science of exoplanets has dramatically flourished in the last decade, especially thanks to dedicated space missions. Following the completion of NASA’s Kepler mission survey, where it was revealed that small transiting planets with sizes between those of Earth and Neptune (i.e., 1 < Rp < 4 R⊕) are common in close-in orbits around other stars (Howard et al. 2012; Fressin et al. 2013), the Transiting Exoplanet Survey Satellite (TESS: Ricker et al. 2015) mission took over to search for such planets orbiting bright and nearby stars (Jenkins et al. 2019). This mission concept was chosen for easy subsequent spectroscopic investigation of the planets’ masses and atmospheres, notably with the James Webb Space Telescope (JWST; Deming & Sheppard 2017). TESS observed 85% of the sky in its nominal mission and is now in its extended mission (Wong & Shporer 2022). Up to now, TESS has detected more than 6000 planet candidates (TESS Objects of Interest, TOIs), including more than 1300 that could be smaller than 4 R⊕.
The exploration of planets larger than Earth and smaller than Neptune is an area of great interest. Since such planets are not present in our Solar System, our understanding of their origins and formation mechanisms is limited. Interestingly, demographic studies performed by Fulton et al. (2017) on the basis of California – Kepler Survey exoplanets sample – a subset of transiting planets from Kepler with high-resolution spectroscopic follow-up of their host stars (CKS: Petigura et al. 2017; Johnson et al. 2017) – uncovered a gap, usually known as the “radius valley,” in the radius distribution of small planets in close orbits (<100 days) around FGK stars. This radius valley separates super-Earths and sub-Neptunes. This finding presents a key phenomenon for understanding planet formation mechanisms.
Two main theories have been proposed to explain the radius valley: thermally driven mass-loss (Lopez & Fortney 2013; Owen & Wu 2013; Jin et al. 2014; Chen & Rogers 2016) and gas-poor formation (Luque et al. 2021; Lee et al. 2014; Lee & Chiang 2016; Lee & Connors 2021). Each of the two predict different origins for the radius valley. Moreover, a recent study conducted by Luque & Pallé (2022) on a sample of 34 well-characterized exoplanets around M dwarfs has instead indicated the presence of a density gap separating rocky and water-rich exoplanets. However, the small size of exoplanet samples used in these studies precludes definitive constraints. Thus, having a significantly large sample of exoplanets with accurate density estimates is strongly needed.
In this paper, we present the discovery and characterization of a super-Earth planet ( R⊕) which was first discovered by TESS to orbit an M-dwarf star located near the continuous viewing zone (CVZ) of JWST. We validate its planetary nature using ground-based observations, including time-series photometry, high-angular-resolution imaging and spectroscopy. Although we do not present a mass measurement in this paper, this could be done with high-precision radial velocity observation, as discussed in Sect. 4. This measurement would allow for detailed studies on planet formation in the future. The paper is structured as follows. Section 2 presents the data from TESS and all ground-based observations. Stellar characterization, validation of the transit signals, and transit analyses are presented in Sect. 3. We discuss our findings in Sect. 4 and give our conclusions in Sect. 5.
Ground-based time-series photometric observations of TOI-1680, and the detrending parameters that maximize the log-likelihood of each light curve.
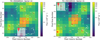 |
Fig. 1 Target pixel files (TPFs) of TOI-1680 in TESS Sector 14 and 15, created with tpfplotter (Aller et al. 2020). The orange shaded region represents the aperture used to extract the SPOC photometry. The red circles are the Gaia DR2 sources. Sizes represent magnitude contrasts with respect to TOI-1680. Figure continued in Appendix A. |
2 Observations
In this section, we present all the observations of TOI-1680 obtained with TESS and ground-based facilities. Table 1 summarizes all the ground-based, time-series photometric observations.
2.1 TESS photometry
Over its two-year primary mission, TESS (Ricker et al. 2015) performed an all-sky survey in a series of contiguous overlapping 96 × 24 deg sectors, each observed for 27 days. Depending on the ecliptic latitude, the overlapping regions of the sectors were observed for up to ~351 days. Given its high ecliptic latitude (β = +81.05 deg), TOI-1680 (TIC 259168516) is well placed in the TESS CVZ. It was then observed by TESS in all the northern sectors (from 14 to 26) in the second year of TESS primary mission, from 18 July 2019 to 4 July 2020. It was also observed in the TESS extended mission in sectors 40–41 from 25 June to 20 August 2021. Most recently, it was observed in sectors 47–59 from 31 December 2021 to 23 December 2022. The target pixel files (TPFs) and simple aperture photometry (SAP) apertures used in each sector are shown in Fig. 1, along with the superplotted locations of nearby Gaia DR2 (Gaia Collaboration 2018) sources. The astrometric and photometric properties of TOI-1680 from the literature are reported in Table 2. The time series observations were processed in the TESS Science Processing Operations Center (SPOC) pipeline, originally developed for the Kepler mission at NASA Ames Research Center (Jenkins et al. 2016, 2020). The SPOC pipeline conducted a transit search of the combined light curve from sectors 14–16 on 26 October 2019 with an adaptive, noise-compensating matched filter (Jenkins 2002; Jenkins et al. 2010, 2020), producing a threshold crossing event (TCE) with 4.8-day period for which an initial limb-darkened transit model was fitted (Li et al. 2019) and a suite of diagnostic tests were conducted to help make or break the planetary nature of the signal (Twicken et al. 2018). The 5.1 ppt transit signature passed all diagnostic tests presented in the SPOC data validation reports, and the source of the transit signal was localized within 4.03 ± 4.58″. The TESS Science Office (TSO) reviewed the vetting information and issued an alert for TOI-1680 b on 30 January 2020 (Guerrero et al. 2021).
For subsequent analysis, we retrieved the 2-min presearch data conditioning light curves (PDC-SAP, Stumpe et al. 2012, 2014; Smith et al. 2012) from the Mikulski Archive for Space Telescopes (MAST). We were limited to sectors 13–26 of the primary mission and sectors 47–50 of the extended mission. We removed all the bad data points flagged as “bad quality.” We then detrended the light curves to remove stellar variability using a biweight time-windowed slider via wotan (Hippke et al. 2019). We excluded the transit signal by applying a filter window that is three times longer than the transit duration of  min.
min.
TOI-1680 stellar astrometric and photometric properties.
2.2 Ground-based photometry
The pixel scale of TESS spacecraft is 21″ per pixel (Ricker et al. 2015). A targeted star might not be alone in a single pixel. Other stars in the same pixel might be suspected to be the source of the TESS detection. Even if the transit signal is on target, the depth might appear shallower because of the contaminating nearby stars. To confirm the signal on target and validate its planetary nature, a series of precise ground-based observations were collected using five observatories as part of the TESS Follow-up Observing Program (TFOP1). We made use of TESS Transit Finder (TTF) tool, which is a customized version of the Tapir software package (Jensen 2013), to schedule our observations described hereafter.
2.2.1 LCOGT 1m
The first two full transits of TOI-1680 b were observed from Las Cumbres Observatory Global Telescope (LCOGT; Brown et al. 2013) 1.0-m network node at McDonald Observatory. The 1-meter telescopes are equipped with 4096×4096 pixels SINISTRO cameras having a pixel scale of 0.389″ per pixel, offering a field of view of 26′×26′. The first transit was observed on 13 June 2020 in the Ic band for 210 min, over which we gathered 64 images with an exposure time of 150 seconds. The second transit was observed on 07 July 2020 in Sloan i′ band during an observational window of 198 min, where we collected 63 images with an exposure time of 150 s. The data reduction and photometric data extraction were performed using the AstroImageJ (ALT: Collins et al. 2017) software package with an uncontaminated aperture of 8.0 pixels (3.11″) for both observations.
2.2.2 TRAPPIST-North photometry
We observed a partial and a full transit of TOI-1680 b with the 0.6-m TRAPPIST-North telescope located at Oukaimeden Observatory in Morocco (Jehin et al. 2011; Gillon et al. 2013; Barkaoui et al. 2019) on 22 June and 16 July 2021, respectively. TRAPPIST-North is equipped with a thermoelectrically cooled 2K×2K Andor iKon-L BEX2-DD CCD camera with a pixel scale of 0.6″ per pixel, offering a field of view of 20′×20′. Both observations were performed in Sloan z′ band with an exposure time of 80 s. The first observation consisted of 113 images for 182 min and the second consisted of 99 images for 166 min duration. For both datasets, we performed the data reduction and differential aperture photometry using prose2 (Garcia et al. 2022), which selected the optimum apertures for the photometric data extraction to be 6.94 pixels (4.16″) for the first observation and 8.32 pixels (5″) for the second.
2.2.3 SPECULOOS-North Artemis photometry
Two full transits of TOI-1680 b were observed by the telescope Artemis of the SPECULOOS Northern Observatory (SNO, Burdanov et al. 2022), located at the Teide Observatory (Canary Islands, Spain). Artemis is operated in a fully automated manner and equipped with Andor iKon-L camera with a 2K×2K deep-depletion CCD, which has a pixel scale of 0.35″ per pixel. The first transit was observed on 09 August 2021 in the Sloan r′ filter with an exposure time of 100 s. We gathered 156 images over 319 min. The second transit was observed on 02 September 2021 in an I + z filter (Johnson/Cousins I + Sloan z′) with an exposure time of 20 s. We gathered 641 images during an observational window of 325 min. Both datasets were calibrated, and the differential aperture photometry were performed using the PRINCE pipeline (Demory et al. 2020). The aperture radii used were 5.0 pixels (1.75″) for the first observation and 8.5 pixels (2.97″) for the second.
2.2.4 SAINT-EX photometry
More ground-based photometric time-series observations of TOI-1680b were obtained from the SAINT-EX observatory (Search And characterIsatioN of Transiting EXoplanets). SAINT-EX is a 1-m telescope in the F/8 Ritchey–Chrétien configuration and operated in fully robotic manner. It is equipped with an 2k×2k deep-depletion CCD camera with a pixel scale of 0.34″ per pixel offering a field of view of 12′×12′. The telescope is allied to an ASTELCO equatorial NTM-1000 German mount associated with direct-drive motors that permits observation without a meridian flip. It is in fact a twin of the SPECULOOS-South and SPECULOOS-North telescopes, and it operates as part of the SPECULOOS survey (Delrez et al. 2018; Sebastian et al. 2021).
Two full transits were observed by SAINT-EX. The first on 21 September 2021 in an I + z filter for 314 min, in which we gathered 520 raw images with an exposure time of 19 s. And the second on 08 November 2021 in Sloan r′ filter for 206 min, with an exposure time of 105 seconds where we gathered 104 images. The data reduction and differential aperture photometry were performed automatically using the PRINCE pipeline. For more information on the SAINT-EX telescope and PRINCE pipeline, we refer to Demory et al. (2020). The aperture radii used were 6.5 pixels (2.28″) for the first observation and 11.0 pixels (3.85″) for the second.
2.2.5 LCOGT MUSCAT3 photometry
A full transit of TOI-1680 b was observed simultaneously in Sloan-g′, r′, i′, and Pan-STARRS z-short bands on UTC April 21, 2022 using the LCOGT 2 m Faulkes Telescope North at Haleakala Observatory on Maui, Hawaii. The telescope is equipped with the MuSCAT3 multi-band imager (Narita et al. 2020). The raw images were calibrated using the standard LCOGT BANZAI pipeline (McCully et al. 2018), and photometric measurements were extracted using AstroImageJ (Collins etal. 2017). The light curve in the Sloan-g′ filter was not selected to be included in the analyses because of the low signal-to noise ratio (S/N) that is due to the faintness of the star in this band.
2.3 Spectroscopic observations
With the aim of better constraining the stellar properties, we also performed spectroscopic observation detailed hereafter. The analyses are presented in Sect. 3.1.1.
2.3.1 IRTF/SpeX
We gathered a near-infrared spectrum of TOI-1680 with the SpeX spectrograph (Rayner et al. 2003) on the 3.2-m NASA Infrared Telescope Facility (IRTF) on 19 Oct 2021 (UT). The conditions were clear with a seeing of 1.″0–1.″2. We followed the same observational design as other recent IRTF/SpeX observations of M-dwarf TOIs (Wells et al. 2021; Delrez et al. 2022). We used the short-wavelength cross-dispersed (SXD) mode with the 0.3″ × 15″ slit aligned to the parallactic angle, which gives a set of spectra covering 0.75–2.42 μm with a resolving power of R~2000. Nodding in an ABBA pattern, we collected 18 exposures of 64.9 s each, totaling 19.5 min on source. We collected a set of standard SXD flat-field and arc-lamp exposures immediately after the science frames, followed by a set of six, 2.8-s exposures of the A0 V star HD 172728 (V = 5.7). We reduced the data using Spextool v4.1 (Cushing et al. 2004), following the instructions for standard usage in the Spextool User’s Manual3. The final spectrum has a median S/N per pixel of 68 with peaks in the J, H, and K bands of 98, 101, and 91, respectively, along with an average of 2.5 pixels per resolution element.
2.3.2 Shane/Kast
We obtained a low-resolution optical spectrum of TOI-1680 on 27 Nov 2021 (UT) using the Kast double spectrograph (Miller & Stone 1994) on the 3-m Shane Telescope at Lick Observatory. Conditions were partly cloudy with a seeing of 1″. We obtained two sequential exposures of 1200 s (40 min total) through the red channel of Kast using the 600/7500 grism and 2″-wide slit, providing spectra covering 5900–9200 Å at an average resolving power of R ≈ 1900. We observed the spectrophotometry calibrator Feige 110 (Hamuy et al. 1992, 1994) earlier that night for flux calibration, and the G2 V star HD 205113 (V = 6.87) immediately after TOI-1680 for telluric absorption calibration. Flat-field and arc line lamps were obtained at the start of the night for flux and wavelength calibration. Data were reduced and analyzed using the kastredux package4, with standard settings for image reduction and calibration, boxcar extraction of the spectrum, wavelength calibration, flux calibration, and telluric absorption calibration. The final spectrum has a S /N = 150 at 7500 Å and wavelength accuracy of 0.51 Å (22 km s−1).
2.4 High-resolution imaging
As part of our standard process for validating transiting exoplanets to assess the possible contamination of bound or unbound companions on the derived planetary radii (Ciardi et al. 2015), we observed the TOI-1680 with near-infrared adaptive optics (AO) imaging at Keck and Shane Observatories. Gaia DR3 is also used to provide additional constraints on the presence of undetected stellar companions as well as wide companions.
2.4.1 Keck-II near-infrared adaptive optics imaging
The Keck Observatory observations were made with the NIRC2 instrument on Keck-II behind the natural guide star AO system (Wizinowich et al. 2000) on 28 Aug 2021 UT in the standard three-point dither pattern that is used with NIRC2 to avoid the left lower quadrant of the detector, which is typically noisier than the other three quadrants. The dither pattern step size was 3 and was repeated twice, with each dither offset from the previous dither by 0.5″. NIRC2 was used in the narrow-angle mode with a full field of view of ~10″ and a pixel scale of approximately 0.0099442 per pixel. The Keck observations were made in the K filter (λo = 2.196; ∆λ = 0.336 μm) with an integration time of 1 second for a total of 9 s on target.
The AO data were processed and analyzed with a custom set of IDL tools. The science frames were flat-fielded and sky-subtracted. The flat fields were generated from a median average of dark-subtracted flats taken on-sky. The flats were normalized such that the median value of the flats is unity. The sky frames were generated from the median average of the dithered science frames; each science image was then sky-subtracted and flat-fielded. The reduced science frames were combined into a single combined image using an intra-pixel interpolation that conserves flux, shifts the individual dithered frames by the appropriate fractional pixels, and median-coadds the frames. The final resolutions of the combined dithers were determined from the full-width half-maximum of the point spread functions (0.056 for the Keck observations).
The sensitivities of the final combined AO image were determined by injecting simulated sources azimuthally around the primary target every 20° at separations of integer multiples of the central source’s FWHM (Furlan et al. 2017). The brightness of each injected source was scaled until standard aperture photometry detected it with 5σ significance. The resulting brightness of the injected sources relative to TOI-1680 set the contrast limits at that injection location. The final 5σ limit at each separation was determined from the average of all of the determined limits at that separation and the uncertainty on the limit was set by the rms dispersion of the azimuthal slices at a given radial distance. The Keck data have a sensitivity close-in of δmag = 2.9 mag at 0.06″, and deeper sensitivity at wider separations (δmag = 6.5 mag at ≳0.4″). The final sensitivity curve for the Keck is shown in Fig. 2. No close-in (≲1″) stellar companions were detected by Keck.
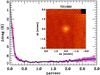 |
Fig. 2 Keck NIR AO imaging and sensitivity curve for TOI-1680 taken in the K filter. The image reaches a contrast of ~7 magnitudes fainter than the host star beyond 0.″5. Inset: image of the central portion of the data. |
2.4.2 Shane near-infrared adaptive optics imaging
We observed TIC 259168516 on UT 2021 June 2 using the ShARCS camera on the Shane 3-meter telescope at Lick Observatory (Kupke et al. 2012; Gavel et al. 2014; McGurk et al. 2014). The observation was taken with the Shane adaptive optics system in natural guide star mode. The final images were constructed using sequences of images taken in a four-point dither pattern with a separation of 4″ between each dither position. Two image sequences were taken of this star: one with a Ks filter (λ0 = 2.150 μm, ∆λ = 0.320 μm) and one with a J filter (λ0 = 1.238 μm, ∆λ = 0.271 μm). A more detailed description of the observing strategy and reduction procedure can be found in Savel et al. (2020). The contrast curves extracted from these observations are shown in Fig 3. With the Ks filter, we achieve contrasts of 2.5 at 1″ and 4.4 at 2″. With the J filter, we achieve contrasts of 2.8 at 1″ and 4.0 at 2″. We detect one companion about 5.″8 west of TIC 259168516 that is 5.0 magnitudes fainter in Ks and 5.7 magnitudes fainter in J. Based on this, the star is likely the known neighbor TIC 1884271108. Gaia EDR3 parallax and proper motion indicate that it is another line-of-sight star.
2.5 Gaia assessment
In addition to the high resolution imaging, we have used Gaia to identify any wide stellar companions that may be bound members of the system. Typically, these stars are already in the TESS Input Catalog and their flux dilution to the transit has already been accounted for in the transit fits and associated derived parameters from the TESS PDC-SAP photometry. There are no additional widely separated companions identified by Gaia that have the same distance and proper motion as TOI-1680 (see also Mugrauer & Michel 2020, 2021).
Additionally, the Gaia DR3 astrometry provides additional information on the possibility of inner companions that may have gone undetected by either Gaia or the high resolution imaging. The Gaia renormalised unit weight Error (RUWE) is a metric, similar to a reduced chi-square, where values that are ≲1.4 indicate that the Gaia astrometric solution is consistent with the star being single whereas RUWE values ≳1.4 may indicate an astrometric excess noise, possibly caused by the presence of an unseen massive (stellar) companion (e.g., Ziegler et al. 2020). TOI-1680 has a Gaia DR3 RUWE value of 1.05 indicating that the astrometric fits are consistent with the single star model.
3 Analyses
3.1 Stellar characterization
3.1.1 Spectroscopic analysis
The Shane/Kast optical and IRTF/SpeX near-infrared spectra allow us to assess TOI-1680’s fundamental stellar properties. Using tools in the kastredux package, we compared the optical spectrum to the SDSS M dwarf templates of Bochanski et al. (2007), and found a best overall match to the M5 template (Fig. 4). Spectral indices from Reid et al. (1995), Martín et al. (1999), Lépine et al. (2003), and Riddick et al. (2007) are more consistent with an M4 classification, suggesting an intermediate type of M4.5 ± 0.5. The ζ metallicity index of Lépine et al. (2007); Mann et al. (2013), based on relative strengths of TiO and CaH features, is measured to be 1.025 ± 0.002, consistent with a metallicity of [Fe/H] = +0.04 ± 0.20 based on the calibration of Mann et al. (2013). We see no evidence of Hα emission in the Balmer line at 6563 Å (equivalent width limit of <0.3 Å), suggesting an age ≳4–7 Gyr (West et al. 2008).
The SpeX SXD spectrum of TOI-1680 is shown in Fig. 4. We used the SpeX Prism Library Analysis Toolkit (SPLAT, Burgasser & Splat Development Team 2017) to compare the spectrum to that of single-star spectral standards in the IRTF Spectral Library (Cushing et al. 2005; Rayner et al. 2009), finding the best single match to the M3.5 standard Gl 273. We note that the shape of the spectrum of TOI-1680 suggests it is cooler than the M3.5 standard, though the M4.0 standards in the library give poorer fits. We adopt an infrared spectral type of M3.5 ± 0.5, earlier but consistent with the optical classification. After adjusting for a barycentric velocity of −1.64 km s−1, we cross-correlated the SpeX spectrum of TOI-1680 with the rest-frame velocity of the M3.5 standard to determine the radial velocity. Determining the uncertainty of the cross-correlation with a Monte Carlo approach, we estimate a radial velocity of −34.3 ± 3.3 km s−1. After applying a radial-velocity correction, we confirmed that the best-fit spectral standard did not change.
The SpeX spectrum also provides an estimate of stellar metallicity. Using SPLAT, we measured the equivalent widths of the K-band Na I and Ca I doublets and the H2O–K2 index (Rojas-Ayala et al. 2012). We then used the Mann et al. (2013) relation between these observables and [Fe/H] to estimate the stellar metallicity, propagating uncertainties using a Monte Carlo approach (see Delrez et al. 2022). We determined a metallicity of [Fe/H] = −0.32 ± 0.13, which is lower than but formally consistent with the optical measurement and more in line with the apparent old magnetic activity age of the star.
3.1.2 Empirical relations
We used available empirical relationships appropriate for M dwarfs to determine the stellar parameters of TOI-1680. We first used Gaia EDR3 parallax and 2MASS mK visual magnitude to calculate the MK absolute magnitude and found MK = 7.9720 ± 0.0203. We then used the empirical relationship between the mass and MK absolute magnitude of Mann et al. (2019) to estimate the mass of TOI-1680, which we found to be M★ = 0.1800 ± 0.0043 M⊙. This is in good agreement with the mass value of M★ = 0.1765 ± 0.02 M⊙, estimated using the mass–luminosity relation in the K-band from Benedict et al. (2016), where the uncertainty is dominated by the scatter in the mass-Ks relation.
Using the empirical polynomial relation between the stellar radius R* and MK derived by Mann et al. (2015), we estimated R* to be 0.2130 ± 0.0064 R⊙, with a typical uncertainty of 3% as reported in Table 1 of Mann et al. (2015). As an independent check, we used the mass–radius relationship of Boyajian et al. (2012) to determine the radius from the masses we previously estimated. We found R* = 0.2075 ± 0.0039 R⊙, which is consistent with the aforementioned radius determination. This leads to a stellar density of 27.4 ± 2.6 g cm−3.
As for the effective temperature determination, we first estimated the bolometric correction in the K-band to be BCK = 2.7414 ± 0.0822 mag, by making use of the empirical polynomial relation between BCK and V − J of Mann et al. (2015). Then, we determined a bolometric magnitude of Mbol = 10.72 ± 0.085 mag, which gives a bolometric luminosity of L* = 0.004353 ± 0.000340 L⊙. The Stefan-Boltzmann Law, along with the aforementioned stellar radius and bolometric luminosity, gives an effective temperature Teff = 3210 ± 62 K. Independently, we also determined the effective temperature based on the empirical relation of Mann et al. (2015) using the color indexes V − J and J − H, and found Teff = 3224 ± 100 K. The two values are consistent within 1σ.
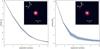 |
Fig. 3 High-resolution imaging and contrast curves of TOI-1680 obtained with the ShARCS camera on the Shane 3-m telescope, with the J (left) and Ks filter (right). No secondary sources were detected. |
3.1.3 SED fitting
As an independent check, we used the EXOFASTv2 analyses package (Eastman et al. 2019) to perform an analysis of the broadband spectral energy distribution (SED) of TOI-1680 using MIST stellar models (Dotter 2016; Choi et al. 2016) to determine the stellar parameters. We pulled the JHKs magnitudes from the 2MASS catalog (Cutri et al. 2003), WISE1-WISE4 magnitudes from the AllWISE catalog (Cutri et al. 2003) and the GGBPGRP magnitudes from Gaia EDR3 (see Table 2). We performed the fit shown in Fig. 5 with Teff, R* and M* as free parameters with a Gaussian prior on the Gaia EDR3 parallax which we corrected for systematics by subtracting -0.041867248 mas from the nominal value according to the Lindegren (2020) prescription. We set an upper limit on the extinction of AV = 0.29233 from the dust maps of Schlafly & Finkbeiner (2011) and a Gaussian prior on the stellar metallicity from IRTF/SpeX (see Table 3). The SED fit results, reported in Table 3, are in excellent agreement with our previous determinations.
3.2 Statistical validation
To statistically validate TOI-1680b, we used TRICERATOPS5 (Giacalone et al. 2021), which validates planets by simulating astrophysical false positives arising from gravitationally bound stellar companions, chance-aligned foreground or background stars, and known nearby stars that are blended with the target in the TESS data. It uses a Bayesian tool that incorporates prior knowledge of the target star, planet occurrence rates, and stellar multiplicity to calculate the false positive probability (FPP) and nearby false positive probability (NFPP). The FPP quantity represents the probability that the observed transit is due to something other than a transiting planet around the target star and the NFPP quantity represents the probability that the observed transit originates from a resolved nearby star rather than the target star. Giacalone et al. (2021) state that for a planet to be statistically validated it must have FPP < 0.015 and NFPP < 0.001.
We first applied TRICERATOPS to the TESS 2-min-cadence light curve supplied with the contrast curve obtained by the NIRC2 speckle imaging in Sect. 2.4.1. The resulting FPP and NFPP values are 0.0018 ± 0.0001 and 0.0017 ± 0.0001 respectively. The FPP is good enough but NFPP is above the threshold to classify a validated planet (Giacalone et al. 2021). Only three nearby stars were bright enough and close enough to the target star to cause nearby false positives: TIC 1884271108 (∆T = 6.4, sep = 6″), TIC 259168518 (∆T = 1.3, sep = 30″), and TIC 259168513 (∆T = 2.6, sep = 37″). However, because the event observed by TESS was confirmed to be on-target by our ground-based observations, we were able to rule out these stars as sources of false positives and set NFPP = 0 from the outset. The FPP is then reduced to 0.0001 ± 0.0001, which is low enough for validating the planet. Independently, we also used the light curves obtained by the Artemis 1-m and LCO-Hal 2-m telescopes as they present tighter photometric constraints than the TESS data. This was supplied with the same contrast curve mentioned above and without removing any nearby star. This yields FPP and NFPP values generally lower than 0.01 and 0.001 respectively. Therefore, we consider this TESS candidate to be a validated planet.
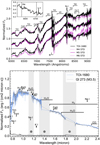 |
Fig. 4 Kast optical spectrum of TOI-1680 (black lines) compared to M4, M5, and M6 SDSS optical templates (magenta lines from top to bottom) from Bochanski et al. (2007) shown at the top. Each spectral comparison is normalized at 7500 A and offset by a constant of 0.5. Key atomic and molecular absorption features are labeled, including residual O2 telluric absorption at 7600 Å (⊕ symbol). The inset box shows a close-up of the region around the 6563 Å Hα and 6708 Å Li I lines, neither of which are detected. Bottom panel displays SpeX SXD spectrum of TOI-1680 (blue) compared to SpeX SXD spectrum of the M3.5 standard Gl 273 (grey; Rayner et al. 2009). Prominent spectral features of M dwarfs are highlighted, and regions of strong telluric absorption are shaded. The grey lines at the bottom of the plot show the measurement uncertainties for TOI-1680 and Gl 273 (higher and lower, respectively). |
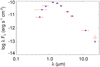 |
Fig. 5 Spectral energy distribution (SED) of TOI-1680. The red crosses show the broadband observations and the error bars show the width of the filters. The blue circles represent the model fluxes. |
Stellar parameters.
3.3 Stellar activity
With an ecliptic latitude of β = +81.05 deg, TOI-1680 is located near the northern ecliptic pole in the TESS CVZ. Targets in the CVZ are highly valuable for extracting long-period rotation rates. We first visually inspected the TESS PDC-SAP light curves and found no hints of rotational modulation nor evidence of flares. We then used the Systematics-Insensitive Periodogram (TESS-SIP6) to build a periodogram for photometric data from all the 19 sectors. This tool creates a Lomb-Scargle periodogram, while simultaneously detrending TESS systematics using a similar method to that described in Angus et al. (2016) for detrending systematics in the NASA Kepler/K2 dataset. Since the rotational period of the star might be removed by the PDC pipeline, TESS-SIP uses the TESS target pixel file (TPF) data, and apertures assigned by the TESS Pipeline to reproduce a simple aperture photometry (SAP) light curves of the target. We applied this operation on all the 19 observing sectors. Searching for periods between 10 and 365 days, we applied TESS-SIP on the target and on all the background pixels outside of the TESS pipeline aperture in the TESS TPFs for TOI-1680. The SIP powers, presented in Fig. 6, show a marked similarity between the periodograms of the target and of the background. For comparison, the lower panel shows the ratio of the target to the background powers. We do not see any significant peaks where the target would display power that would be substantially greater than that of the background.
We also used TESS-SIP on each sector alone. We did not find any clear stellar rotation signal nor consistency between the periodograms of any sectors. In short, there is no hint of rotational variability detected for TOI-1680 in the TESS dataset, which is consistent with the lack of detectable Hα emission in its optical spectrum.
Although the TESS CVZ light curves would encompass typical rotation periods for mid-M-dwarfs (0.1 to 140 days; e.g., Newton et al. 2016), we searched for completeness other ground-based photometric archives. Our target TOI-1680 is not part of the MEarth sample (Berta et al. 2012). We analyzed the ASAS-SN light curves (Shappee et al. 2014; Kochanek et al. 2017) for our object that had observations in V and g, spanning from June 2012 to June 2023. We do not find rotational modulation. We note that given the faintness of our target in bluer bands (e.g., GaiaBP = 16.27 mag), only ~65% of the ASAS-SN observations were above the observational limit of each individual observation (with a median limiting magnitude of 16.832 mag in the full light curve). Furthermore, flares cannot be robustly detected in the ASAS-SN data because of its cadence (about two to three days; Jayasinghe et al. 2018).
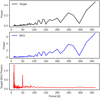 |
Fig. 6 Systematics-insensitive periodogram (SIP) for TOI-1680 b. The periodogram is calculated for both the corrected light curve (black line in the top panel) and the background (BKG) pixels (blue line in the middle panel). The star and the BKG show the same powers. The bottom panel shows the target to the BKG ratio. We do not see any clear peak for the target. |
Quadratic limb-darkening coefficients used in the photometric joint analysis for each passband.
3.4 Transit modeling
We jointly analyzed the light curves from TESS and ground-based instrumentation described in Sect. 2 using the EXOFASTv2 (Eastman et al. 2019) software package. We included the TESS photometric data described in Sect. 2.1 from sectors 14 to 50. We detrended the ground-based light curves for the airmass, as well as for either the background or the half width at half maximum (HWHM) of the PSF. The choice of these parameters was based on the likelihood maximization. Some light curves were detrended only for airmass, especially the partial ones. Table 1 shows the detrending parameters of each light curve. The detrending was done simultaneously with the transit fitting to ensure a good propagation of the uncertainties on the derived parameters. We fixed the eccentricity to zero assuming the orbit to be circular (see justification below). We set the NOMIST flag to disable the MIST stellar track that constrains the star and, instead, we imposed Gaussian priors on the stellar mass (0.1800 ± 0.0044 M⊙), radius (0.2100 ± 0.0064 R⊙) and temperature (3224 ± 100 K) from our determinations reported in Table 3 as well as uniform priors on the period (P = 4.8026 ± 0.1P d) and transit epoch (Tc ± P/3) from the values reported in ExoFOP. We set the NOCLARET flag to disable the Claret tables (Claret 2017; Claret & Bloemen 2011) that are used to fit the quadratic limb-darkening parameters u1 and u2 and we applied our own gaussian priors computed using the PyLDTk code (Parviainen & Aigrain 2015) for each passband (see Table 4). TESS light curves are corrected for contamination, but we still fit for dilution of the transit signal in the TESS band due to the neighboring stars using 0±10% of the contamination ratio reported in the TIC 259168516 on ExoFOP as Gaussian prior as recommended by Eastman et al. (2019) to account for any uncertainty in the correction. We ran the EXOFASTv2 analysis until convergence when the Gelman–Rubin statistic (GR) and the number of independent chain draws (Tz) were less than 1.01 and greater than 1000, respectively.
To test the impact of the detrending on our derived parameters, we performed independent analyses of the light curves with another code. We used the PyTransit package (Parviainen 2015) and linear models of detrending vectors (FWHM, airmass and background), as done in Wells et al. (2021) and Schanche et al. (2022). We found good agreement between the fits and therefore continued with EXOFASTv2 for the full analysis. The detrended and modeled light curves are presented in Fig. 7 and the TESS phase-folded light curve is presented in Fig. 8. The results are reported in Table 5. We also fitted for an eccentric orbit to assess the evidence for orbital eccentricity using photometric-only data. A comparision of the loglikelihood of the two fits appears to favor a circular orbit.
We were concerned that the background level was overestimated and overcorrected in the SPOC pipeline in the northern year 2 sectors (14–26). Fitting only data from sectors 14 to 50 would lead to an overestimation of the planet radius by roughly 2%. However, this bias is comparable to the error bars on the planet radius and, the inclusion of the dilution term and additional ground-based data significantly mitigates the problem.
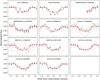 |
Fig. 7 Phase-folded ground-based transit light curves of TOI-1680 b. The unbinned light curves are shown with gray points. The binned points (bin size=10 min) are shown in black with the corresponding error bars. The red line corresponds to the final EXOFASTv2 transit model. |
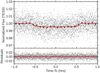 |
Fig. 8 TESS light curve folded in phase with the time in hours from mid-transit of TOI-1680 b. The red solid line represents the best-fit transit model from the final joint-fit. The gray dots are the 2-min TESS data and the black dots are the binned data every phase interval of 5 min. The residuals are plotted in the bottom panel. |
4 Discussion
4.1 TOI-1680 b and the radius valley
Studies performed by Fulton et al. (2017) on the Kepler small exoplanets have identified a radius valley roughly from 1.5 to 2 R⊕, separating rocky super-Earths and gaseous sub-Neptunes around Sun-like stars. A low-radius peak at 1.3 R⊕ corresponds to high-density super-Earths and a high-radius peak at 2.4 R⊕ corresponds to low-density sub-Neptunes with significant primordial H/He atmospheres. This gap is considered as possible transition region between rocky and icy “super-Earth” and “mini-Neptunes.” Cloutier & Menou (2020) showed that the radius valley persists for low-mass stars (i.e., M ≲ 0. 65 R⊙).
Two contrasting theories have been presented to explain the radius valley. The first is gas-poor formation model which proposes that the radius valley is a feature intrinsic to the exo-planet population from formation onward (Luque et al. 2021; Lee et al. 2014; Lee & Chiang 2016; Lee & Connors 2021). Specifically, some planets are formed with extended H/He envelopes, whereas the population of rocky planets is formed later in a gas-poor environment after the gas is dissipated from the protoplanetary disk. The second is thermally driven atmospheric mass loss (Lopez & Fortney 2013; Owen & Wu 2013; Jin et al. 2014; Chen & Rogers 2016), which proposes that the radius gap is formed through evolution after the gas accretion phase. That is, planets are formed with gaseous envelopes and some of them experience atmospheric escape through two scenarios: 1) photo-evaporation (Lopez & Fortney 2013; Owen & Wu 2013; Jin et al. 2014; Chen & Rogers 2016) triggered by energetic EUV and X-ray flux from the host star in the first ~100 Myrs (Owen & Wu 2013) of the system and 2) core-powered mass-loss (Ginzburg et al. 2016) triggered by the energy emergent from the cooling planetary core in a Gyr timescale (Ginzburg et al. 2018).
On the contrary, a recent study performed by Luque & Pallé (2022) further suggests that there is a density gap, but not a radius gap, separating rocky planets and water-rich worlds with no planets with intermediate composition. Using a sample of 34 exoplanets with well-characterized densities around M-dwarf stars, they identified three populations: rocky planets (ρ = 0.94 ± 0.13 ρ⊕), water-rich planets (ρ = 0.47 ± 0.05 ρ⊕), and gas-rich planets (ρ = 0.24 ± 0.04 ρ⊕). These study findings favor the pebble accretion model (Venturini et al. 2020; Brügger et al. 2020) as the main mechanism for forming small planets around M dwarfs, where rocky planets are formed within the ice line while water-rich planets are formed beyond the ice line and then migrated inwards. However, as for previous studies, the sample of exoplanets used in this study is not large enough to draw firm conclusions.
Figure 9 shows the current period–radius diagram of all known exoplanets with precise radius measurements orbiting M dwarfs. The empirical locations of the radius valley for FGK stars as predicted by thermally driven photoevaporation (dashed line) given by Van Eylen et al. (2018) and for low-mass stars as predicted by gas-poor formation (solid line) given by Cloutier & Menou (2020) are also displayed. With a radius of  R⊕ and orbital period of 4. 8026343 ± 0. 0000030 days, TOI-1680 b is located close to the center of the super-Earth population where the two models predict the location of small rocky planets. With a future planetary mass determination, TOI-1680 b can join the growing sample of small planets with precise bulk densities around M dwarfs.
Median values and 68% confidence intervals for the parameters of TOI-1680 b obtained using EXOFASTv2.
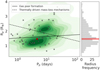 |
Fig. 9 Distribution of planet radii and orbital periods for all confirmed small planets hosted by low-mass stars (M* ≲ 0.65 M⊙). The solid and dashed lines represent the predicted locations of the radius valley based on the gas-poor formation model and thermally driven photoevaporation models, respectively. The red dot represents the planet TOI-1680 b. The 1D radius distribution, with the location of the planet TOI-1680 b, is shown on the right panel. |
4.2 Prospects for a radial velocity follow-up
The precise mass determination of TOI-1680 b would allow us to better constrain the detectability of a possible atmosphere and better locate the planet in the radius-density gap. High-precision radial velocity (RV) measurements will not only allow us to constrain the planetary mass, but also constrain its orbit such as its eccentricity, which may shed some light onto the dynamical history of the system. TOI-1680 b has a radius of  R⊕. Thus, we expect a RV semi-amplitude of
  m s−1, assuming a circular orbit and a mass of
  M⊕, as predicted from the mass–radius relation of Chen & Kipping (2017).
Not many high-precision spectrographs in the northern hemisphere are capable of detecting such a shallow signal from a faint target (V = 15.87 mag and J = 11.63 mag). Many typical planet finders, mounted on 2–4m class telescopes such as CARMENES (Quirrenbach et al. 2020), HARPS-N (Cosentino et al. 2012), NEID (Schwab et al. 2016) or EXPRES (Jurgenson et al. 2016) have limiting magnitudes that are brighter than V=15.87. MAROON-X at the 8.1 m Gemini North telescope (Seifahrt et al. 2020) has shown to reach the necessary precision for faint M-dwarf host stars (Seifahrt et al. 2022). Despite the high declination, it would be possible to reach a S/N of about 40 in the red arm after a 15 min exposure. Assuming a stellar activity level of < 1.5 m s−1, this would allow for an overall precision of 0.7 m s−1 precision with about 70 spectra. Thus, it will be possible to measure the planet mass with state-of-the-art instrumentation at 5 σ precision by investing about 29 h of telescope time on a 8-m-class telescope.
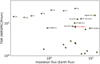 |
Fig. 10 Transmission Spectroscopy Metric for known planets that can be observed with the JWST NIRSPEC/Prism. The sample is limited to exoplanets with equilibrium temperatures below 500 K and radii smaller than 1.5 R⊕ and orbiting stars fainter than J = 10.5. The x-axis is limited to 16 times Earth insolation flux. TOI-1680 b is labeled and highlighted with a star. Data were taken from NASA Exoplanet Archive on June 25, 2023. |
4.3 Potential for atmospheric characterization
We assess the potential for atmospheric characterization of TOI-1680 b with JWST using the transmission spectroscopy metric (TSM, Kempton et al. 2018). The TSM quantifies the expected S/N in the transmission spectrum of a given planet with a cloud-free atmosphere. Analytically, it is expressed as:

where Rp and Mp are the planetary radius and mass in Earth units, R* is the stellar radius in Solar radii, Teq is the equilibrium temperature of the planet in K and mJ is the apparent magnitude of the star in the J band. Also, S is a scale factor whose value depends on the planetary radius range.
TOI-1680 b is a cool (Teq < 500 K) super-Earth (R < 1.5 R⊕). With J = 11.6, the host star is within reach of the JWST NIR-Spec/PRISM (0.6–5.3 μm) instrument (Jakobsen et al. 2022), which cannot observe stars brighter than J = 10. 5 without saturation. We used the TSM to assess the suitability of all cool (Teq < 500 K) planets with radii smaller than 1.5 R⊕ orbiting stars fainter than J = 10.5 for atmospheric studies with this instrument. This sample of exoplanets contains 63 targets. We used the empirical mass–radius relation of Chen & Kipping (2017) to estimate the mass of planets that do not have mass measurements as is the case for TOI-1680 b. TSM values of these planets are shown in Fig. 10. We found that TOI-1680 b has a TSM=7.82 which indicate that it could be a suitable target for transmission studies with the JWST NIRSpec/PRISM instrument. Specifically, amongst 63 targets, TOI-1680 b ranks as the thirteenth most amenable target for these studies. It follows all the TRAPPIST-1 planets (Gillon et al. 2017), Kepler-42 d (Muirhead et al. 2012), K2-415 b (Hirano et al. 2023), LP 791-18 d (Peterson et al. 2023), LP 890-9 b (Delrez et al. 2022) and TOI-237 b (Waalkes et al. 2021). Moreover, the TSM is based on 10h of JWST observing time and with an ecliptic latitude of β = +81.05 deg. TOI-1680 b is located near the JWST CVZ, and it has the advantage of being observable for about 250 days per year, which encourages its atmospheric characterization.
5 Conclusion
We have reported the discovery and initial characterization of TOI-1680 b, a super-Earth orbiting a faint mid-M dwarf (V = 15.87). We used the combination of 2-min cadence TESS observations from 19 sectors, ground-based photometry, high-angular-resolution imaging and spectroscopic observations to validate its planetary nature. Joint analyses of TESS and ground-based data yielded a planetary radius of  R⊕, an orbital period of
  days and an equilibrium temperature of 404 ± 14 K. According to the transmission spectroscopy metric (TSM) of Kempton et al. (2018), TOI-1680 b could be a promising candidate for atmospheric characterization with the JWST. However, a stronger prediction of the expected S/N waits for direct mass measurement from radial velocity observations, which could be done with the MAROON-X instrument at the 8.1 m Gemini North telescope.
Acknowledgements
This research received funding from the European Research Council (ERC) under the European Union’s Horizon 2020 research and innovation programme (grant agreement no. 803193/BEBOP). B.V.R. thanks the Heising-Simons Foundation for support. TRAPPIST is funded by the Belgian Fund for Scientific Research (Fond National de la Recherche Scientifique, FNRS) under the grant FRFC 2.5.594.09.F, with the participation of the Swiss National Science Fundation (SNF). The ULiege’s contribution to SPECULOOS has received funding from the European Research Council under the European Union’s Seventh Framework Programme (FP/2007-2013) (grant Agreement n° 336480/SPECULOOS), from the Balzan Prize and Francqui Foundations, from the Belgian Scientific Research Foundation (F.R.S.-FNRS; grant no. T.0109.20), from the University of Liege, and from the ARC grant for Concerted Research Actions financed by the Wallonia-Brussels Federation. This work is based upon observations carried out at the Observatorio Astronómico Nacional on the Sierra de San Pedro Mártir (OAN-SPM), Baja California, México. SAINT-EX observations and team were supported by the Swiss National Science Foundation (PP00P2-163967 and PP00P2-190080), the Centre for Space and Habitability (CSH) of the University of Bern, the National Centre for Competence in Research PlanetS, supported by the Swiss National Science Foundation (SNSF), and UNAM PAPIIT-IG101321. The postdoctoral fellowship of KB is funded by F.R.S.-FNRS grant T.0109.20 and by the Francqui Foundation. This work makes use of observations from the LCOGT network. Part of the LCOGT telescope time was granted by NOIRLab through the Mid-Scale Innovations Program (MSIP). MSIP is funded by NSF. This research has made use of the Exoplanet Follow-up Observation Program (ExoFOP; DOI: 10.26134/ExoFOP5) website, which is operated by the California Institute of Technology, under contract with the National Aeronautics and Space Administration under the Exoplanet Exploration Program. Funding for the TESS mission is provided by NASA’s Science Mission Directorate. K.A..C. acknowledges support from the TESS mission via subaward s3449 from MIT. Resources supporting this work were provided by the NASA High-End Computing (HEC) Program through the NASA Advanced Supercomputing (NAS) Division at Ames Research Center for the production of the SPOC data products. This paper is based on observations made with the MuSCAT3 instrument, developed by the Astrobiology Center and under financial supports by JSPS KAKENHI (JP18H05439) and JST PRESTO (JPMJPR1775), at Faulkes Telescope North on Maui, HI, operated by the Las Cumbres Observatory. This work is partly supported by JSPS KAKENHI Grant Number JP18H05439 and JST CREST Grant Number JPMJCR1761. This work was partially supported by a grant from the Erasmus+ International Credit Mobility program (M. Ghachoui). M.G. is F.R.S-FNRS Research Director. L.D. is an F.R.S.-FNRS Postdoctoral Researcher. J.d.W. and M.I.T. gratefully acknowledge financial support from the Heising-Simons Foundation, Dr. and Mrs. Colin Masson and Dr. Peter A. Gilman for Artemis, the first telescope of the SPECULOOS network situated in Tenerife, Spain. F.J.P. acknowledges financial support from the grant CEX2021-001131-S funded by MCIN/AEI/10.13039/501100011033. This publication benefits from the support of the French Community of Belgium in the context of the FRIA Doctoral Grant awarded to M.T.
Appendix A Target pixel files of TOI-1680
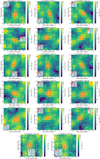 |
Fig. A.1 TESS target pixel file images of TOI-1680 observed in Sectors 16, 17, 18, 19, 20, 21, 22, 23, 24, 25, 26, 40, 41, 47, 49, and 50, shown on the left. The red circles show the sources in the field identified by the Gaia DR2 catalogue with scaled magnitudes. The position of the targets is indicated by white crosses and the mosaic of orange squares show the mask used by the pipeline to extract the SPOC photometry. These plots were created with tpfplotter (Aller et al. 2020). |
References
- Aller, A., Lillo-Box, J., Jones, D., Miranda, L. F., & Barceló Forteza, S. 2020, A&A, 635, A128 [NASA ADS] [CrossRef] [EDP Sciences] [Google Scholar]
- Angus, R., Foreman-Mackey, D., & Johnson, J. A. 2016, ApJ, 818, 109 [NASA ADS] [CrossRef] [Google Scholar]
- Barkaoui, K., Burdanov, A., Hellier, C., et al. 2019, AJ, 157, 43 [NASA ADS] [CrossRef] [Google Scholar]
- Benedict, G. F., Henry, T. J., Franz, O. G., et al. 2016, AJ, 152, 141 [Google Scholar]
- Berta, Z. K., Irwin, J., Charbonneau, D., Burke, C. J., & Falco, E. E. 2012, AJ, 144, 145 [Google Scholar]
- Bochanski, J. J., West, A. A., Hawley, S. L., & Covey, K. R. 2007, AJ, 133, 531 [NASA ADS] [CrossRef] [Google Scholar]
- Boyajian, T. S., von Braun, K., van Belle, G., et al. 2012, ApJ, 757, 112 [Google Scholar]
- Brown, T. M., Baliber, N., Bianco, F. B., et al. 2013, PASP, 125, 1031 [Google Scholar]
- Brügger, N., Burn, R., Coleman, G. A. L., Alibert, Y., & Benz, W. 2020, A&A, 640, A21 [NASA ADS] [CrossRef] [EDP Sciences] [Google Scholar]
- Burdanov, A. Y., de Wit, J., Gillon, M., et al. 2022, PASP, 134, 105001 [CrossRef] [Google Scholar]
- Burgasser, A. J., & Splat Development Team. 2017, in ASI Conf. Ser., 14, 7 [NASA ADS] [Google Scholar]
- Chen, J., & Kipping, D. 2017, ApJ, 834, 17 [Google Scholar]
- Chen, H., & Rogers, L. A. 2016, ApJ, 831, 180 [Google Scholar]
- Choi, J., Dotter, A., Conroy, C., et al. 2016, ApJ, 823, 102 [Google Scholar]
- Ciardi, D. R., Beichman, C. A., Horch, E. P., & Howell, S. B. 2015, ApJ, 805, 16 [NASA ADS] [CrossRef] [Google Scholar]
- Claret, A. 2017, A&A, 600, A30 [NASA ADS] [CrossRef] [EDP Sciences] [Google Scholar]
- Claret, A., & Bloemen, S. 2011, A&A, 529, A75 [NASA ADS] [CrossRef] [EDP Sciences] [Google Scholar]
- Cloutier, R., & Menou, K. 2020, AJ, 159, 211 [NASA ADS] [CrossRef] [Google Scholar]
- Collins, K. A., Kielkopf, J. F., Stassun, K. G., & Hessman, F. V. 2017, AJ, 153, 77 [Google Scholar]
- Cosentino, R., Lovis, C., Pepe, F., et al. 2012, Proc. SPIE, 8446, 84461V [Google Scholar]
- Cushing, M. C., Vacca, W. D., & Rayner, J. T. 2004, PASP, 116, 362 [NASA ADS] [CrossRef] [Google Scholar]
- Cushing, M. C., Rayner, J. T., & Vacca, W. D. 2005, ApJ, 623, 1115 [Google Scholar]
- Cutri, R. M., Skrutskie, M. F., van Dyk, S., et al. 2003, VizieR Online Data Catalog, II/246 [Google Scholar]
- Cutri, R. M., Wright, E. L., Conrow, T., et al. 2013, Explanatory Supplement to the AllWISE Data Release Products [Google Scholar]
- Delrez, L., Gillon, M., Queloz, D., et al. 2018, SPIE Conf. Ser., 10700, 107001I [Google Scholar]
- Delrez, L., Murray, C. A., Pozuelos, F. J., et al. 2022, A&A, 667, A59 [NASA ADS] [CrossRef] [EDP Sciences] [Google Scholar]
- Deming, D., & Sheppard, K. 2017, ApJ, 841, L3 [NASA ADS] [CrossRef] [Google Scholar]
- Demory, B. O., Pozuelos, F. J., Gómez Maqueo Chew, Y., et al. 2020, A&A, 642, A49 [NASA ADS] [CrossRef] [EDP Sciences] [Google Scholar]
- Dotter, A. 2016, ApJS, 222, 8 [Google Scholar]
- Eastman, J. D., Rodriguez, J. E., Agol, E., et al. 2019, ArXiv e-prints [arXiv:1907.09480] [Google Scholar]
- Fressin, F., Torres, G., Charbonneau, D., et al. 2013, ApJ, 766, 81 [NASA ADS] [CrossRef] [Google Scholar]
- Fulton, B. J., Petigura, E. A., Howard, A. W., et al. 2017, AJ, 154, 109 [Google Scholar]
- Furlan, E., Ciardi, D. R., Everett, M. E., et al. 2017, AJ, 153, 71 [NASA ADS] [CrossRef] [Google Scholar]
- Gaia Collaboration (Brown, A. G. A., et al.) 2018, A&A, 616, A1 [NASA ADS] [CrossRef] [EDP Sciences] [Google Scholar]
- Gaia Collaboration 2020, VizieR Online Data Catalog: I/350 [Google Scholar]
- Garcia, L. J., Timmermans, M., Pozuelos, F. J., et al. 2022, MNRAS, 509, 4817 [Google Scholar]
- Gavel, D., Kupke, R., Dillon, D., et al. 2014, SPIE Conf. Ser., 9148, 914805 [NASA ADS] [Google Scholar]
- Giacalone, S., Dressing, C. D., Jensen, E. L. N., et al. 2021, AJ, 161, 24 [Google Scholar]
- Gillon, M., Anderson, D. R., Collier-Cameron, A., et al. 2013, A&A, 552, A82 [NASA ADS] [CrossRef] [EDP Sciences] [Google Scholar]
- Gillon, M., Triaud, A. H. M. J., Demory, B.-O., et al. 2017, Nature, 542, 456 [NASA ADS] [CrossRef] [Google Scholar]
- Ginzburg, S., Schlichting, H. E., & Sari, R. 2016, ApJ, 825, 29 [Google Scholar]
- Ginzburg, S., Schlichting, H. E., & Sari, R. 2018, MNRAS, 476, 759 [Google Scholar]
- Guerrero, N. M., Seager, S., Huang, C. X., et al. 2021, ApJS, 254, 39 [NASA ADS] [CrossRef] [Google Scholar]
- Hamuy, M., Walker, A. R., Suntzeff, N. B., et al. 1992, PASP, 104, 533 [NASA ADS] [CrossRef] [Google Scholar]
- Hamuy, M., Suntzeff, N. B., Heathcote, S. R., et al. 1994, PASP, 106, 566 [NASA ADS] [CrossRef] [Google Scholar]
- Hippke, M., David, T. J., Mulders, G. D., & Heller, R. 2019, AJ, 158, 143 [Google Scholar]
- Hirano, T., Dai, F., Livingston, J. H., et al. 2023, AJ, 165, 131 [NASA ADS] [CrossRef] [Google Scholar]
- Howard, A. W., Marcy, G. W., Bryson, S. T., et al. 2012, ApJS, 201, 15 [Google Scholar]
- Jakobsen, P., Ferruit, P., Alves de Oliveira, C., et al. 2022, A&A, 661, A80 [NASA ADS] [CrossRef] [EDP Sciences] [Google Scholar]
- Jayasinghe, T., Kochanek, C. S., Stanek, K. Z., et al. 2018, MNRAS, 477, 3145 [Google Scholar]
- Jehin, E., Gillon, M., Queloz, D., et al. 2011, The Messenger, 145, 2 [NASA ADS] [Google Scholar]
- Jenkins, J. M. 2002, ApJ, 575, 493 [Google Scholar]
- Jenkins, J. M., Chandrasekaran, H., McCauliff, S. D., et al. 2010, SPIE Conf. Ser., 7740, 77400D [Google Scholar]
- Jenkins, J. M., Twicken, J. D., McCauliff, S., et al. 2016, SPIE Conf. Ser., 9913, 99133E [Google Scholar]
- Jenkins, J. S., Pozuelos, F. J., Tuomi, M., et al. 2019, MNRAS, 490, 5585 [Google Scholar]
- Jenkins, J. M., Tenenbaum, P., Seader, S., et al. 2020, Kepler Data Processing [Google Scholar]
- Handbook: Transiting Planet Search, Kepler Science Document KSCI-19081-003, ed. J. M. Jenkins, 9 [Google Scholar]
- Jensen, E. 2013, Astrophysics Source Code Library [record ascl:1306.007] [Google Scholar]
- Jin, S., Mordasini, C., Parmentier, V., et al. 2014, ApJ, 795, 65 [Google Scholar]
- Johnson, J. A., Petigura, E. A., Fulton, B. J., et al. 2017, AJ, 154, 108 [Google Scholar]
- Jurgenson, C., Fischer, D., McCracken, T., et al. 2016, SPIE Conf. Ser., 9908, 99086T [Google Scholar]
- Kempton, E. M.-R., Bean, J. L., Louie, D. R., et al. 2018, PASP, 130, 114401 [CrossRef] [Google Scholar]
- Kirkpatrick, J. D., Looper, D. L., Burgasser, A. J., et al. 2010, ApJS, 190, 100 [Google Scholar]
- Kochanek, C. S., Shappee, B. J., Stanek, K. Z., et al. 2017, PASP, 129, 104502 [Google Scholar]
- Kupke, R., Gavel, D., Roskosi, C., et al. 2012, SPIE Conf. Ser., 8447, 84473G [NASA ADS] [Google Scholar]
- Lee, E. J., & Chiang, E. 2016, ApJ, 817, 90 [Google Scholar]
- Lee, E. J., & Connors, N. J. 2021, ApJ, 908, 32 [NASA ADS] [CrossRef] [Google Scholar]
- Lee, E. J., Chiang, E., & Ormel, C. W. 2014, ApJ, 797, 95 [Google Scholar]
- Lépine, S., Rich, R. M., & Shara, M. M. 2003, AJ, 125, 1598 [CrossRef] [Google Scholar]
- Lépine, S., Rich, R. M., & Shara, M. M. 2007, ApJ, 669, 1235 [CrossRef] [Google Scholar]
- Li, J., Tenenbaum, P., Twicken, J. D., et al. 2019, PASP, 131, 024506 [NASA ADS] [CrossRef] [Google Scholar]
- Lindegren, L. 2020, A&A, 633, A1 [Google Scholar]
- Lopez, E. D., & Fortney, J. J. 2013, ApJ, 776, 2 [Google Scholar]
- Luque, R., & Pallé, E. 2022, Science, 377, 1211 [NASA ADS] [CrossRef] [Google Scholar]
- Luque, R., Serrano, L. M., Molaverdikhani, K., et al. 2021, A&A, 645, A41 [NASA ADS] [CrossRef] [EDP Sciences] [Google Scholar]
- Mann, A. W., Brewer, J. M., Gaidos, E., Lépine, S., & Hilton, E. J. 2013, AJ, 145, 52 [Google Scholar]
- Mann, A. W., Deacon, N. R., Gaidos, E., et al. 2014, AJ, 147, 160 [CrossRef] [Google Scholar]
- Mann, A. W., Feiden, G. A., Gaidos, E., Boyajian, T., & von Braun, K. 2015, ApJ, 804, 64 [Google Scholar]
- Mann, A. W., Dupuy, T., Kraus, A. L., et al. 2019, ApJ, 871, 63 [Google Scholar]
- Martín, E. L., Delfosse, X., Basri, G., et al. 1999, AJ, 118, 2466 [Google Scholar]
- McCully, C., Volgenau, N. H., Harbeck, D.-R., et al. 2018, SPIE Conf. Ser., 10707, 107070K [Google Scholar]
- McGurk, R., Rockosi, C., Gavel, D., et al. 2014, SPIE Conf. Ser., 9148, 91483A [NASA ADS] [Google Scholar]
- Miller, J. S., & Stone, R. P. S. 1994, The Kast Double Spectrograph, Tech. Rep. 66, University of California Lick Observatory Technical Reports [Google Scholar]
- Mugrauer, M., & Michel, K.-U. 2020, Astron. Nachr., 341, 996 [NASA ADS] [CrossRef] [Google Scholar]
- Mugrauer, M., & Michel, K.-U. 2021, Astron. Nachr., 342, 840 [NASA ADS] [CrossRef] [Google Scholar]
- Muirhead, P. S., Johnson, J. A., Apps, K., et al. 2012, ApJ, 747, 144 [Google Scholar]
- Narita, N., Fukui, A., Yamamuro, T., et al. 2020, SPIE Conf. Ser., 11447, 114475K [NASA ADS] [Google Scholar]
- Newton, E. R., Irwin, J., Charbonneau, D., et al. 2016, ApJ, 821, 93 [Google Scholar]
- Owen, J. E., & Wu, Y. 2013, ApJ, 775, 105 [Google Scholar]
- Parviainen, H. 2015, MNRAS, 450, 3233 [Google Scholar]
- Parviainen, H., & Aigrain, S. 2015, MNRAS, 453, 3821 [Google Scholar]
- Peterson, M. S., Benneke, B., Collins, K., et al. 2023, Nature, 617, 701 [NASA ADS] [CrossRef] [Google Scholar]
- Petigura, E. A., Howard, A. W., Marcy, G. W., et al. 2017, AJ, 154, 107 [NASA ADS] [CrossRef] [Google Scholar]
- Quirrenbach, A., CARMENES Consortium, Amado, P. J., et al. 2020, SPIE Conf. Ser., 11447, 114473C [Google Scholar]
- Rayner, J. T., Toomey, D. W., Onaka, P. M., et al. 2003, PASP, 115, 362 [NASA ADS] [CrossRef] [Google Scholar]
- Rayner, J. T., Cushing, M. C., & Vacca, W. D. 2009, ApJS, 185, 289 [Google Scholar]
- Reid, I. N., Hawley, S. L., & Gizis, J. E. 1995, AJ, 110, 1838 [Google Scholar]
- Ricker, G. R., Winn, J. N., Vanderspek, R., et al. 2015, J. Astron. Telescopes Instrum. Syst., 1, 014003 [Google Scholar]
- Riddick, F. C., Roche, P. F., & Lucas, P. W. 2007, MNRAS, 381, 1067 [Google Scholar]
- Rojas-Ayala, B., Covey, K. R., Muirhead, P. S., & Lloyd, J. P. 2012, ApJ, 748, 93 [Google Scholar]
- Savel, A. B., Dressing, C. D., Hirsch, L. A., et al. 2020, AJ, 160, 287 [NASA ADS] [CrossRef] [Google Scholar]
- Schanche, N., Pozuelos, F. J., Günther, M. N., et al. 2022, A&A, 657, A45 [NASA ADS] [CrossRef] [EDP Sciences] [Google Scholar]
- Schlafly, E. F., & Finkbeiner, D. P. 2011, ApJ, 737, 103 [Google Scholar]
- Schwab, C., Rakich, A., Gong, Q., et al. 2016, SPIE Conf. Ser., 9908, 99087H [NASA ADS] [Google Scholar]
- Sebastian, D., Gillon, M., Ducrot, E., et al. 2021, A&A, 645, A100 [EDP Sciences] [Google Scholar]
- Seifahrt, A., Bean, J. L., Stürmer, J., et al. 2020, SPIE Conf. Ser., 11447, 114471F [NASA ADS] [Google Scholar]
- Seifahrt, A., Bean, J. L., Kasper, D., et al. 2022, SPIE Conf. Ser., 12184, 121841G [NASA ADS] [Google Scholar]
- Shappee, B. J., Prieto, J. L., Grupe, D., et al. 2014, ApJ, 788, 48 [Google Scholar]
- Smith, J. C., Stumpe, M. C., Van Cleve, J. E., et al. 2012, PASP, 124, 1000 [Google Scholar]
- Stassun, K. G., Oelkers, R. J., Pepper, J., et al. 2018, AJ, 156, 183 [NASA ADS] [CrossRef] [Google Scholar]
- Stumpe, M. C., Smith, J. C., Van Cleve, J. E., et al. 2012, PASP, 124, 985 [Google Scholar]
- Stumpe, M. C., Smith, J. C., Catanzarite, J. H., et al. 2014, PASP, 126, 100 [Google Scholar]
- Twicken, J. D., Catanzarite, J. H., Clarke, B. D., et al. 2018, PASP, 130, 064502 [Google Scholar]
- Van Eylen, V., Agentoft, C., Lundkvist, M. S., et al. 2018, MNRAS, 479, 4786 [Google Scholar]
- Venturini, J., Guilera, O. M., Haldemann, J., Ronco, M. P., & Mordasini, C. 2020, A&A, 643, A1 [Google Scholar]
- Waalkes, W. C., Berta-Thompson, Z. K., Collins, K. A., et al. 2021, AJ, 161, 13 [NASA ADS] [CrossRef] [Google Scholar]
- Wells, R. D., Rackham, B. V., Schanche, N., et al. 2021, A&A, 653, A97 [NASA ADS] [CrossRef] [EDP Sciences] [Google Scholar]
- West, A. A., Hawley, S. L., Bochanski, J. J., et al. 2008, AJ, 135, 785 [Google Scholar]
- Wizinowich, P., Acton, D. S., Shelton, C., et al. 2000, PASP, 112, 315 [NASA ADS] [CrossRef] [Google Scholar]
- Wong, I., & Shporer, A. 2022, in Bull. Am. Astron. Soc., 54, 102.320 [Google Scholar]
- Zacharias, N., Finch, C. T., Girard, T. M., et al. 2012, VizieR Online Data Catalog: I/322A [Google Scholar]
- Ziegler, C., Tokovinin, A., Briceño, C., et al. 2020, AJ, 159, 19 [Google Scholar]
Available at http://irtfweb.ifa.hawaii.edu/~spex/observer/
All Tables
Ground-based time-series photometric observations of TOI-1680, and the detrending parameters that maximize the log-likelihood of each light curve.
Quadratic limb-darkening coefficients used in the photometric joint analysis for each passband.
Median values and 68% confidence intervals for the parameters of TOI-1680 b obtained using EXOFASTv2.
All Figures
|
Fig. 1 Target pixel files (TPFs) of TOI-1680 in TESS Sector 14 and 15, created with tpfplotter (Aller et al. 2020). The orange shaded region represents the aperture used to extract the SPOC photometry. The red circles are the Gaia DR2 sources. Sizes represent magnitude contrasts with respect to TOI-1680. Figure continued in Appendix A. |
| In the text | |
|
Fig. 2 Keck NIR AO imaging and sensitivity curve for TOI-1680 taken in the K filter. The image reaches a contrast of ~7 magnitudes fainter than the host star beyond 0.″5. Inset: image of the central portion of the data. |
| In the text | |
|
Fig. 3 High-resolution imaging and contrast curves of TOI-1680 obtained with the ShARCS camera on the Shane 3-m telescope, with the J (left) and Ks filter (right). No secondary sources were detected. |
| In the text | |
|
Fig. 4 Kast optical spectrum of TOI-1680 (black lines) compared to M4, M5, and M6 SDSS optical templates (magenta lines from top to bottom) from Bochanski et al. (2007) shown at the top. Each spectral comparison is normalized at 7500 A and offset by a constant of 0.5. Key atomic and molecular absorption features are labeled, including residual O2 telluric absorption at 7600 Å (⊕ symbol). The inset box shows a close-up of the region around the 6563 Å Hα and 6708 Å Li I lines, neither of which are detected. Bottom panel displays SpeX SXD spectrum of TOI-1680 (blue) compared to SpeX SXD spectrum of the M3.5 standard Gl 273 (grey; Rayner et al. 2009). Prominent spectral features of M dwarfs are highlighted, and regions of strong telluric absorption are shaded. The grey lines at the bottom of the plot show the measurement uncertainties for TOI-1680 and Gl 273 (higher and lower, respectively). |
| In the text | |
|
Fig. 5 Spectral energy distribution (SED) of TOI-1680. The red crosses show the broadband observations and the error bars show the width of the filters. The blue circles represent the model fluxes. |
| In the text | |
|
Fig. 6 Systematics-insensitive periodogram (SIP) for TOI-1680 b. The periodogram is calculated for both the corrected light curve (black line in the top panel) and the background (BKG) pixels (blue line in the middle panel). The star and the BKG show the same powers. The bottom panel shows the target to the BKG ratio. We do not see any clear peak for the target. |
| In the text | |
|
Fig. 7 Phase-folded ground-based transit light curves of TOI-1680 b. The unbinned light curves are shown with gray points. The binned points (bin size=10 min) are shown in black with the corresponding error bars. The red line corresponds to the final EXOFASTv2 transit model. |
| In the text | |
|
Fig. 8 TESS light curve folded in phase with the time in hours from mid-transit of TOI-1680 b. The red solid line represents the best-fit transit model from the final joint-fit. The gray dots are the 2-min TESS data and the black dots are the binned data every phase interval of 5 min. The residuals are plotted in the bottom panel. |
| In the text | |
|
Fig. 9 Distribution of planet radii and orbital periods for all confirmed small planets hosted by low-mass stars (M* ≲ 0.65 M⊙). The solid and dashed lines represent the predicted locations of the radius valley based on the gas-poor formation model and thermally driven photoevaporation models, respectively. The red dot represents the planet TOI-1680 b. The 1D radius distribution, with the location of the planet TOI-1680 b, is shown on the right panel. |
| In the text | |
|
Fig. 10 Transmission Spectroscopy Metric for known planets that can be observed with the JWST NIRSPEC/Prism. The sample is limited to exoplanets with equilibrium temperatures below 500 K and radii smaller than 1.5 R⊕ and orbiting stars fainter than J = 10.5. The x-axis is limited to 16 times Earth insolation flux. TOI-1680 b is labeled and highlighted with a star. Data were taken from NASA Exoplanet Archive on June 25, 2023. |
| In the text | |
|
Fig. A.1 TESS target pixel file images of TOI-1680 observed in Sectors 16, 17, 18, 19, 20, 21, 22, 23, 24, 25, 26, 40, 41, 47, 49, and 50, shown on the left. The red circles show the sources in the field identified by the Gaia DR2 catalogue with scaled magnitudes. The position of the targets is indicated by white crosses and the mosaic of orange squares show the mask used by the pipeline to extract the SPOC photometry. These plots were created with tpfplotter (Aller et al. 2020). |
| In the text | |
Current usage metrics show cumulative count of Article Views (full-text article views including HTML views, PDF and ePub downloads, according to the available data) and Abstracts Views on Vision4Press platform.
Data correspond to usage on the plateform after 2015. The current usage metrics is available 48-96 hours after online publication and is updated daily on week days.
Initial download of the metrics may take a while.