Open Access
Fig. 8
Download original image
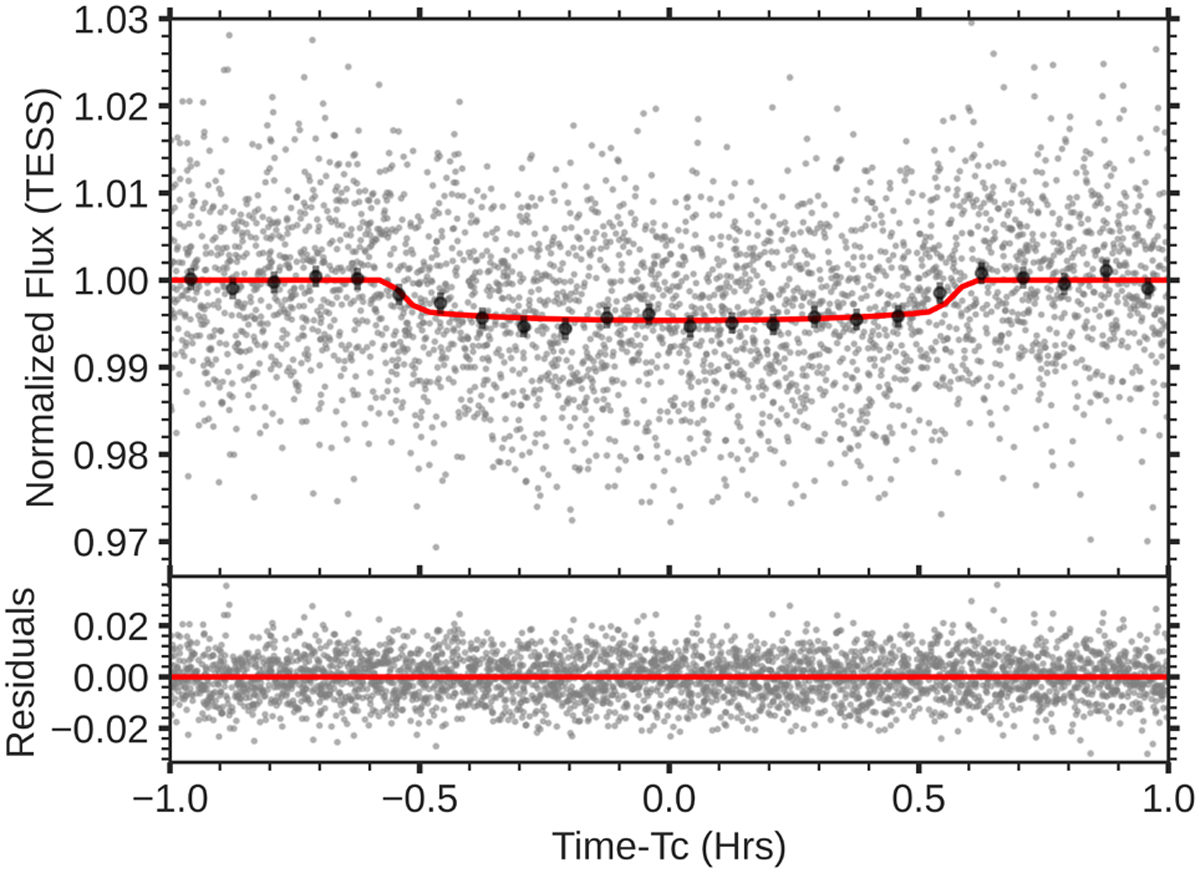
TESS light curve folded in phase with the time in hours from mid-transit of TOI-1680 b. The red solid line represents the best-fit transit model from the final joint-fit. The gray dots are the 2-min TESS data and the black dots are the binned data every phase interval of 5 min. The residuals are plotted in the bottom panel.
Current usage metrics show cumulative count of Article Views (full-text article views including HTML views, PDF and ePub downloads, according to the available data) and Abstracts Views on Vision4Press platform.
Data correspond to usage on the plateform after 2015. The current usage metrics is available 48-96 hours after online publication and is updated daily on week days.
Initial download of the metrics may take a while.