Fig. A.1
Download original image
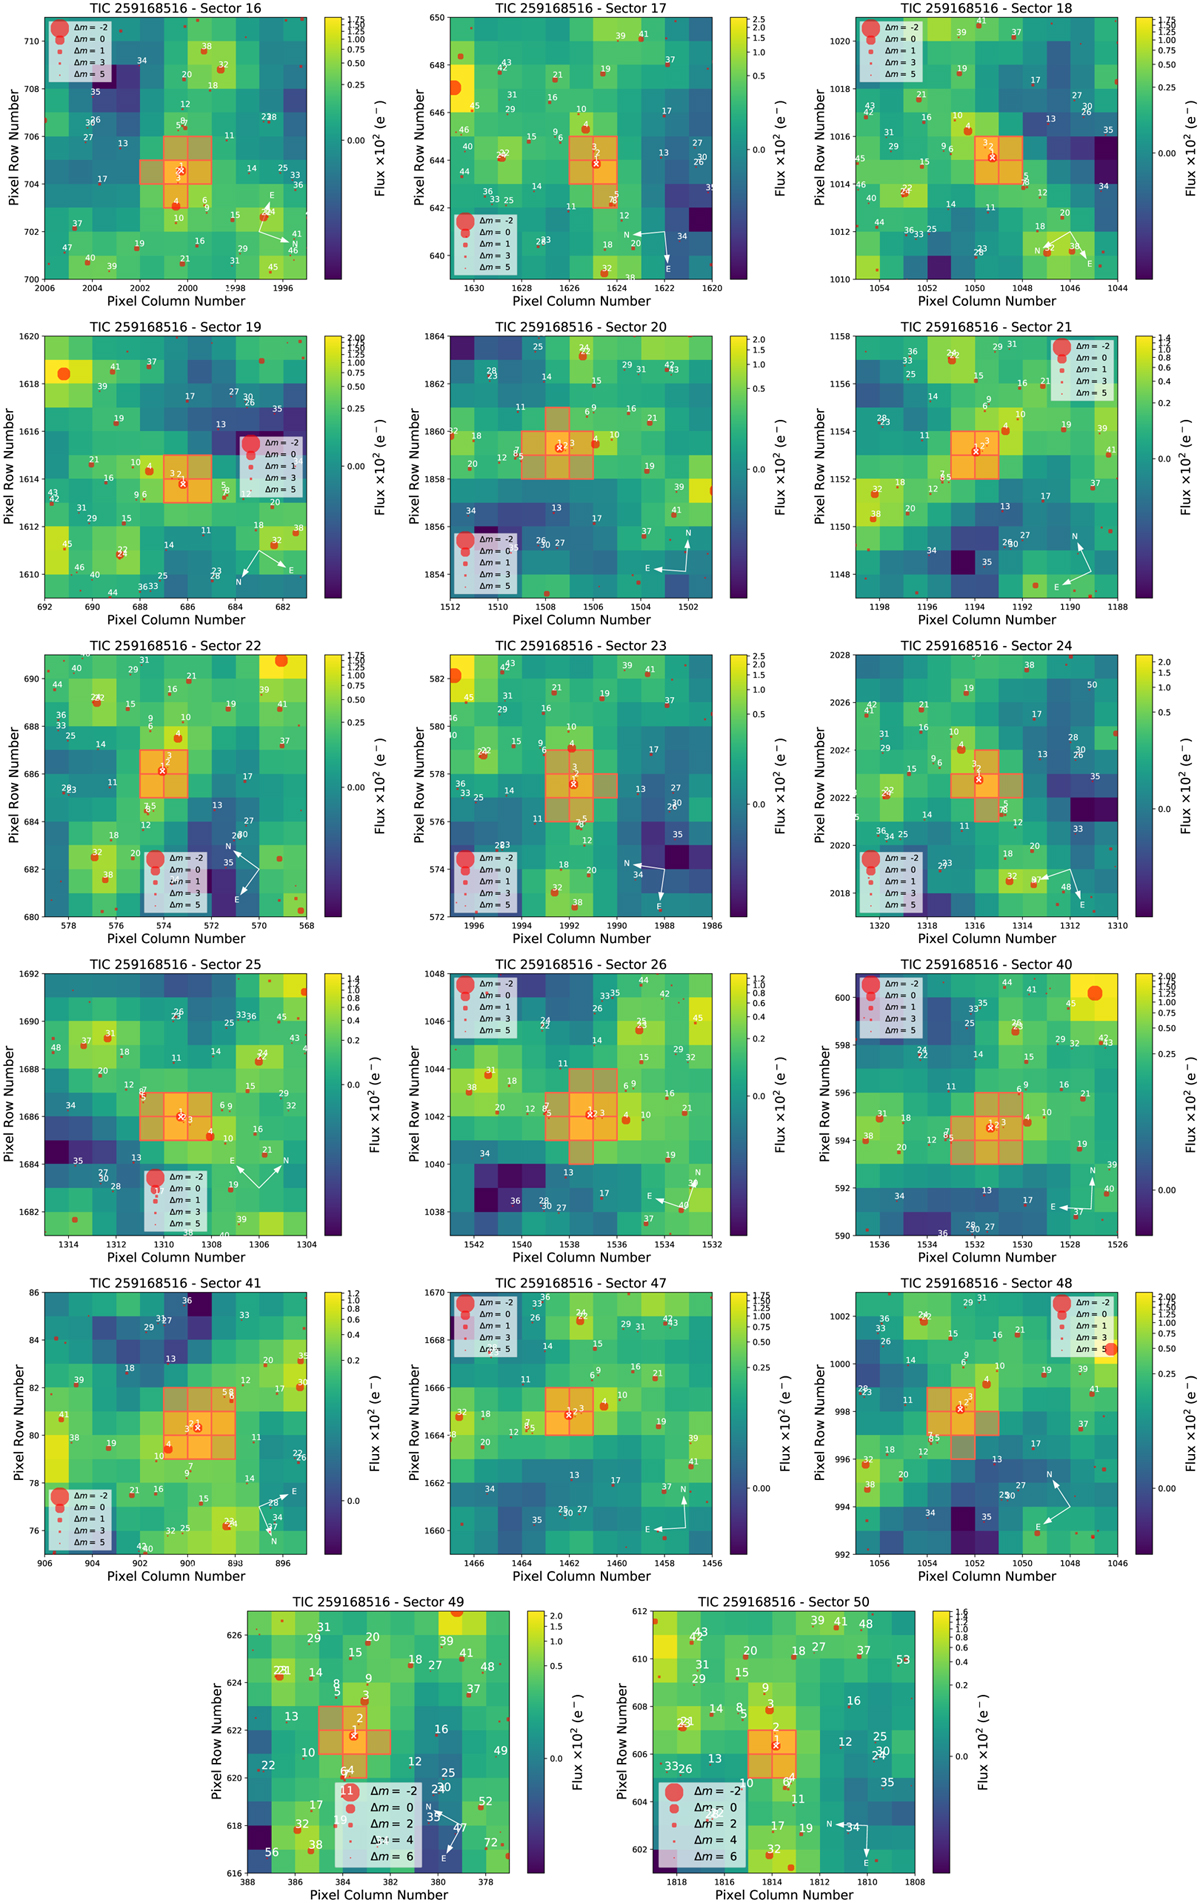
TESS target pixel file images of TOI-1680 observed in Sectors 16, 17, 18, 19, 20, 21, 22, 23, 24, 25, 26, 40, 41, 47, 49, and 50, shown on the left. The red circles show the sources in the field identified by the Gaia DR2 catalogue with scaled magnitudes. The position of the targets is indicated by white crosses and the mosaic of orange squares show the mask used by the pipeline to extract the SPOC photometry. These plots were created with tpfplotter (Aller et al. 2020).
Current usage metrics show cumulative count of Article Views (full-text article views including HTML views, PDF and ePub downloads, according to the available data) and Abstracts Views on Vision4Press platform.
Data correspond to usage on the plateform after 2015. The current usage metrics is available 48-96 hours after online publication and is updated daily on week days.
Initial download of the metrics may take a while.