Fig. 4
Download original image
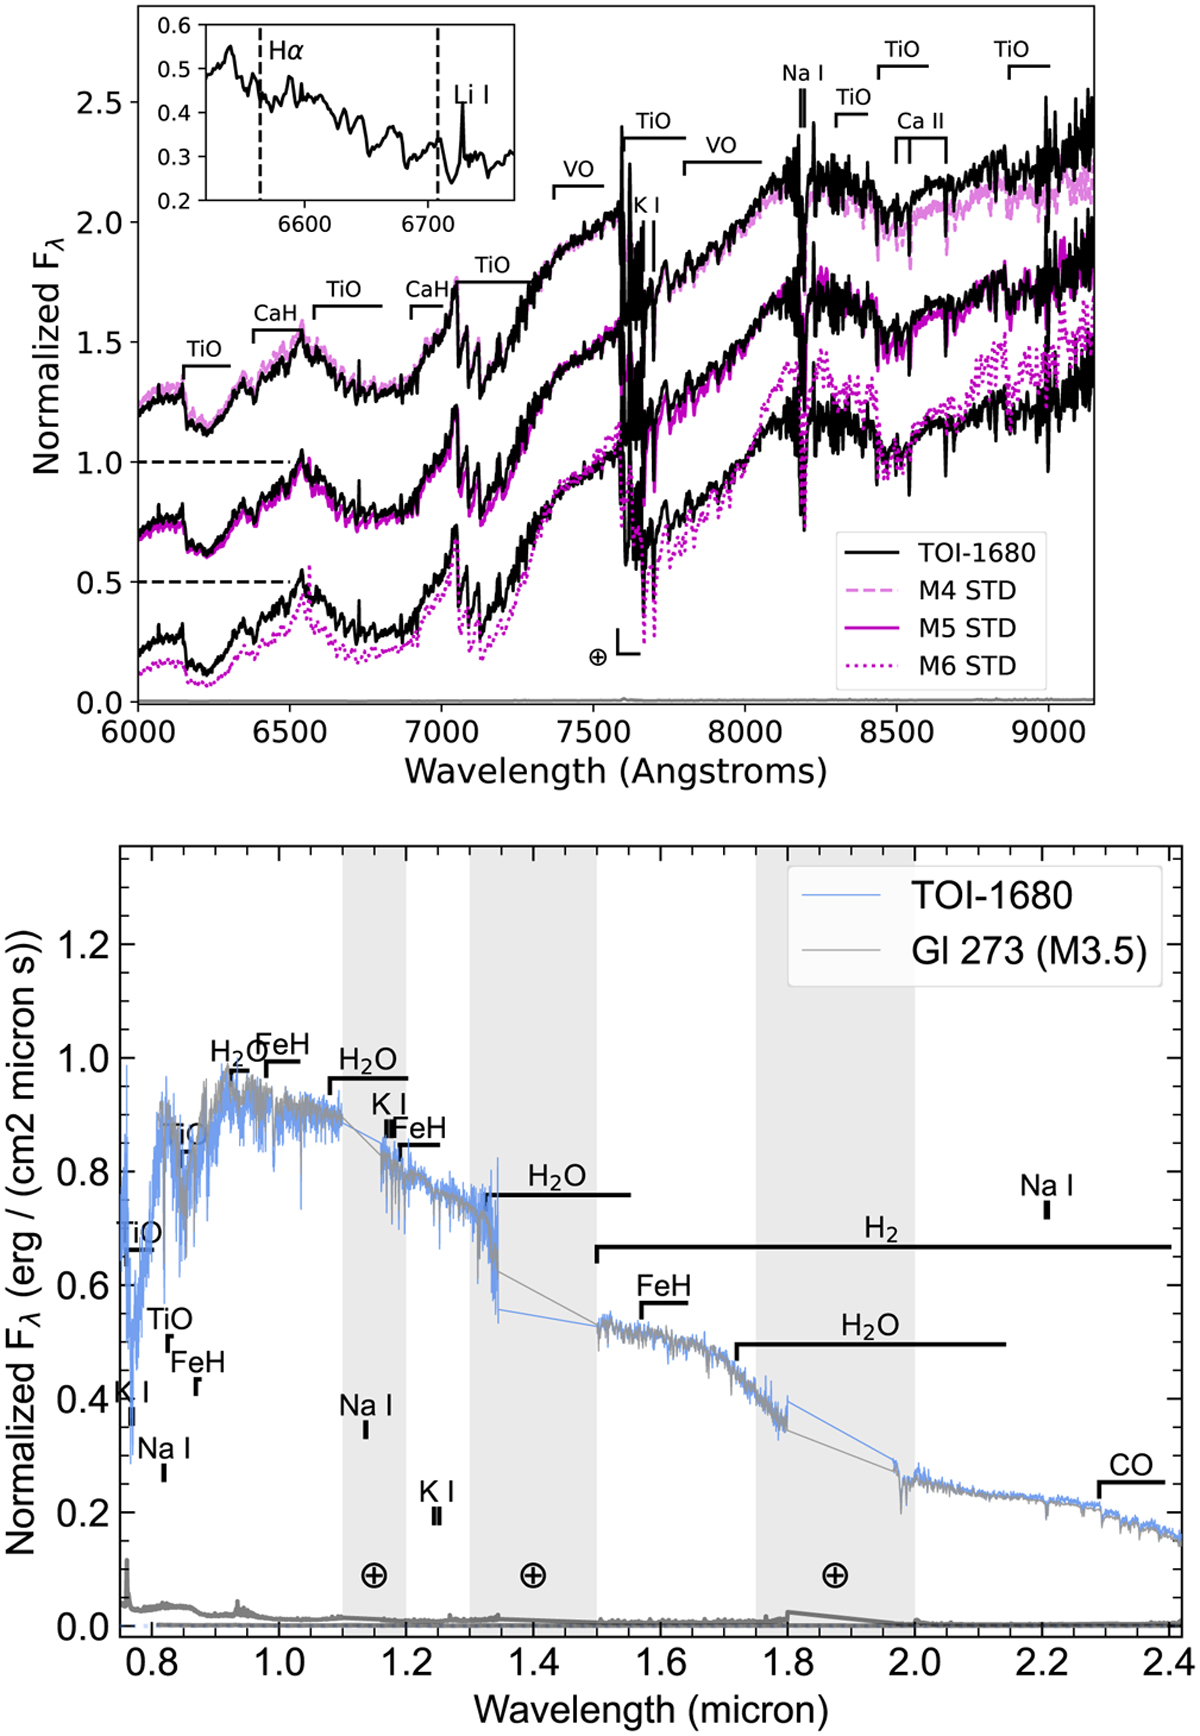
Kast optical spectrum of TOI-1680 (black lines) compared to M4, M5, and M6 SDSS optical templates (magenta lines from top to bottom) from Bochanski et al. (2007) shown at the top. Each spectral comparison is normalized at 7500 A and offset by a constant of 0.5. Key atomic and molecular absorption features are labeled, including residual O2 telluric absorption at 7600 Å (⊕ symbol). The inset box shows a close-up of the region around the 6563 Å Hα and 6708 Å Li I lines, neither of which are detected. Bottom panel displays SpeX SXD spectrum of TOI-1680 (blue) compared to SpeX SXD spectrum of the M3.5 standard Gl 273 (grey; Rayner et al. 2009). Prominent spectral features of M dwarfs are highlighted, and regions of strong telluric absorption are shaded. The grey lines at the bottom of the plot show the measurement uncertainties for TOI-1680 and Gl 273 (higher and lower, respectively).
Current usage metrics show cumulative count of Article Views (full-text article views including HTML views, PDF and ePub downloads, according to the available data) and Abstracts Views on Vision4Press platform.
Data correspond to usage on the plateform after 2015. The current usage metrics is available 48-96 hours after online publication and is updated daily on week days.
Initial download of the metrics may take a while.