| Issue |
A&A
Volume 677, September 2023
|
|
|---|---|---|
| Article Number | A149 | |
| Number of page(s) | 12 | |
| Section | Atomic, molecular, and nuclear data | |
| DOI | https://doi.org/10.1051/0004-6361/202345917 | |
| Published online | 21 September 2023 | |
Ultraviolet electronic spectroscopy of heavily substituted naphthalene derivatives
Insights on the potential double aromatic ring substructures of interstellar bump carriers
Institut des Sciences Moléculaires d’Orsay (ISMO), Université Paris-Saclay, CNRS,
Bât. 520, Rue André Rivière,
91405
Orsay Cedex, France
e-mail: This email address is being protected from spambots. You need JavaScript enabled to view it.
; This email address is being protected from spambots. You need JavaScript enabled to view it.
; This email address is being protected from spambots. You need JavaScript enabled to view it.
Received:
16
January
2023
Accepted:
18
July
2023
Abstract
Context. The so-called bump spectral signature observable on interstellar extinction curves, peaking at 217.5 nm, is commonly assigned to π* ← π transitions from carbonaceous carriers, but the exact nature of the carbonaceous carriers remains debated.
Aims. To constrain the chemical structures associated with the bump carriers, we record and compare the UV spectra of a large variety of carbonaceous molecules to this interstellar feature.
Methods. Large carbonaceous molecules, such as polycyclic aromatic hydrocarbons (PAHs), were produced by a combustion process stabilized at low pressure under rich flame conditions. Species were extracted and probed through resonance enhanced multiphoton ionization spectroscopy coupled to a time-of-flight mass spectrometer. Masses and absorption profiles of the carbonaceous molecules were measured, and their spectra were compared to the bump feature.
Results. Species showing a specific mass progression starting at mass 128 u visible up to mass 394 u with a characteristic progression of +14 u present a common electronic absorption band profile peaking asymptotically around 220 nm. The first masses were assigned to a naphthalene C10H8 molecule and two of its derivatives: C10H7CH3 and C10H7C2H5. The mass progression of +14 u is explained by successive H atom substitutions by CH3 functional groups. This mass distribution was thus assigned to naphthalene derivatives with large aliphatic carbon substitution. This derivative family shows an electronic band assigned to S3 ← S0 transitions involving electron promotion within the π aromatic orbitals of the naphathlene chromophore. More importantly, after a few substitutions, the position of the band converges asymptotically to a value close to the interstellar bump signature, independent of the molecule size.
Conclusions. Based on the asymptotic behavior of the larger members in the species distribution, a similar band position is expected from double aromatic ring substructures within hydrogenated amorphous carbons (HACs). Similar to the conclusions of previous works, we find substituted naphthalene units as substructures of interstellar HACs to be good candidates as carriers of the bump feature.
Key words: methods: laboratory: molecular / ultraviolet: ISM / dust, extinction
Current address and contact: Institute of Condensed Matter and Nanosciences (ICMN), UC Louvain, Chemin du Cyclotron 2/L7.01.07, 1348 Louvain-la-Neuve, Belgium.
© The Authors 2023
 Open Access article, published by EDP Sciences, under the terms of the Creative Commons Attribution License (https://creativecommons.org/licenses/by/4.0), which permits unrestricted use, distribution, and reproduction in any medium, provided the original work is properly cited.
This article is published in open access under the Subscribe to Open model. This email address is being protected from spambots. You need JavaScript enabled to view it. to support open access publication.
1 Introduction
Observations of the extinction and emission spectra of the diffuse interstellar medium (DISM) give access to the composition of its gas and dust particles. Looking at the extinction curve of the DISM in the visible-ultraviolet range, one of the most recognizable spectral signatures is the so-called ultraviolet (UV) bump. This strong signature located at 217.5 nm was discovered by Stecher & Donn (1965) and was characterized by systematic observation along different lines of sight (e.g., Fitzpatrick & Massa 1986; Sofia et al. 2005). Fitzpatrick & Massa (2007) compared 328 interstellar extinction curves highlighting spectroscopic properties of this signature and provided the following observations: The bump is superimposed on a continuum rising toward the VUV; it is widely observed in the DISM; it remains nearly invariable in spectral position in the DISM (central position varies typically from 215 to 220 nm); and it presents a large and highly variable band width, typically its full width at half maximum (FWHM) varies from 1.0 to 1.3 eV.
Potential candidate carriers for the signature of the bump must fulfill the above observational constraints and, in particular, must meet the challenge of reconciling the last two criteria: a fixed position and a width variability. Historically, the contribution of interstellar carbonaceous species was indicated through solid graphitic grains (Draine & Lee 1984). Because of the π* ← π transition in aromatic carbon materials and the high cosmic carbon abundance, theoretical calculations of light extinction by these grains led to the conclusion that they are among the best candidates to match the interstellar bump. Onion-like particles as stacks of curved graphene layers are also among the most promising candidates (Henrard et al. 1997; Tomita et al. 2002; Li et al. 2008). These particles were synthesized from graphite, and a strong UV band showing similarities with the UV bump could be observed (Chhowalla et al. 2003). However, this UV band is not observable for onion-like particles of a few nanometers in size (Jäger et al. 2008). Hydro-genated amorphous carbons (HACs) have also been proposed as potential carriers. First, they were proposed as carriers of infrared (IR) absorption bands (Duley & Williams 1983; Sandford et al. 1991; Pendleton & Allarmandola 2002; Dartois et al. 2004, 2007; Godard et al. 2011), and their contribution to the UV bump was then proposed through various experimental results (Sakata et al. 1994; Colangeli et al. 1995; Mennella et al. 1996; Schnaiter et al. 1998; Gadallah et al. 2011; Duley & Hu 2012; Gavilan et al. 2016, 2017).
Polycyclic aromatic hydrocarbons (PAHs) have also been proposed as UV bump carriers. The PAH molecules are assumed to carry the aromatic infrared bands (AIBs; Tielens 2008) based on the well-known PAH hypothesis proposed in the 1980s (Leger & Puget 1984; Allamandola et al. 1989). The PAH hypothesis relies on the IR fluorescence after absorption of energetic UV photons by PAH molecules. Confirmation of the presence of PAHs in the interstellar medium (ISM) is recent, with two isomers of cyano-naphthalene C10H7CN (McGuire et al. 2021) and of indene C9H8 (Cernicharo et al. 2021; Burkhardt et al. 2021) in the TMC-1 dense cloud being detected through pure rotational spectroscopy. However, column densities of these specific species are still far below (by more than six orders of magnitude) the cosmic C required to explain the AIBs, and these bicyclic molecules would not survive in the DISM where AIBs are observed. The UV gas-phase absorption spectra of different PAH mixtures have been measured, and a band profile relevant to the UV bump feature was observed (Joblin et al. 1992; Cecchi-Pestellini et al. 2008; Steglich et al. 2010). The PAHs in the DISM must be stable against the harsh VUV radiation of the interstellar radiation field, and only carbonaceous molecules with more than about 50 carbon atoms are likely to survive (Jochims et al. 1994; Allain et al. 1996; Montillaud et al. 2013). Since the fullerene cation C60+ identification as a carrier of diffuse interstellar bands (Campbell et al. 2015; Walker et al. 2015), Dubosq et al. (2020) proposed the contribution of carbon cage molecules to the bump signature.
Among these candidates, a fundamental question lies in their structure. Especially for HAC carriers, they represent a whole family with various proportions of aliphatic and aromatic carbon, hydrogen content, and structural organization. Studies of the IR absorption of interstellar dust have shown that H-Csp3 bonds contribute more than ten times that of the H-Csp2 bonds (Dartois et al. 2007). Spectral properties of various carbonaceous dust analogs have been studied, from the far UV to the mid-infrared, and correlations between spectral features and the aromatic/aliphatic ratio have been found (Gavilan et al. 2017). Duley & Hu (2012) deduced a ratio of sp2/sp3 ≈ 0.4 for nanoparticle analogs that exhibit a band center close to 217.5 nm. They also inferred a substructure made of PAHs connected by long aliphatic chains. The probable presence of polycyclic aromatic islands in the carbon lattice of HAC carriers was already proposed by Jones (1990) and might be expected in the DISM where HAC dust particles observed in absorption coexist with polyaromatic dust observed in emission. The formation of aromatic rings within the carbon structure after the activation of HAC samples by a UV photon irradiation has been observed and may result in a bump-like absorption signature in the UV range (Mennella et al. 1996; Gadallah et al. 2011). Beegle et al. (1997) synthesized laboratory analogs from a naphthalene precursor using a plasma reactor. From these analogs, the authors observed a resulting UV spectrum showing a band close to the bump feature. They claimed that the UV profile originates from a “naphthalene” chromophore as a structural component of an alkyl-aromatic polymer.
In this article, we present gas-phase UV spectroscopy performed on carbonaceous molecules that were produced in a flame reactor operated under vacuum. The species produced were extracted and analyzed by resonance enhanced multiphoton ionization (REMPI) and time-of-flight mass spectrometry (ToF-MS). A specific distribution of molecules with a common electronic π* ← π transition centered around 220 nm is identified in the mass spectrum and assigned to naphthalene derivatives. For the largest molecules, the resulting band profile has a spectral position that appears to remain constant regardless of molecular size. In Sect. 2, the experimental setup is introduced. The UV spectroscopy coupled with the mass spectrometry results are presented in Sect. 3. Finally, the results and their implication for the ISM are discussed in Sect. 4.
2 Experimental setup description
The nanograins setup has already been described by Carpentier et al. (2013) and is presented in Fig. 1. The carbonaceous species of interest were produced through a combustion process stabilized at low pressure (40 mbar). A premixed flame produced by a McKenna burner was continuously fed with ethylene (C2H4) and oxygen (O2). Inlet gas was pumped by a primary pump filled with PFPE oil to avoid reactions with reactive species produced by the combustion process. Constant pressure in the combustion chamber was ensured by a controlled butterfly valve. The opening of this valve was systematically adapted thanks to the direct feedback from a capacitance gauge measuring the pressure within the combustion chamber. This setup allowed us to ensure a stationary combustion process over time. The flow rates of C2H4 and O2 were regulated by two independent flow controllers (SLA5850, Brooks Instrument). The combustion reaction reached stoichiometry when the following chemical reaction is fulfilled:
 (1)
(1)
By choosing C2H4 and O2 flow rates such that C/O is greater than 1:3 (C/O being the carbon-to-oxygen atom ratio at the burner inlet), the combustion reaction is incomplete, and a large diversity of carbonaceous species is produced. In the early stages of the incomplete combustion process, PAH molecules are formed as an intermediate species (Bockhorn 1994; Happold et al. 2007; Apicella et al. 2007; Faccinetto et al. 2011; Martin et al. 2022). The early stages of the combustion process can be probed by adjusting the distance between the burner outlet surface and the quartz cone, which is usually called height above burner (HAB). The quartz cone with a 1 mm hole was used to extract the carbonaceous species to subsequent parts of the setup. Molecules from the early-stage combustion process can be extracted with a small HAB distance, whereas large soot particles are extracted by tuning the HAB to greater distances. At large distances, molecules are mostly consumed in the soot formation process. Spatial positions of combustion stages, and therefore HABs, are strongly dependent on the combustion parameter set (chamber pressure, burner total flow inlet, precursor).
Once extracted, the species were found upstream of the Laval nozzle. During standard use, species are diluted in an argon buffer gas and are cooled within the supersonic expansion of the Laval nozzle before being skimmed for spectroscopic analysis. However, in order to increase the concentration of the extracted flame products for ToF-MS analysis, the argon gas buffer was disabled, and the studied species were thus cooled only to room temperature (see Fig. 4 and in Grosch et al. 2015 for comparison with high temperature). Such a temperature is not expected to play a major role in our results (see discussion on temperature impact in Sect. 4). In this scheme, the chamber between the Laval nozzle and the skimmer acts as a differential pumping stage. Pumping in this chamber was ensured by a roots pump backed up by a rotary pump.
After passing through the skimmer, REMPI spectroscopy is performed on neutral species of the combustion process. In this study, REMPI was performed with a unique laser using (1+1) photon process. By ensuring that the energy of the photons is below the molecule’s ionization threshold, the ionization of molecules can only originate from an excited state and therefore by the absorption of the first photon. Consequently, absorption cross sections of electronic transitions are directly involved in the ionization rate of the molecules. According to Boesl & Zimmermann (2021), for a low laser flux, the volume density of ions n+ (in cm−3) produced by the REMPI process can be estimated using the following expression:
 (2)
(2)
with σelec and σioni (in cm2) corresponding to the absorption cross sections for electronic excitation and molecule ionization from the electronic excited state, respectively; F (in s−1 cm−2) as the laser photon flux; τpulse (in s) as the laser pulse duration; and n0 (in cm−3) as the volume density of neutrals in the ground electronic state.
Compared to classical absorption spectroscopy, REMPI spectroscopy presents two major advantages. On one hand, charged molecules formed by this technique can be detected with a high efficiency thanks to microchannel plate (MCP) detectors. Therefore, species formed at very low concentration within the flame can be detected. On the other hand, charged species can be mass selected. As a wide diversity of species is produced by the combustion process, selective detection through mass is mandatory in order to retrieve information on the structure of the resonant molecule.
In this REMPI study, we used an optical parametric oscillator (OPO) pumped by the third harmonic of a Nd:YAG laser (Opolette, Opotek). The signal laser beam from the OPO laser cavity was frequency doubled and allowed for fast tunability over the 214–285 nm range with a typical laser energy per pulse between 20 and 200 µJ. In this study, the spectral step is 0.1 nm. Careful characterization of the OPO laser was performed. The error in wavelength was estimated through laser calibration and by comparing the measured spectral profiles of several small species issued from the flame (benzene, toluene, phenol, pheny-lacetylene, naphthalene) to measurements in the literature. The uncertainty in wavelength calibration was estimated to be on the order of the laser step: 0.1 nm. The laser fluence F τpulse is strongly dependent on the laser wavelength, and ion signal variations rely on the laser stability according to Eq. (2). To correct for these potential fluctuations, a reflection of the laser beam from the entrance window of the experimental setup was used to monitor its variation. A dye laser cell (Rhodamine 6G, 1.25 mg l−1 in ethanol 96%) was placed in the path of the laser beam reflection, and the fluorescence of the dye was recorded by a photodiode. With this system, the laser beam flux was measured at each wavelength, and the inherent variations of the laser photon flux during the laser scan could be corrected.
Neutral flame products were ionized through the REMPI process within an extraction chamber of a ToF-MS that we made ourselves. One major advantage of ToF mass spectrometry is the detection of all resonant species from a single laser pulse. Our ToF-MS is in Wiley-McLaren configuration (Wiley & McLaren 1955). The typical kinetic energy acquired by molecules from the electrostatic potential of extraction electrodes is around 4.8 keV. With a distance of two meters between the extraction electrodes and MCP detector, the mass resolution R is R = M/ΔM ≈ 550. The MCP detector is composed of two MCPs placed in a chevron configuration. The electronic signal output is amplified with a gain of G = ×100. The analog electric signal is digitized by an acquisition card with 10 bit channel entries and 4 GigaSamples s−1, the maximum sampling rate.
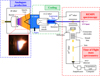 |
Fig. 1 Nanograins experimental setup. This setup can be divided into three main parts: carbonaceous analog production, cooling by supersonic expansion, and REMPI spectroscopy coupled with ToF-MS. |
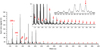 |
Fig. 2 Sum of all mass spectra recorded over the range 214–285 nm. The main mass distribution discussed in the text is highlighted with red arrows and shows a noticeable progression of +14 u. |
3 Results
The mass spectrum of the total ions signal resulting from the REMPI scans with the OPO laser is shown in Fig. 2, and it is the sum of all individual mass spectrum measured at each wavelength step. Each individual mass spectrum is the average of 1100 laser shots. The sum of the mass spectra shows all the species ionized during the laser scan. The main mass signals of this mass spectrum are characteristic of aromatic molecules produced by the flame, such as benzene (78 u), toluene (92 u), or pyrene (202 u). These molecules, and tens of others, were identified through their REMPI spectra but are not discussed in this article. Most were found to be similar to those of our previous study (Carpentier et al. 2013).
In this work, we focus on the specific mass distribution highlighted in Fig. 2. This distribution presents a recognizable pattern at high masses above 290 u, and most importantly, all species in this distribution present a similar electronic band profile around 220 nm (see Fig. 3). Mass signals that exhibit this common electronic band profile are listed in Table 1. The recognizable mass pattern at large masses with a +14 u progression starts at mass 128 u (no mass signal is observable at mass 114 u).
In Fig. 4, the REMPI spectrum recorded for mass 128 u is compared to the room temperature absorption spectrum of the gas-phase naphthalene molecule. A very good correspondence was obtained between the recorded REMPI spectrum and the vibronic structures of naphthalene. This allowed for a reliable assignment of naphthalene to the 128 u mass signal. According to Salama & Allamandola (1991), vibronic profiles observed in the 245–285 nm domain were assigned to the S2 ← S0 electronic transition, and band profiles observed in the 214–230 nm range were assigned to the S3 ← S0 one. We note that for the S3 ← S0 transition, the maximum of this band lies outside our laser range, and only the beginning of the transition on the low energy side is visible in Fig. 4. According to Grosch et al. (2015), the maximum of the transition falls at 210.7 nm, and they measured a cross section at the band maximum of 5.10−16 cm2, which is 13 times higher than the maximum cross section of the 222 nm spectral feature visible in Fig. 4.
We next focus on the second and third mass signals at 142 u and 156 u. Individual REMPI spectra of these molecules in the 214–230 nm spectral domain are shown in Fig. 5. In the figure, these REMPI spectra are compared with the gas-phase absorption cross sections of two molecules at room temperature: 1-methylnaphthalene C10H7-CH3 (142 u) and 2-ethylnaphthalene C10H7-CH2CH3 (156 u). The S3 ← S0 electronic transitions of these molecules possess band positions similar to the ones observed in the REMPI spectra. However, this transition does not present enough vibronic structure to firmly confirm the assignment, and the S2 ← S0 transitions for these molecules are not observable in our REMPI spectra probably due to a lower concentration from the flame. Moreover, the band profiles observed in REMPI spectra do not match absorption profiles from the literature, especially for mass 156 u. We note that the REMPI spectrum of mass signal 156 u was compared only to one molecule, 2-ethylnaphthalene, but ToF mass spectrometry cannot distinguish isomers. By counting the possible dimethyl-naphthalene and ethylnaphthalene isomers, 12 isomers may be produced by the combustion process and therefore could contribute to the REMPI spectrum corresponding to the mass signal at 156 u. As far as we know, in the 200–250 nm spectral domain, no gas-phase absorption data are available in the literature for these other naphthalene derivatives. Despite this, from comparison of the observed electronic band and their masses, the assignment of these two REMPI profiles to naphthalene derivatives is meaningful.
Mass signal 128 u was safely assigned to the naphthalene molecule, and mass signals 142 u and 156 u have a meaningful assignment to the naphthalene methyl- and ethyl-substituted derivatives. Moreover, the progression of 14 u highlighted in Fig. 2 can be explained by successive substitutions of an H atom by a CH3 functional group. These results led us to assign the observed main mass distribution as coming from naphthalene derivatives with increasing aliphatic carbon substitution. An example of such a structure for mass 240 u is presented in Fig. 6.
Only the main distribution has been considered thus far in the paper, and we now address the side mass signals listed in Table 1. A zoom in on the side mass pattern around mass 310 u is displayed in Fig. 2. This pattern is observable for most masses from the main distribution and is easily recognizable at large masses where contribution from other flame species is low. This side mass pattern shows several characteristics: (i) dominant signals for side masses are visible only for even numbered atomic mass units; (ii) for a given pattern, the mass of the main distribution (shown as red arrows in Fig. 2) always corresponds to the largest mass signal that exhibits the common electronic band profile (see Fig. 7); (iii) side signals are not observable for small masses of the main distribution, and the contribution of side masses increases with the mass of the molecules (see Table 1). The above points can be explained by an increase in the presence of double covalent bonds within the large aliphatic carbon substitution. By replacing a single covalent bond with a double bond in the aliphatic structure, two hydrogens are lost from the parent structure, which corresponds to the loss of the even number of 2 u with respect to the main distribution. Assuming a progressive emergence of the double covalent bond with molecular mass, the observation of the side mass signal patterns is also consistent with the assignment of large aliphatic naphthalene derivatives.
Several points would need to be further explored in order to definitively validate the proposed assignments. First, mass distribution assignment to naphthalene derivatives needs to be further confirmed. In order to do this, one can focus on the REMPI electronic spectrum of mass 240 u in Fig. 3. In the figure, the band structures observed at long wavelengths above 230 nm are assigned to PAH isomers, such as olympicene C19H12. However, the band profile around 220 nm for mass signal 240 u is assigned to naphthalene derivative molecules C18H24, similar to the example in Fig. 6. To confirm these assignments, mass resolution of our homemade ToF-MS needs to be increased to measure the mass difference expected between one carbon atom and 12 hydrogen atoms, which exist between large PAHs and naphthalene derivative isomers for the mass signal 240 u. A mass resolution of R = M/ΔM > 2550 is required to visualize the mass difference at mass M = 240 u. In addition, part of the recorded electronic band profile is missing since our laser system did not allow us to go to wavelengths below 214 nm. Larger photon energy laser sources would need to be implemented. Another way to study the missing part could be to measure the far UV absorption spectrum of similar naphthalene derivatives deposited on a substrate in the solid phase.
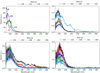 |
Fig. 3 REMPI spectra associated with the main mass distribution (red arrows in Fig. 2). A similar band profile close to 220 nm can be observed, except for light masses 128, 142, and 156 u. Band structures at wavelengths ⪆230 nm observed for masses 226, 240, and 254 u were assigned to PAH molecule isomers also produced by the flame. |
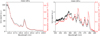 |
Fig. 4 REMPI spectrum of mass 128 u (black curve) compared to the absorption spectrum of naphthalene C10H8 at 297 K from Grosch et al. (2015, red curve). |
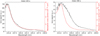 |
Fig. 5 REMPI spectra (in black) compared to gas-phase absorption spectra reproduced from Suto et al. (1992, in red). Left panel: mass signal 142 u compared to 1-methylnaphthalene C10H7-CH3. Right panel: mass signal 156 u compared to 2-ethylnaphthalene C10H7-CH2CH3. |
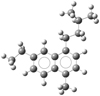 |
Fig. 6 Example of naphthalene derivative C18H24 with a large aliphatic carbon substitution for mass signal 240 u. |
4 Discussion and astrophysical implication
In Fig. 8, the mean REMPI spectrum of naphthalene derivatives is compared to a parameterized ISM mean extinction curve (details on the mean REMPI spectrum are given hereafter). The parameterized curve used is the one proposed for the normalized extinction curve in Fitzpatrick & Massa (2007):
 (3)
(3)
with
 (4)
(4)
where E(λ − V) is the difference in extinction between wavelength λ and the visible band V (λ ≈ 550 nm) is considered as a reference wavelength. This extinction was normalized using the difference between blue (B; λ ≈ 440 nm) and visible (V) extinctions, with the goal being to normalize the extinction with the same column density of matter. The term x represents the wave number (µm−1); c1 = −0.175 and c2 = 0.807 µm are the coefficients for the linear extinction part, c3 = 2.991 µm−2; and D(x, x0,γ) is a Lorentzian-like function representing the interstellar bump with a central position value x0 = 4.592 µm−1 and width γ = 0.922 µm−1. When x = x0, the peak height of D(x, x0,γ) is equal to 1/γ2. A mean REMPI spectrum 〈Sm〉(x) including 39 naphthalene derivatives measured experimentally was built using the following equation:
 (5)
(5)
where N = 39 is the number of species in the distribution of Table 1 with a mass strictly greater than mass 184 u. In this expression, each REMPI profile Sm(x) is normalized in order to get rid of the density variations of the species due to the combustion process. We note that through such normalization, absorption cross sections of the different species are assumed to be all equal at their maximum REMPI signal. A model extinction curve including the mean REMPI spectrum was built using the same approach as in Eq. (3):
 (6)
(6)
where the linear part of the interstellar extinction, which is treated independently of the bump, is added and the mean REMPI profile 〈Sm〉(x) is scaled to the bump height c3/γ2.
Assuming a symmetric band profile for the missing data at large wave numbers in Fig. 8, the mean REMPI spectrum possesses a central position at 4.52 µm−1 (221 nm), and an FWHM around 0.35 µm−1 (17 nm). With a typical position of 4.5903 µm−1 (217.85 nm) and an FWHM ranging from 0.7 µm−1 (33 nm) to 1.3 µm−1 (63 nm) for the interstellar bump (Fitzpatrick & Massa 2007), we observed a large difference in FWHM and a slight redshift of 3.5 nm. Therefore, the absorptions of the large naphthalene derivatives do not perfectly match the whole ISM UV bump feature. However, as the mean REMPI spectrum has a narrower FWHM and is close to the position of the interstellar bump, we propose a contribution originating from such species.
As mentioned previously, the recorded electronic spectra are at ambient temperature according to the naphthalene REMPI spectrum in Fig. 4. Carriers within the diffuse ISM are expected to be at temperatures well below 100 K. However, three arguments can be made to show that this temperature difference probably does not call into question the possible contribution of this type of species to the bump signature. First, the observed electronic band is assigned to a transition from the fundamental to the third electronic state, which involves electron promotion within the π aromatic orbitals. Large coupling with the vibronic structure manifold of lower electronic states can be expected and would result in a broadening of molecular transitions, even at low temperature. Moreover, the electronic spectra displayed in Fig. 3 are the contributions of many naphthalene derivative isomers, each one participating with their individual broad vibronic structures. A large smoothing can be expected for the resulting spectrum, as thousands of isomers can contribute to the proposed carriers. The last question concerns the position of the S3 ← S0 electronic band at the ISM low temperature. As far as we know, no gas-phase spectrum of the S3 ← S0 transition in naphthalene molecules below 100 K is available in the literature. However, temperature dependence of naphthalene electronic band profiles was studied by Grosch et al. (2015) in the 297–773 K range. They found, for the S3 ← S0 transition, a shift of the maximum band absorption from 210.7 nm at 297 K to 212.6 nm at 773 K. Assuming the same trend occurs at a low temperature for the derivatives, the observed electronic profile in Fig. 3 would be slightly blueshifted (i.e., closer to the bump signature position).
The naphthalene derivatives with large aliphatic substitution detected in this experiment are not likely to be the bump carrier candidates, considering their poor photostability in the ISM. According to Allain et al. (1996) and Montillaud et al. (2013), only carbonaceous molecules with more than about 50 carbon atoms can sustain the harsh UV interstellar radiation field. There should be a similar minimum size threshold for these highly substituted naphthalene molecules. However, the major finding related to these new results is emphasized in Fig. 9. In this figure, the peak absorptions of the electronic bands are estimated as the maximum of each REMPI spectrum after smoothing. Each point of the smoothing is the average calculated over a filter window of 3 nm (Savitzky–Golay filter, 0th order polynomial, 31 experimental points window). In Fig. 9, for naphthalene derivatives with a large mass, the position of the electronic band appears to reach an asymptote and is therefore almost constant regardless of size. Extrapolating to an even larger molecular size, the considered electronic band should remain close to the current position value (220 nm) for intermediate species whose sizes are of a few nanometers. These intermediate species could be sketched as two aromatic rings embedded within a highly aliphatic structure, as illustrated in Fig. 10.
This kind of carbonaceous dust particle is similar to what was proposed as a carrier of the 3.4 µm absorption feature observed toward diffuse interstellar clouds (Sandford et al. 1991; Dartois et al. 2004, 2007; Godard et al. 2011). The results of the present work also support previous works that highlight the probable role of two aromatic rings in the observation of the interstellar bump. Beegle et al. (1997) emphasized the role of the double aromatic ring structure as a chromophore that gives rise to a 217.5 nm feature. Later, Duley & Hu (2012) observed a band centered at a position similar to that of the UV bump from synthesized HAC, with naphthalene derivatives suggested as an important constituent. The deposited film samples, studied in both references, are good analogs of the solid particulate phase. In our work, we are investigating at the molecular scale, and our major finding is the identification of two aromatic rings as a chemical substructure that exhibits a band position independent of the species size and is close to the interstellar bump.
As such two aromatic ring substructures (2ARS) are likely to be present in HACs of the ISM and have an electronic band around 220 nm with a smaller FWHM than the bump, we therefore propose that the 2ARS contribute to the bump. In order to evaluate the contribution of these 2ARS, we first estimated their absorption cross section and then determined the column density  of the C atoms in these substructures required to reproduce the bump signature. As we do not have the absolute values of the absorption cross sections of our naphthalene derivatives in Fig. 3, we adopted the maximum absorption cross section of the S3 ← S0 transition in the bare naphthalene molecule with a value of σnaph = 500.10−18 cm2/molecule from Grosch et al. (2015). To compare σnaph for the full width of the bump, the value of the total absorption of the S3 ← S0 transition in naphthalene was preserved, but we reshaped the absorption profile of naphthalene in order to match the bump profile. This resulted in a diminution of the peak absorption cross section (see Appendix B for more details). The total absorption band ratio
  between the normalized profiles of the bump and of the S3 ← S0 transition in naphthalene was estimated to be six (estimation of
  in Appendix B). This ratio was used to estimate the absorption cross section σ2ars at 220 nm as follows:
 (7)
(7)
with 𝒩C = 10 being the number of C atoms in the naphthalene C10H8 molecule and in the 2ARS. We found this value for  to be very close to the 8 × 10⁻¹⁸ cm2/C atom value adopted in Li & Draine (2001) for a PAHs mixture.
From this estimation of the absorption cross section, we determined the column density of C atoms  (in cm−2) locked in the substructures using the following equation (see Appendix A for details on its derivation):
 (8)
(8)
where NH (in cm−2) is the column density of H atoms and c3/γ2 = 3.52 is the height of the bump in the mean normalized extinction curve (see Eqs. (3) and (6)). The total cosmic carbon abundance  (carbon in both interstellar gas and solid phases compared to hydrogen) has been estimated as being between 225 ± 50 ppm (Snow & Witt 1995) and 358 ± 82 ppm (Sofia & Meyer 2001). Considering that the full bump feature area is produced by two aromatic rings, the cosmic C fraction
  that could be locked in these species is
  . The value obtained for
  is in agreement with the cosmic abundances of carbon. Keeping in mind that the two-ring structure is a substructure of HACs, a significant fraction of the carbonaceous material of HACs must be involved. However, this result can be considered an upper limit, as it corresponds to the contribution to the full bump feature and thus remains compatible with the cosmic abundance of carbon.
Moreover, as mentioned before, 2ARS in HACs are proposed only as a partial contributor to the bump. To estimate  as a partial contributor, we assumed the absorption band profile of 2ARS to be the same as the mean REMPI spectrum in Fig. 8. As above in the text, the S3 ← S0 transition in naphthalene was compared to the mean REMPI spectrum in order to estimate σ2ARS (see Appendix B). Because the FWHM of the mean REMPI spectrum (0.35 µm−1) is smaller than the UV bump FWHM, the S3 ← S0 transition of naphthalene contributes to a smaller spectral range. The total absorption band ratio
  between the mean REMPI profile in Fig. 8 and the naphthalene S3 ← S0 transition was estimated to be 1.6 (estimation of
  in Appendix B). Using Eqs. (7) and (8), we recalculated σ2ARS,
  , and
, and  , and their values are summarized in Table 2. Only a carbon fraction
  is needed to reproduce the bump height when referring to the experimental REMPI profiles. According to Furton et al. (1999), the abundance of interstellar HACs is
  . Hydrogenated amorphous carbons with 22% of their carbon in double aromatic ring substructures, which corresponds to two isolated 2ARS in a matrix of 80 aliphatic carbons, are thus sufficient to reproduce the bump height. According to Jones (1990), HACs in the ISM are likely to contain a significant fraction of aromatic species within the amorphous matrix. The contribution of 2ARS in HACs to the bump feature could therefore be important and should be considered in UV absorption dust models.
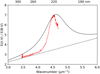 |
Fig. 8 Parameterization of observed ISM mean extinction proposed by Fitzpatrick & Massa (2007, according to Eq. (3), in black) compared to the mean spectrum of naphthalene derivatives 〈Sm〉 (according to Eq. (6), in red). The dashed line represents the linear part of the extinction. |
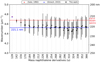 |
Fig. 9 Scatter plots giving the locations of the peak absorption of the REMPI band profiles as a function of the mass of the naphthalene derivatives listed in Table 1. The blue straight line at 221.1 nm is the mean value of the peak absorption for masses strictly higher than 184 u. The red dashed line represents the shortest wavelength that can be achieved by the OPO laser. The black bars represent the estimated FWHM for each band profile. A Gaussian function with the least squares method has been fit to each individual REMPI spectrum in order to estimate the FWHM (we note that the FWHM of the bands are not discussed in the text). |
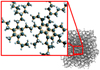 |
Fig. 10 Aromatics isolated within a highly aliphatic structure proposed as a bump contributor. |
Estimates of the contribution of 2ARS as a total and a partial contributor to the bump feature.
5 Conclusion
Large carbonaceous molecules were produced by a combustion process stabilized at low pressure (40 mbar) in a rich laboratory flame. Extracted free-flying species were analyzed by mass spectrometry and REMPI spectroscopy. We observed a mass distribution of species exhibiting a common electronic band profile that peaks around 220 nm. The mass spectrum of this distribution is characterized by a specific pattern separated by 14 u steps. This pattern starts at mass 128 u and was measured only up to mass 394 u due to the sensitivity of our experimental setup, so the pattern may continue beyond this limit. From the recorded REMPI spectra, the mass 128 u was assigned to the naphthalene C10H8 molecule, and the assignments of masses 142 u and 156 u are consistent with naphthalene derivative isomers, including methyl and ethyl functional groups such as methylnaphthalene C10H7–CH3, dimethylnaphthalene C10H7–(CH3)2, and ethyl-naphthalene C10H7 –CH2CH3, respectively. We assigned the observed mass progression pattern of +14 u to the successive substitution of an H atom by a CH3 functional group. Based on this analysis, we conclude that the observed pattern corresponds to aliphatic derivatives of naphthalene.
More interestingly, the mass pattern identified for these derivatives exhibit a common electronic band profile. The peak absorption wavelength of this band profile becomes progressively independent of the species size and asymptotically converges toward a position close to that of the interstellar bump signature. The mean REMPI spectrum of the large aliphatic naphthalene derivatives could contribute to the interstellar bump extinction curve, as it is close to the interstellar bump signature, with a red-shifted band center of only 3.5 nm and a FWHM two to four times thinner. While the molecular species observed in these experimental results are unlikely to survive in DISM environments, because of their moderate size, these structural units could survive within large molecular systems or within HAC particles. Based on a quantitative estimate using the absorption cross section of naphthalene, we calculate that a few percentage points of the cosmic carbon abundance in double aromatic rings substructures isolated in a highly aliphatic structure (Fig. 10) can significantly contribute to the bump. These results suggest that this type of molecular structure warrants further study in order to provide a better understanding of the composition of the carbonaceous material in the ISM.
Acknowledgements
This work was supported by the Centre National de la Recherche Scientifique, CNRS, by the Agence Nationale de la Recherche (ANR-16-CE29-0025) and by ISMO technical services.
Appendix A Formula derivation of the column density 
In the approximation of the bump height due only to two aromatic ring substructures (2ARS), the total extinction coefficient  at λ = 217.5 nm is expressed as the sum of the extinction coefficients related to 2ARS,
  , and to the linear part of the extinction,
  :
:
 (A.1)
(A.1)
 (A.2)
(A.2)
 (A.3)
(A.3)
 (A.4)
(A.4)
where  is the parameterization used in Fitzpatrick & Massa (2007) and in Figs. 8 and B.1; E(B – V) = AB – AV is the color excess between blue (B, centered around 440 nm) and visible (V, centered around 550 nm) extinctions; and
  is the height of the bump extinction curve at λ = 217.5 nm (see equations 3 and 6). We can get rid of the color excess E(B – V) by replacing it with the column density of H atoms NH using the following empirical relationship:
 (A.5)
(A.5)
The extinction due to light absorption  is also expressed through the optical depth τ2ars and the Beer-Lambert law (Draine (2010), equation 21.1):
 (A.6)
(A.6)
where I0 is the initial photon flux and I is the remaining flux at λ = 217.5 nm. Therefore, the absorption cross section σ2ARS (in cm2) at λ = 217.5 nm of the S3 ← S0 transition in 2ARS can be inserted:
 (A.7)
(A.7)
 (A.8)
(A.8)
 (A.9)
(A.9)
with  as the column density of the 2ARS (in cm−2),
  as the column density of C atoms in 2AR (in cm−2), and 𝒩C = 10 as the number of C atoms in each 2ARS. Using the equality between the equations A.4 and A.9 and by using equation A.5, we obtain the following relationship:
 (A.10)
Equation 8 is obtained simply by rearranging the different terms.
Appendix B Estimation of σ2ARS using σnaph and the total absorption ratio R𝒜
In this appendix, the method used to estimate the maximum of the absorption cross section σ2ARS from the absorption cross section σnaph is described. First, in Fig. B.1, the profile of the absorption cross section of naphthalene σnaph is normalized to the bump height. From equations A.4 and A.8, a linear dependence is found between the height of the bump extinction c3/γ2 and the absorption cross section σ:
 (B.1)
(B.1)
with Nnaph as the column density of the naphthalene molecules. Normalizing σnaph to the height of the bump c3/γ2 is equivalent to fixing Nnaph to a constant value in order to obtain an optical depth Nnaphσnaph matching the bump height.
In the case of a bump due only to light absorption by the 2ARS (first row of Table 2), we assumed that the 2ARS absorption profile is exactly the same as the bump signature. Also, for a given density column Nnaph = constant = N2ARS, we assumed that the total absorption of the 2ARS, 𝒜2ARS, is equal to the total absorption of the S3 ← S0 transition in naphthalene 𝒜naph. As can be observed in Fig. B, the peak absorption of the 2ARS is smaller than the peak absorption of naphthalene. As the bump and naphthalene curves are normalized to each other, the difference between the maximum absorption cross section of the naphthalene,  , and of the 2ARS,
  , is shown to be directly related to the ratio of the areas
  between the bump profile and the naphthalene absorption profile:
 (B.2)
(B.2)
This approach is also used in the case of a partial contribution of the 2ARS to the bump signature (second row of Table 2 and Fig. B). However, the assumed absorption profile of the 2ARS is no longer the bump profile but the mean REMPI profile 〈Sm〉 from equation 5. Since the profile 〈Sm〉 is narrower than the bump profile, the decrease in the maximum of the absorption cross section  is smaller. In Fig. B, a Gaussian function is fitted to the mean REMPI profile and is used to define the absorption profile σ2ARS of the 2ARS.
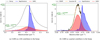 |
Fig. B.1 Determination of the absorption profile σ2ars for the two cases of 2ARS contribution (red curve in both figures). In both figures, the blue curve is the normalized absorption cross section of naphthalene σnaph (Grosch et al. 2015). The blue dotted line is a linear extrapolation of the naphthalene cross section for a large wave number. In both figures, the red and blue areas are the total absorption of the 2ARS profile 𝒜2ars and of the S3 ← S0 transition of naphthalene 𝒜naph, respectively. These areas are defined to be equal. In panel (a), the black curve is the interstellar bump parametrization from Fitzpatrick & Massa (2007) (see equation 3). In panel (b), the black curve is the mean REMPI spectrum 〈Sm〉 defined in equation 5. Also in panel (b), the yellow dashed line is a Gaussian function A exp |

Parameters deduced from Fig. B.1 and values of R𝒜 used in equation 7. The value of the interstellar ump area is the one proposed in Fitzpatrick & Massa (2007).
References
- Allain, T., Leach, S., & Sedlmayr, E. 1996, A&A, 305, 602 [NASA ADS] [Google Scholar]
- Allamandola, L., Tielens, A., & Barker, J. 1989, ApJS, 71, 733 [NASA ADS] [CrossRef] [Google Scholar]
- Apicella, B., Carpentieri, A., Alfè, M., et al. 2007, Proc. Combust. Inst., 31, 547 [CrossRef] [Google Scholar]
- Beegle, L. W., Wdowiak, T. J., Robinson, M. S., et al. 1997, ApJ, 487, 976 [NASA ADS] [CrossRef] [Google Scholar]
- Bockhorn, H. 1994, in Soot Formation in Combustion (Berlin: Springer), 3 [CrossRef] [Google Scholar]
- Boesl, U., & Zimmermann, R. 2021, Photoionization and Photo-Induced Processes in Mass Spectrometry: Fundamentals and Applications (Hoboken: Wiley), 23 [CrossRef] [Google Scholar]
- Bohlin, R. C., Savage, B. D., & Drake, J. 1978, ApJ, 224, 132 [NASA ADS] [CrossRef] [Google Scholar]
- Burkhardt, A. M., Lee, K. L. K., Changala, P. B., et al. 2021, ApJ, 913, L18 [Google Scholar]
- Campbell, E. K., Holz, M., Gerlich, D., & Maier, J. P. 2015, Nature, 523, 322 [NASA ADS] [CrossRef] [Google Scholar]
- Carpentier, Y., Pino, T., & Bréchignac, P. 2013, J. Phys. Chem. A, 117, 10092 [NASA ADS] [CrossRef] [Google Scholar]
- Cecchi-Pestellini, C., Malloci, G., Mulas, G., Joblin, C., & Williams, D. 2008, A&A, 486, L25 [NASA ADS] [CrossRef] [EDP Sciences] [Google Scholar]
- Cernicharo, J., Agúndez, M., Cabezas, C., et al. 2021, A&A, 649, L15 [EDP Sciences] [Google Scholar]
- Chhowalla, M., Wang, H., Sano, N., et al. 2003, Phys. Rev. Lett., 90, 155504 [NASA ADS] [CrossRef] [Google Scholar]
- Colangeli, L., Mennella, V., Palumbo, P., Rotundi, A., & Bussoletti, E. 1995, A&AS, 113, 561 [NASA ADS] [Google Scholar]
- Dartois, E., Caro, G. M., Deboffle, D., & d’Hendecourt, L. 2004, A&A, 423, L33 [NASA ADS] [CrossRef] [EDP Sciences] [Google Scholar]
- Dartois, E., Geballe, T., Pino, T., et al. 2007, A&A, 463, 635 [NASA ADS] [CrossRef] [EDP Sciences] [Google Scholar]
- Draine, B. T. 2010, Physics of the Interstellar and Intergalactic Medium (Princeton: Princeton University Press), 19 [Google Scholar]
- Draine, B., & Lee, H. M. 1984, ApJ, 285, 89 [NASA ADS] [CrossRef] [Google Scholar]
- Dubosq, C., Calvo, F., Rapacioli, M., et al. 2020, A&A, 634, A62 [Google Scholar]
- Duley, W., & Hu, A. 2012, ApJ, 761, 115 [NASA ADS] [CrossRef] [Google Scholar]
- Duley, W., & Williams, D. 1983, MNRAS, 205, 67 [Google Scholar]
- Faccinetto, A., Desgroux, P., Ziskind, M., Therssen, E., & Focsa, C. 2011, Combust. Flame, 158, 227 [CrossRef] [Google Scholar]
- Fitzpatrick, E., & Massa, D. 1986, ApJ, 307, 286 [NASA ADS] [CrossRef] [Google Scholar]
- Fitzpatrick, E., & Massa, D. 2007, ApJ, 663, 320 [NASA ADS] [CrossRef] [Google Scholar]
- Furton, D. G., Laiho, J. W., & Witt, A. N. 1999, ApJ, 526, 752 [CrossRef] [Google Scholar]
- Gadallah, K., Mutschke, H., & Jäger, C. 2011, A&A, 528, A56 [Google Scholar]
- Gavilan, L., Alata, I., Le, K., et al. 2016, A&A, 586, A106 [NASA ADS] [CrossRef] [EDP Sciences] [Google Scholar]
- Gavilan, L., Le, K. C., Pino, T., et al. 2017, A&A, 607, A73 [Google Scholar]
- Godard, M., Féraud, G., Chabot, M., et al. 2011, A&A, 529, A146 [NASA ADS] [CrossRef] [EDP Sciences] [Google Scholar]
- Grosch, H., Sárossy, Z., Egsgaard, H., & Fateev, A. 2015, J. Quant. Spectrosc. Radiat. Transf., 156, 17 [NASA ADS] [CrossRef] [Google Scholar]
- Happold, J., Grotheer, H.-H., & Aigner, M. 2007, Rapid Communications in Mass Spectrometry: an International Journal Devoted to the Rapid Dissemination of Up-to-the-Minute Research in Mass Spectrometry (Hoboken: Wiley), 21, 1247 [Google Scholar]
- Henrard, L., Lambin, P., & Lucas, A. 1997, ApJ, 487, 719 [NASA ADS] [CrossRef] [Google Scholar]
- Jäger, C., Mutschke, H., Henning, T., & Huisken, F. 2008, ApJ, 689, 249 [CrossRef] [Google Scholar]
- Joblin, C., Léger, A., & Martin, P. 1992, ApJ, 393, L79 [NASA ADS] [CrossRef] [Google Scholar]
- Jochims, H., Ruhl, E., Baumgartel, H., Tobita, S., & Leach, S. 1994, ApJ, 420, 307 [Google Scholar]
- Jones, A. 1990, MNRAS, 247, 305 [NASA ADS] [Google Scholar]
- Leger, A., & Puget, J. 1984, A&A, 137, L5 [NASA ADS] [Google Scholar]
- Li, A., & Draine, B. 2001, ApJ, 554, 778 [NASA ADS] [CrossRef] [Google Scholar]
- Li, A., Chen, J., Li, M., Shi, Q., & Wang, Y. 2008, MNRAS, 390, L39 [NASA ADS] [CrossRef] [Google Scholar]
- Martin, J. W., Salamanca, M., & Kraft, M. 2022, Prog. Energy Combust. Sci., 88, 100956 [CrossRef] [Google Scholar]
- McGuire, B. A., Loomis, R. A., Burkhardt, A. M., et al. 2021, Science, 371, 1265 [Google Scholar]
- Mennella, V., Colangeli, L., Palumbo, P., et al. 1996, ApJ, 464, L191 [NASA ADS] [CrossRef] [Google Scholar]
- Montillaud, J., Joblin, C., & Toublanc, D. 2013, A&A, 552, A15 [NASA ADS] [CrossRef] [EDP Sciences] [Google Scholar]
- Pendleton, Y. J., & Allamandola, L. J. 2002, ApJS, 138, 75 [NASA ADS] [CrossRef] [Google Scholar]
- Sakata, A., Wada, S., Tokunaga, A. T., et al. 1994, ApJ, 430, 311 [NASA ADS] [CrossRef] [Google Scholar]
- Salama, F., & Allamandola, L. J. 1991, J. Chem. Phys., 94, 6964 [NASA ADS] [CrossRef] [Google Scholar]
- Sandford, S. A., Allamandola, L. J., Tielens, A. G. G. M., et al. 1991, ApJ, 371, 607 [NASA ADS] [CrossRef] [Google Scholar]
- Schnaiter, M., Mutschke, H., Dorschner, J., Henning, T., & Salama, F. 1998, ApJ, 498, 486 [NASA ADS] [CrossRef] [Google Scholar]
- Snow, T. P., & Witt, A. N. 1995, Science, 270, 1455 [CrossRef] [Google Scholar]
- Sofia, U. J., & Meyer, D. M. 2001, ApJ, 554, L221 [Google Scholar]
- Sofia, U. J., Wolff, M. J., Rachford, B., et al. 2005, ApJ, 625, 167 [NASA ADS] [CrossRef] [Google Scholar]
- Stecher, T. P., & Donn, B. 1965, ApJ, 142, 1681 [NASA ADS] [CrossRef] [Google Scholar]
- Steglich, M., Jäger, C., Rouillé, G., et al. 2010, ApJ, 712, L16 [NASA ADS] [CrossRef] [Google Scholar]
- Suto, M., Wang, X., Shan, J., & Lee, L. 1992, J. Quant. Spectrosc. Radiat. Transf., 48, 79 [NASA ADS] [CrossRef] [Google Scholar]
- Tielens, A. 2008, ARA&A, 46, 289 [Google Scholar]
- Tomita, S., Fujii, M., & Hayashi, S. 2002, Phys. Rev. B, 66, 245424 [NASA ADS] [CrossRef] [Google Scholar]
- Walker, G. A. H., Bohlender, D. A., Maier, J. P., & Campbell, E. K. 2015, ApJ, 812, L8 [NASA ADS] [CrossRef] [Google Scholar]
- Wiley, W. C., & McLaren, I. H. 1955, Rev. Sci. Instrum., 26, 1150 [NASA ADS] [CrossRef] [Google Scholar]
All Tables
Estimates of the contribution of 2ARS as a total and a partial contributor to the bump feature.
Parameters deduced from Fig. B.1 and values of R𝒜 used in equation 7. The value of the interstellar ump area is the one proposed in Fitzpatrick & Massa (2007).
All Figures
|
Fig. 1 Nanograins experimental setup. This setup can be divided into three main parts: carbonaceous analog production, cooling by supersonic expansion, and REMPI spectroscopy coupled with ToF-MS. |
| In the text | |
|
Fig. 2 Sum of all mass spectra recorded over the range 214–285 nm. The main mass distribution discussed in the text is highlighted with red arrows and shows a noticeable progression of +14 u. |
| In the text | |
|
Fig. 3 REMPI spectra associated with the main mass distribution (red arrows in Fig. 2). A similar band profile close to 220 nm can be observed, except for light masses 128, 142, and 156 u. Band structures at wavelengths ⪆230 nm observed for masses 226, 240, and 254 u were assigned to PAH molecule isomers also produced by the flame. |
| In the text | |
|
Fig. 4 REMPI spectrum of mass 128 u (black curve) compared to the absorption spectrum of naphthalene C10H8 at 297 K from Grosch et al. (2015, red curve). |
| In the text | |
|
Fig. 5 REMPI spectra (in black) compared to gas-phase absorption spectra reproduced from Suto et al. (1992, in red). Left panel: mass signal 142 u compared to 1-methylnaphthalene C10H7-CH3. Right panel: mass signal 156 u compared to 2-ethylnaphthalene C10H7-CH2CH3. |
| In the text | |
|
Fig. 6 Example of naphthalene derivative C18H24 with a large aliphatic carbon substitution for mass signal 240 u. |
| In the text | |
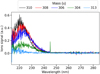 |
Fig. 7 REMPI spectra of side mass pattern of the main mass 310 u (see zoom in presented in Fig. 2). |
| In the text | |
|
Fig. 8 Parameterization of observed ISM mean extinction proposed by Fitzpatrick & Massa (2007, according to Eq. (3), in black) compared to the mean spectrum of naphthalene derivatives 〈Sm〉 (according to Eq. (6), in red). The dashed line represents the linear part of the extinction. |
| In the text | |
|
Fig. 9 Scatter plots giving the locations of the peak absorption of the REMPI band profiles as a function of the mass of the naphthalene derivatives listed in Table 1. The blue straight line at 221.1 nm is the mean value of the peak absorption for masses strictly higher than 184 u. The red dashed line represents the shortest wavelength that can be achieved by the OPO laser. The black bars represent the estimated FWHM for each band profile. A Gaussian function with the least squares method has been fit to each individual REMPI spectrum in order to estimate the FWHM (we note that the FWHM of the bands are not discussed in the text). |
| In the text | |
|
Fig. 10 Aromatics isolated within a highly aliphatic structure proposed as a bump contributor. |
| In the text | |
|
Fig. B.1 Determination of the absorption profile σ2ars for the two cases of 2ARS contribution (red curve in both figures). In both figures, the blue curve is the normalized absorption cross section of naphthalene σnaph (Grosch et al. 2015). The blue dotted line is a linear extrapolation of the naphthalene cross section for a large wave number. In both figures, the red and blue areas are the total absorption of the 2ARS profile 𝒜2ars and of the S3 ← S0 transition of naphthalene 𝒜naph, respectively. These areas are defined to be equal. In panel (a), the black curve is the interstellar bump parametrization from Fitzpatrick & Massa (2007) (see equation 3). In panel (b), the black curve is the mean REMPI spectrum 〈Sm〉 defined in equation 5. Also in panel (b), the yellow dashed line is a Gaussian function A exp |
| In the text | |
Current usage metrics show cumulative count of Article Views (full-text article views including HTML views, PDF and ePub downloads, according to the available data) and Abstracts Views on Vision4Press platform.
Data correspond to usage on the plateform after 2015. The current usage metrics is available 48-96 hours after online publication and is updated daily on week days.
Initial download of the metrics may take a while.