Open Access
Fig. 2
Download original image
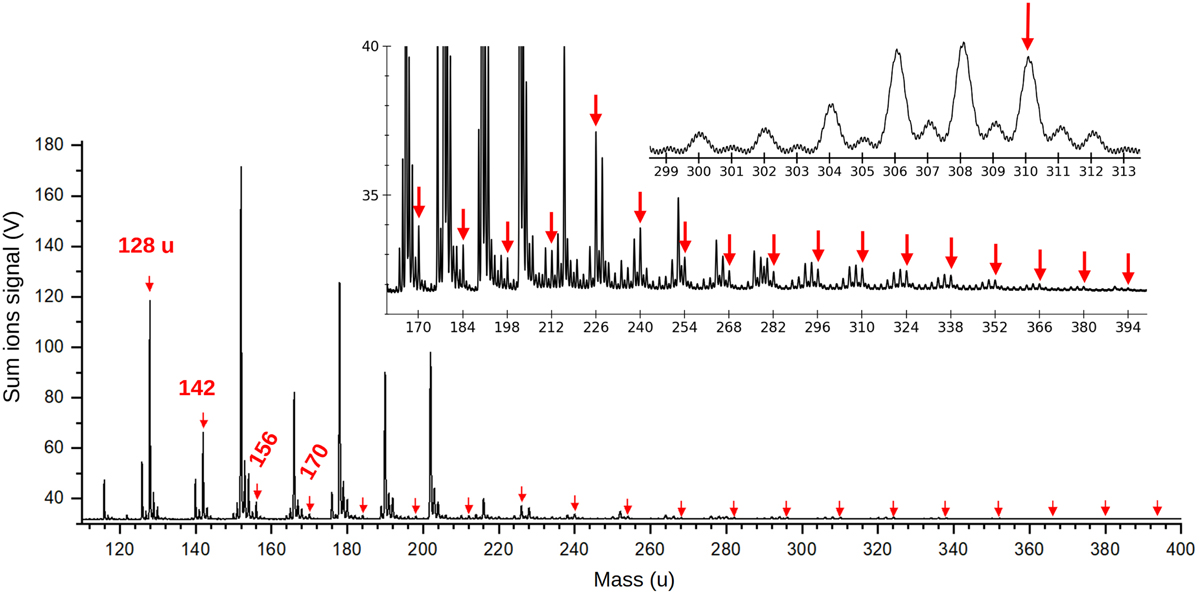
Sum of all mass spectra recorded over the range 214–285 nm. The main mass distribution discussed in the text is highlighted with red arrows and shows a noticeable progression of +14 u.
Current usage metrics show cumulative count of Article Views (full-text article views including HTML views, PDF and ePub downloads, according to the available data) and Abstracts Views on Vision4Press platform.
Data correspond to usage on the plateform after 2015. The current usage metrics is available 48-96 hours after online publication and is updated daily on week days.
Initial download of the metrics may take a while.