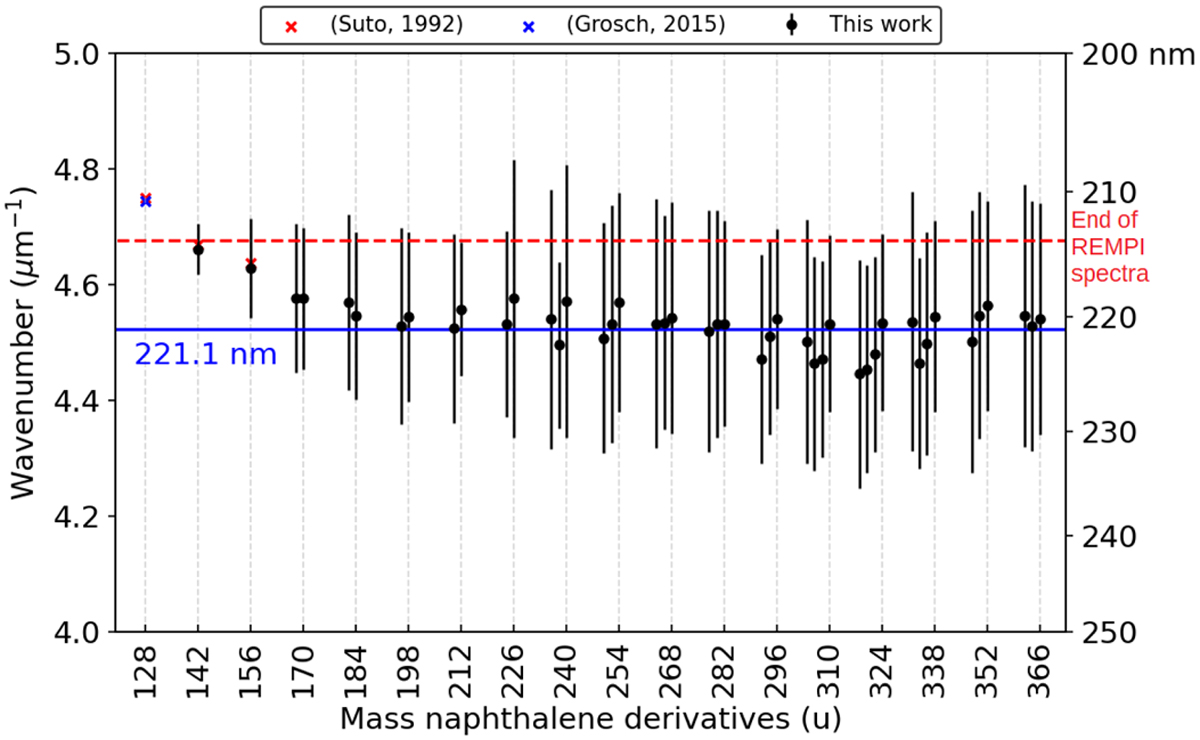
Fig. 9
Download original image
Scatter plots giving the locations of the peak absorption of the REMPI band profiles as a function of the mass of the naphthalene derivatives listed in Table 1. The blue straight line at 221.1 nm is the mean value of the peak absorption for masses strictly higher than 184 u. The red dashed line represents the shortest wavelength that can be achieved by the OPO laser. The black bars represent the estimated FWHM for each band profile. A Gaussian function with the least squares method has been fit to each individual REMPI spectrum in order to estimate the FWHM (we note that the FWHM of the bands are not discussed in the text).
Current usage metrics show cumulative count of Article Views (full-text article views including HTML views, PDF and ePub downloads, according to the available data) and Abstracts Views on Vision4Press platform.
Data correspond to usage on the plateform after 2015. The current usage metrics is available 48-96 hours after online publication and is updated daily on week days.
Initial download of the metrics may take a while.