Open Access
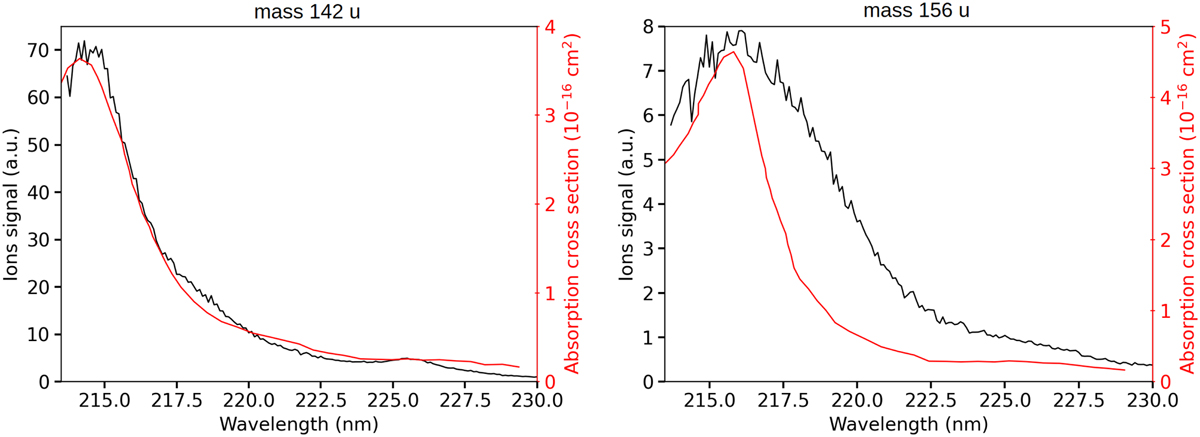
Fig. 5
Download original image
REMPI spectra (in black) compared to gas-phase absorption spectra reproduced from Suto et al. (1992, in red). Left panel: mass signal 142 u compared to 1-methylnaphthalene C10H7-CH3. Right panel: mass signal 156 u compared to 2-ethylnaphthalene C10H7-CH2CH3.
Current usage metrics show cumulative count of Article Views (full-text article views including HTML views, PDF and ePub downloads, according to the available data) and Abstracts Views on Vision4Press platform.
Data correspond to usage on the plateform after 2015. The current usage metrics is available 48-96 hours after online publication and is updated daily on week days.
Initial download of the metrics may take a while.