Fig. B.1
Download original image
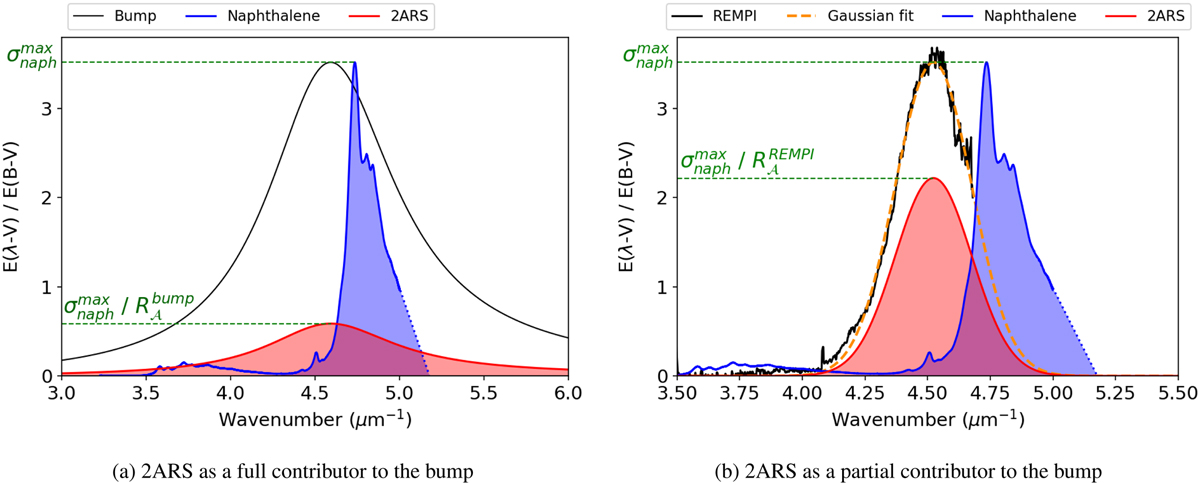
Determination of the absorption profile σ2ars for the two cases of 2ARS contribution (red curve in both figures). In both figures, the blue curve is the normalized absorption cross section of naphthalene σnaph (Grosch et al. 2015). The blue dotted line is a linear extrapolation of the naphthalene cross section for a large wave number. In both figures, the red and blue areas are the total absorption of the 2ARS profile 𝒜2ars and of the S3 ← S0 transition of naphthalene 𝒜naph, respectively. These areas are defined to be equal. In panel (a), the black curve is the interstellar bump parametrization from Fitzpatrick & Massa (2007) (see equation 3). In panel (b), the black curve is the mean REMPI spectrum 〈Sm〉 defined in equation 5. Also in panel (b), the yellow dashed line is a Gaussian function A exp ![]() that has been fitted to 〈Sm〉. The fitting parameters are shown in Table B.1 (fitting was done using the least squares method).
that has been fitted to 〈Sm〉. The fitting parameters are shown in Table B.1 (fitting was done using the least squares method).
Current usage metrics show cumulative count of Article Views (full-text article views including HTML views, PDF and ePub downloads, according to the available data) and Abstracts Views on Vision4Press platform.
Data correspond to usage on the plateform after 2015. The current usage metrics is available 48-96 hours after online publication and is updated daily on week days.
Initial download of the metrics may take a while.