| Issue |
A&A
Volume 676, August 2023
|
|
|---|---|---|
| Article Number | L2 | |
| Number of page(s) | 5 | |
| Section | Letters to the Editor | |
| DOI | https://doi.org/10.1051/0004-6361/202347177 | |
| Published online | 27 July 2023 | |
Letter to the Editor
K2 and TESS observations of symbiotic X-ray binaries: GX 1+4 and IGR J16194−2810
CONICET-Universidad Nacional de Hurlingham, Av. Gdor. Vergara 2222, Villa Tesei, Buenos Aires, Argentina
e-mail: This email address is being protected from spambots. You need JavaScript enabled to view it.
Received:
13
June
2023
Accepted:
4
July
2023
Abstract
I analyze the K2 and TESS data taken in 2016, 2019, and 2021 of the symbiotic X-ray binaries GX 1+4 and IGR J16194−2810. GX 1+4 consists of a pulsar accreting from a red giant companion in a 1160-day orbit. Since 1984, the pulsar has shown a continuous spin-down rate of Ṗ = −0.1177(3) mHZ yr−1. I report the detection of the spin period at an average value of 180.426(1) seconds as observed with the K2 mission and confirm that the spin period continues to increase at a rate of ∼1.61×10⁻⁷ s s−1. The K2 and hard X-rays, as observed with Swift/BAT, varied in tandem, in agreement with proposals from other authors that the optical light arises from reprocessed X-ray emission. In the case of IGR J16194−2810, the X-ray and optical spectroscopy have been interpreted as arising from a neutron star accreting from an M2 III red giant companion. Its orbital period is unknown, though I report here the detection of a modulation with a period of 242.837 min and interpret it as the neutron star spin period. IGR J16194−2810 is thus the second symbiotic X-ray binary whose spin period has been detected in optical wavelengths. This period, however, was only detected during the TESS observations of Sector 12 in 2019. The non-detection of this modulation during the observations of Sector 39 in 2021 is perhaps related to a low inclination of the orbit.
Key words: binaries: symbiotic / stars: individual: GX 1+4 / stars: individual: IGR J16194-2810
© The Authors 2023
 Open Access article, published by EDP Sciences, under the terms of the Creative Commons Attribution License (https://creativecommons.org/licenses/by/4.0), which permits unrestricted use, distribution, and reproduction in any medium, provided the original work is properly cited.
This article is published in open access under the Subscribe to Open model. This email address is being protected from spambots. You need JavaScript enabled to view it. to support open access publication.
1. Introduction
Symbiotic binaries consist of a compact object accreting from a red giant companion. These symbiotics with neutron stars are known as symbiotic X-ray binaries. The current census accounts for about a dozen of these systems (Yungelson et al. 2019). This class of accreting neutron star is extremely heterogeneous. At first sight, the only feature that these objects share is the presence of an evolved, wind mass-losing companion, from where the neutron star accretes. Other system parameters, such the neutron star spin period, the orbital period, or the accretion luminosity, vary significantly from one system to another. For example, spin periods range from about 100 s (Sct X-1) to more than 18 000 s (4U 1954+319; see Yungelson et al. 2019).
GX 1+4 (V2116 Oph) was the first known member of this class. It was discovered in X-rays during a balloon experiment by Lewin et al. (1971), who obtained a glimpse of what later would be confirmed as a spin period of about 2 min. The optical counterpart was discovered by Glass & Feast (1973) as an M5 III spectral type red giant (Chakrabarty & Roche 1997). The spin period in optical wavelengths was first reported by Jablonski et al. (1996), and until this study it was the only symbiotic X-ray binary with a spin period detected in the optical. The neutron star in GX 1+4 has since then been identified as an accreting pulsar in a symbiotic binary.
A long history of the spin behavior of the neutron star in GX 1+4 exists, with a thorough compilation by González-Galán et al. (2012). The changes in the spin period of the accreting pulsar are thought to be related to the accretion rate and the changes in the torques due to the interaction of the neutron star’s magnetic field with the inner and outer region of the truncated accretion disk (Wang 1987; Ghosh & Lamb 1979).
IGR J16194−2810 was classified as a symbiotic X-ray binary by Masetti et al. (2007) after the identification of the optical counterpart of the INTEGRAL hard X-ray source. In their analysis of the Neil Gehrels Swift Observatory/X-ray Telescope (Swift/XRT) light curve, the authors did not find evidence of pulsation of the neutron star, perhaps because of geometric effects such as the low inclination of the binary or the close alignment of the rotation and magnetic axis of the neutron star.
In this Letter I analyze the exquisite, long-term, almost uninterrupted photometric time series of GX 1+4 and IGR J16194−2810 obtained by the K2 and Transiting Exoplanet Survey Satellite (TESS) missions, and search for the neutron star spin period and its possible changes. In Sect. 2 I present the data, detail the procedures for extracting and removing spurious effects from the light curve, and describe the search for the spin period. Sections 3 and 4 present and discuss the results.
2. Observations
GX 1+4 was observed during quarter 11 of the K2 mission on 2016 September 24 at 19:12:30 UT (lc1) and on 2016 October 21 at 06:17:05 UT (lc2) with a cadence of 1 min over 23.2902 (lc1) and 47.7263 (lc2) days, respectively. IGR J16194−2810 was observed with TESS during Sectors 12 and 39, starting on 2019 May 21 at 11:07:37 UT and on 2021 May 27 at 06:37:12 UT, respectively. During Sector 12 the cadence was 30 min, while during Sector 39 it was 10 min.
I used the Lightkurve package (Lightkurve Collaboration 2018) to download the light curves and remove outliers1. TESS fluxes (e− s−1) were transformed to TESS magnitudes using the zero points from Vanderspek et al. (2018). I then applied a Savitzky-Golay (SG) smoothing filter to remove the low frequency variability (Figs. 1 and 2).
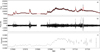 |
Fig. 1. GX 1+4 light curves. a: GX 1+4 K2 lc1+lc2 light curve (black dots) with the SG filter overlayed (red line). b: K2 light curve after subtracting the SG filter. c: Swift/BAT light curve with 1-day bins in the 15–50 keV energy range. The long-term variability in X-rays, from the accretion process, seems to be closely followed by the optical light curve. |
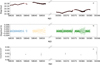 |
Fig. 2. IGR J16194−2810 light curves. a: TESS light curve of IGR J16194−2810 (black dots) with the SG filter curve on top (red line). b: Light curve after the subtraction of the SG filter. c: MAXI 2–20 keV light curve with 10-day bins. |
To search for the spin period, I used the generalized Lomb-Scargle (GLS) algorithm as implemented in the astropy library with a “standard”2 normalization. Significance levels were calculated via the bootstrapping method implemented in the same library. In the case of the light curve from GX 1+4, I searched for periods around the already known spin period, in the frequency range 470–490 d−1.
The TESS light curve of IGR J16194−2810 presents larger gaps than those from K2 due to satellite downlink and/or bad-quality cadences (conservatively, I only downloaded measurements with quality_mask=‘hard’). In this case, I divided the light curve into three portions – (1) MJD < 58640.43, (2) 58643.97 > MJD < 58652.37, and (3) MJD > 59363.64 (see Fig. 2) – and searched for periods.
In order to determine the X-ray flux state of GX 1+4 and IGR J16194−2810, which is related to the accretion state and possibly changes in the spin period, I downloaded the Swift/Burst Alert Telescope (BAT) light curve of GX 1+4 from the Swift/BAT Monitor web site3 in the 15–50 keV energy range (Krimm et al. 2013) and selected the 1-day bins between the dates observed with K2 (see Fig. 1). In the case of IGR J16194−2810, I downloaded the Monitor of All-Sky X-ray image (MAXI)4 light curve in the 2–20 keV energy range and re-binned it into 10-day bins to increase the signal-to-noise ratio.
3. Results
3.1. GX 1+4
The GLS periodogram from the lc1+lc2 light curve shows a highly significant peak at the period P = 180.426(1) s (Fig. 3) and a few other peaks close by. Jablonski et al. (1997) reported a period of 124.17±0.04 s on 1996 April 26 in optical wavelengths. Several studies using high energy observations, prior to and after the detection of the spin period in the optical, already reported periods in the range ∼120–∼170 s (see González-Galán et al. 2012, and references therein). Moreover, the spin period is known to evolve, with a spin-up phase from 1970 until 1984 and a spin-down phase since then. The most recent measurement reported from a NuSTAR observation taken in October 2015 yielded a 178.778±0.006 s spin period (Jaisawal et al. 2018). In their Fig. 6, González-Galán et al. (2012) nicely show the evolution of the spin period until 2010. I used the data from their Table B.1 and updated their figure by including the optical period from Jablonski et al. (1997), Suzaku (Yoshida et al. 2017), NuSTAR, and Fermi (Malacaria et al. 2020) and the K2 period detection reported here (see the right panel of Fig. 3). Overall, the spin period found in the K2 data confirms the spin-down trend determined from the other data.
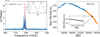 |
Fig. 3. Period change in GX 1+4. Left: GLS periodogram (blue). The frequency with the highest power is highlighted in red. This periodogram corresponds to the full K2 light curve of GX 1+4. There are other peaks around the main peak, which suggests that the period changed during the observations (see Sect. 3). The inset shows the light curve folded at the 180.426 s period and binned at 80 bins/cycle. Right: historical evolution of the spin period from measurements from various instruments, listed in Table B.1 of González-Galán et al. (2012), such as Rossi X-ray Timing Explorer (RXTE) and Compton Gamma Ray Observatory/Burst And Transient Source Experiment (CGRO/BATSE), among others (see text). Fermi/Gamma-ray Burst Monitor (GBM) measurements are shown as orange symbols, while K2 measurements are shown as black symbols. The inset shows the spin evolution during the K2 observations reported here; the red line shows a simple linear fit to the spin-down trend. |
The long-term coverage of K2 allowed me to search for changes in the spin period over more than 70 days. I extracted the periodograms from 1-day, consecutive, and overlapping (50% overlap) slices of the light curve, which show strong power at the frequency of the spin of the neutron star. During consecutive slices, the period increases, following the spin-down already observed at high energies (Fig. 3). The spin-down rate during the K2 observations, determined by a simple linear fit, is ∼1.61×10⁻⁷ s s−1.
According to the orbital ephemeris from Hinkle et al. (2006), the K2 observations covered the 0.92–0.98 orbital phases, and in agreement with I-band measurements reported by Iłkiewicz et al. (2017), the optical emission increased toward the periastron passage. Hinkle et al. (2006) also present an ephemeris for a possible eclipse of the neutron star, and the K2 observations covered the phase range from 0.67 to 0.73 from the inferior conjunction. Swift/BAT Transient Monitor observations that coincided with the K2 observations show that the source was in a low hard X-ray flux state during lc1 and part of lc2, while afterward the hard X-ray flux increased by a factor of about four (see Fig. 1). The Swift/BAT light curve shows a slow rise after about MJD 57690, reaching a maximum count rate of 0.043 c s−1 or a flux5 of 2.6×10⁻⁹ ergs s−1 cm−2, which translates to a luminosity of 5.7×1036 ergs s−1 at a distance of 4.3 kpc (González-Galán et al. 2012). The tandem variability observed between BAT and K2 light curves supports the scenario proposed by Jablonski et al. (1997), in which the optical light arises from reprocessed X-rays.
The current spin-down rate could be caused by a retrograde rotating disk, which extracts angular momentum from the pulsar, with an increased spin-down rate at higher X-ray luminosities. The analysis of the K2 and Swift/BAT light curve does not support this scenario because a steady spin-down rate is observed even after the increase in the X-ray luminosity. Moreover, as pointed out by González-Galán et al. (2012), a retrograde disk lasting for about 40 years needs further investigation.
As an alternative, González-Galán et al. (2012) explored the scenario of quasi-spherical accretion onto the neutron star as a possible explanation for the observed long-term behavior of the spin rate. In the case that an accretion disk cannot be formed through wind accretion, accretion can, depending on the source luminosity, proceed via the free-fall of matter toward the magnetosphere when LX is above a few 1036 ergs s−1, while for lower luminosities the accreting material forms a hot shell around the magnetosphere, which is later accreted through instabilities in the magnetosphere. Free-fall accretion seems unlikely to have proceeded during the K2 observations because of the low Swift/BAT luminosity (free-fall accretion would require LX above 1037 ergs s−1), which suggests that the settling accretion regime could have been at work.
3.2. IGR J16194−2810
The GLS periodogram from the first two portions of the TESS light curve of IGR J16194−2810 reveals a strong peak at a frequency of 5.9299 d−1, corresponding to a period of 242.839(2) min (14570.34 s). The first harmonic of this period is also significantly detected in the power spectrum. I interpret this period as the neutron star spin period, and this is the first time it has been detected at any wavelength. Figure 4 shows the power spectrum of each portion of the TESS light curve. It is noticeable that the 242.839 min period is not detected during the TESS observations performed during sector 39 in May 2021. The 2–20 keV MAXI light curve (panel c in Fig. 2) does not point to an increase or decrease in the X-ray flux in May 2021 with respect to May 2019. Since the X-ray flux is related to the accretion rate, this could help explain the non-detection of the neutron star’s spin, which remains unknown.
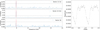 |
Fig. 4. GLS periodograms of the TESS observations of IGR J16194−2810. The frequency with the highest power is highlighted in red. These periodograms correspond to the first (top) and second (middle) portion of the Sector 12 TESS observations, and to Sector 39 observations (bottom). The horizontal dashed black lines represent 3σ detection probabilities. The right-hand panel shows the light curve folded at the 242.839 min period and binned at 80 bins/cycle. |
Yungelson et al. (2019) constructed models of symbiotic X-ray binaries with various improvements over past models, such as the accretion settling regime. In their Fig. 2, Yungelson et al. (2019) present a Pspin − LX diagram for different accretion scenarios (disk or wind accretion) and different evolutionary stages of the companion (the core helium burning or early asymptotic giant branch stage). At a distance of ≲3.7 kpc, the X-ray luminosity of IGR J16194−2810 is ≲7×1034 ergs s−1 (Masetti et al. 2007). Its detected spin period of 14570.34 s places IGR J16194−2810 in the region of the Pspin − LX diagram where other symbiotic X-ray binaries are found. The as yet unknown orbital period, however, precludes me from distinguishing between the various models.
4. Conclusions
By searching for the neutron stars’ spin period in the K2 and TESS light curves of the X-ray symbiotics GX 1+4 and IGR J16194−2810, I have found that:
-
During the K2 observations in 2016, the neutron star in GX 1+4 continued to spin-down at a rate of 1.61×10⁻⁷ s s−1. It is clear, however, that the spin-down rate has not been constant since the beginning of the spin-down phase in 1984 (Fig. 3). The Swift/BAT data during the same epoch show an increase in the X-ray luminosity, which, as expected if the optical light results from reprocessed X-rays, was accompanied by an optical brightening.
-
The increase in the X-ray luminosity during the K2 observations was not high enough to change the trend of the spin period. These changes have been previously observed in X-rays and at higher X-ray luminosities (Chakrabarty et al. 1997).
-
I report here, for the first time, the detection of a modulation in the TESS light curve of the symbiotic X-ray binary IGR J16194−2810. The 242.839 min period is interpreted as the period of the neutron star spin. This period is transient; it was detected only during the observations performed in 2019 and was absent in 2021. The non-detection of the spin period in 2021 does not seem to be related to the luminosity state of the source, given that neither the X-ray nor the optical luminosity changed significantly between the years 2019 and 2021. Further observations could elucidate the reasons behind the non-detection of the spin period.
-
The spin period of 242.839 min and the X-ray luminosity of about 1034 − 35 ergs s−1 (Masetti et al. 2007) of IGR J16194−2810 agree with model predictions and match the location of other symbiotic X-ray binaries in the Pspin − LX diagram (Yungelson et al. 2019).
Long term, uninterrupted optical light curves should be consider as powerful tools to unveil parameters such as the spin period of the accreting neutron star and the orbital period of this intriguing class of binaries, which are necessary to further constrain theoretical models.
As described at https://docs.lightkurve.org/tutorials/index.html
The standard normalized periodogram is normalized by the residuals of the data around the constant reference model (see https://docs.astropy.org/en/stable/timeseries/lombscargle.html)
Acknowledgments
I thank the anonymous referee for useful remarks. GJML is a member of CIC-CONICET (Argentina) and acknowledge support from grant ANPCYT-PICT 0901/2017. This paper includes data collected by the Kepler mission and obtained from the MAST data archive at the Space Telescope Science Institute (STScI). Funding for the Kepler mission is provided by the NASA Science Mission Directorate. STScI is operated by the Association of Universities for Research in Astronomy, Inc., under NASA contract NAS 5-26555. This research made use of Lightkurve, a Python package for Kepler and TESS data analysis (Lightkurve Collaboration 2018).
References
- Chakrabarty, D., & Roche, P. 1997, ApJ, 489, 254 [Google Scholar]
- Chakrabarty, D., Bildsten, L., Finger, M. H., et al. 1997, ApJ, 481, L101 [CrossRef] [Google Scholar]
- Ghosh, P., & Lamb, F. K. 1979, ApJ, 234, 296 [Google Scholar]
- Glass, I. S., & Feast, M. W. 1973, Nat. Phys. Sci., 245, 39 [NASA ADS] [CrossRef] [Google Scholar]
- González-Galán, A., Kuulkers, E., Kretschmar, P., et al. 2012, A&A, 537, A66 [NASA ADS] [CrossRef] [EDP Sciences] [Google Scholar]
- Hinkle, K. H., Fekel, F. C., Joyce, R. R., et al. 2006, ApJ, 641, 479 [NASA ADS] [CrossRef] [Google Scholar]
- Iłkiewicz, K., Mikołajewska, J., & Monard, B. 2017, A&A, 601, A105 [NASA ADS] [CrossRef] [EDP Sciences] [Google Scholar]
- Jablonski, F., Pereira, M., Braga, J., Campos, S. J., & Gneiding, C. 1996, IAU Circ., 6489, 1 [NASA ADS] [Google Scholar]
- Jablonski, F. J., Pereira, M. G., Braga, J., & Gneiding, C. D. 1997, ApJ, 482, L171 [CrossRef] [Google Scholar]
- Jaisawal, G. K., Naik, S., Gupta, S., Chenevez, J., & Epili, P. 2018, MNRAS, 478, 448 [NASA ADS] [CrossRef] [Google Scholar]
- Kirsch, M. G., Briel, U. G., Burrows, D., et al. 2005, in UV, X-Ray, and Gamma-Ray Space Instrumentation for Astronomy XIV, ed. O. H. W. Siegmund, SPIE Conf. Ser., 5898, 22 [NASA ADS] [Google Scholar]
- Krimm, H. A., Holland, S. T., Corbet, R. H. D., et al. 2013, ApJS, 209, 14 [NASA ADS] [CrossRef] [Google Scholar]
- Lewin, W. H. G., Ricker, G. R., & McClintock, J. E. 1971, ApJ, 169, L17 [NASA ADS] [CrossRef] [Google Scholar]
- Lightkurve Collaboration (Cardoso, J. V. D. M., et al.) 2018, Astrophysics Source Code Library [record ascl:1812.013] [Google Scholar]
- Malacaria, C., Jenke, P., Roberts, O. J., et al. 2020, ApJ, 896, 90 [NASA ADS] [CrossRef] [Google Scholar]
- Masetti, N., Landi, R., Pretorius, M. L., et al. 2007, A&A, 470, 331 [NASA ADS] [CrossRef] [EDP Sciences] [Google Scholar]
- Vanderspek, R., Doty, J., Fausnaugh, M., et al. 2018, TESS Instrument Handbook, Kavli Institute for Astrophysics and Space Science, Massachusetts Institute of Technology, Tech. Rep. [Google Scholar]
- Wang, Y. M. 1987, A&A, 183, 257 [Google Scholar]
- Yoshida, Y., Kitamoto, S., Suzuki, H., et al. 2017, ApJ, 838, 30 [NASA ADS] [CrossRef] [Google Scholar]
- Yungelson, L. R., Kuranov, A. G., & Postnov, K. A. 2019, MNRAS, 485, 851 [NASA ADS] [CrossRef] [Google Scholar]
All Figures
|
Fig. 1. GX 1+4 light curves. a: GX 1+4 K2 lc1+lc2 light curve (black dots) with the SG filter overlayed (red line). b: K2 light curve after subtracting the SG filter. c: Swift/BAT light curve with 1-day bins in the 15–50 keV energy range. The long-term variability in X-rays, from the accretion process, seems to be closely followed by the optical light curve. |
| In the text | |
|
Fig. 2. IGR J16194−2810 light curves. a: TESS light curve of IGR J16194−2810 (black dots) with the SG filter curve on top (red line). b: Light curve after the subtraction of the SG filter. c: MAXI 2–20 keV light curve with 10-day bins. |
| In the text | |
|
Fig. 3. Period change in GX 1+4. Left: GLS periodogram (blue). The frequency with the highest power is highlighted in red. This periodogram corresponds to the full K2 light curve of GX 1+4. There are other peaks around the main peak, which suggests that the period changed during the observations (see Sect. 3). The inset shows the light curve folded at the 180.426 s period and binned at 80 bins/cycle. Right: historical evolution of the spin period from measurements from various instruments, listed in Table B.1 of González-Galán et al. (2012), such as Rossi X-ray Timing Explorer (RXTE) and Compton Gamma Ray Observatory/Burst And Transient Source Experiment (CGRO/BATSE), among others (see text). Fermi/Gamma-ray Burst Monitor (GBM) measurements are shown as orange symbols, while K2 measurements are shown as black symbols. The inset shows the spin evolution during the K2 observations reported here; the red line shows a simple linear fit to the spin-down trend. |
| In the text | |
|
Fig. 4. GLS periodograms of the TESS observations of IGR J16194−2810. The frequency with the highest power is highlighted in red. These periodograms correspond to the first (top) and second (middle) portion of the Sector 12 TESS observations, and to Sector 39 observations (bottom). The horizontal dashed black lines represent 3σ detection probabilities. The right-hand panel shows the light curve folded at the 242.839 min period and binned at 80 bins/cycle. |
| In the text | |
Current usage metrics show cumulative count of Article Views (full-text article views including HTML views, PDF and ePub downloads, according to the available data) and Abstracts Views on Vision4Press platform.
Data correspond to usage on the plateform after 2015. The current usage metrics is available 48-96 hours after online publication and is updated daily on week days.
Initial download of the metrics may take a while.