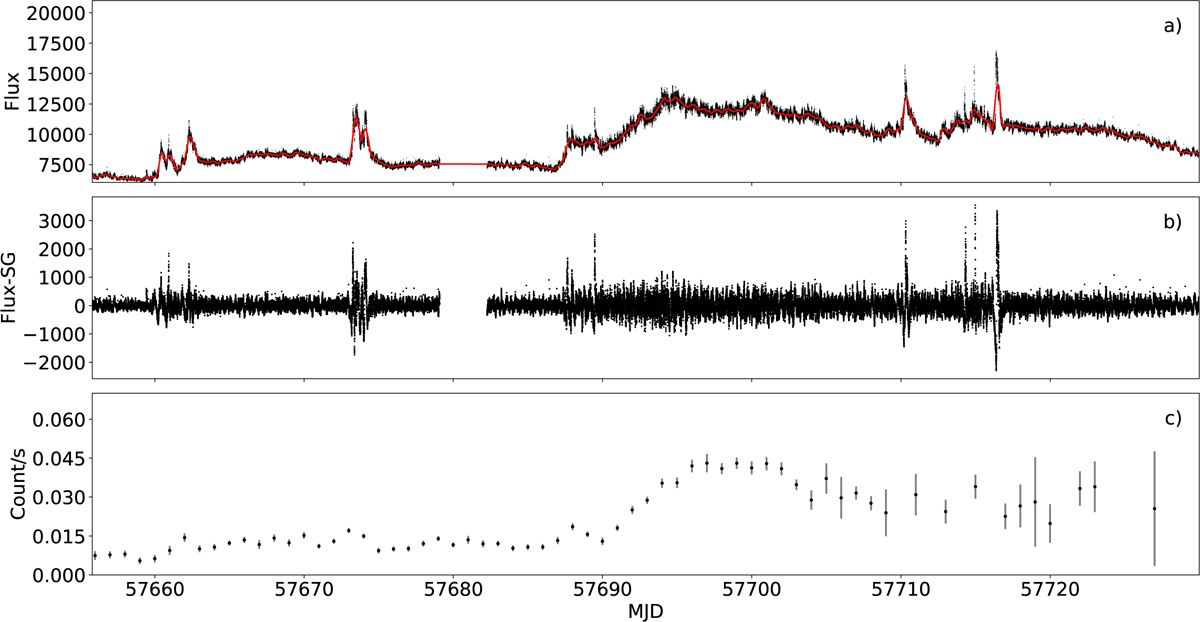
Fig. 1.
Download original image
GX 1+4 light curves. a: GX 1+4 K2 lc1+lc2 light curve (black dots) with the SG filter overlayed (red line). b: K2 light curve after subtracting the SG filter. c: Swift/BAT light curve with 1-day bins in the 15–50 keV energy range. The long-term variability in X-rays, from the accretion process, seems to be closely followed by the optical light curve.
Current usage metrics show cumulative count of Article Views (full-text article views including HTML views, PDF and ePub downloads, according to the available data) and Abstracts Views on Vision4Press platform.
Data correspond to usage on the plateform after 2015. The current usage metrics is available 48-96 hours after online publication and is updated daily on week days.
Initial download of the metrics may take a while.