| Issue |
A&A
Volume 693, January 2025
|
|
|---|---|---|
| Article Number | A260 | |
| Number of page(s) | 16 | |
| Section | Stellar structure and evolution | |
| DOI | https://doi.org/10.1051/0004-6361/202348708 | |
| Published online | 23 January 2025 | |
Multi-wavelength study of 1eRASS J085039.9−421151 with eROSITA, NuSTAR, and X-shooter
1
Dr. Karl-Remeis Sternwarte and Erlangen Centre for Astroparticle Physics, Friedrich-Alexander Universität Erlangen-Nürnberg, Sternwartstr. 7, 96049 Bamberg, Germany
2
Universität Tübingen, Institut für Astronomie und Astrophysik Tübingen, Sand 1, 72076 Tübingen, Germany
3
University of Maryland College Park, Department of Astronomy, College Park MD 20742, USA
4
NASA Goddard Space Flight Center, Astrophysics Science Division, Greenbelt, MD 20771, USA
5
European Space Agency (ESA), European Space Astronomy Centre (ESAC), Camino Bajo del Castillo s/n, 28692 Villanueva de la Cañada, Madrid, Spain
6
Center for Space Science and Technology, University of Maryland Baltimore County, 1000 Hilltop Circle, Baltimore, MD 21250, USA
7
Embry Riddle Aeronautical University, Department of Physics, 3700 Willow Creek Road, Prescott, AZ 86301, USA
8
Max-Planck-Institut für extraterrestrische Physik, Giessenbachstraße 1, 85748 Garching, Germany
9
Department of Physics and Astronomy, Howard University, Washington, DC 20059, USA
10
Department of Astronomy and Astrophysics, University of California, San Diego, 9500 Gilman Dr., La Jolla, CA 92093-0424, USA
11
Praxis Inc., Alexandria, VA 22303, resident at Naval Research Laboratory, Washington, DC 20375, USA
12
ESICT, Valencian International University, Pintor Sorolla 21, 46002 Valencia, Spain
13
Telespazio UK for ESA, European Space Astronomy Center (ESAC), Camino bajo del castillo S/N, 28692 Villanueva de la Cañada, Spain
⋆ Corresponding author; This email address is being protected from spambots. You need JavaScript enabled to view it.
Received:
22
November
2023
Accepted:
30
October
2024
Abstract
The eROSITA instrument on board Spectrum-Roentgen-Gamma (SRG) has completed four scans of the X-ray sky, leading to the detection of almost one million X-ray sources in eRASS1 alone, including multiple new X-ray binary candidates. We report on analysis of the X-ray binary 1eRASS J085039.9−421151, using a ∼55 ks long NuSTAR observation, following its detection in each eROSITA scan. An analysis of the eROSITA and NuSTAR X-ray spectra in combination with X-shooter data of the optical counterpart provide evidence of an X-ray binary with a red supergiant (RSG) companion, confirming previous results. However, we did determine a cooler spectral type for M2–3, owing to the presence of TiO bands in the optical and near-infrared spectra. The X-ray spectrum is well-described by an absorbed power law with a high-energy cutoff typically applied for accreting high mass X-ray binaries. In addition, we detected a strong fluorescent neutral iron line with an equivalent width of ∼700 eV and an absorption edge, the latter indicating strong absorption by a partial covering component. It is unclear whether the partial absorber is ionised. There is no significant evidence of a cyclotron resonant scattering feature. We did not detect any pulsations in the NuSTAR light curves, possibly on account of a large spin period that has gone undetected due to insufficient statistics at low frequencies or potentially large absorption that causes pulsations to be smeared out. Even so, the low persistent luminosity, the spectral parameters observed (photon index, Γ < 1.0), and the minuscule likelihood of detection of RSG-black hole systems suggest that the compact object is a neutron star.
Key words: stars: emission-line / Be / stars: neutron / X-rays: binaries
© The Authors 2025
 Open Access article, published by EDP Sciences, under the terms of the Creative Commons Attribution License (https://creativecommons.org/licenses/by/4.0), which permits unrestricted use, distribution, and reproduction in any medium, provided the original work is properly cited.
This article is published in open access under the Subscribe to Open model. This email address is being protected from spambots. You need JavaScript enabled to view it. to support open access publication.
1. Introduction
As part of its X-ray all-sky survey, the extended ROentgen Survey Imaging Telescope Array (eROSITA; Merloni et al. 2012; Predehl et al. 2021) on board the Spectrum-Roentgen-Gamma (SRG) observatory has completed four surveys (out of a planned eight), each with a duration of six months. The eROSITA survey has already detected several million X-ray sources and has increased the number of known X-ray sources by a significant factor, compared to the 1990 sky survey conducted by ROentgen SATellite (ROSAT; Voges et al. 1999; Boller et al. 2016). Among other source types, eROSITA is expected to significantly increase the number of known X-ray binaries (XRBs), particularly those with lower luminosities (Doroshenko et al. 2014). Indeed, eROSITA’s sensitivity in the 0.2–8.0 keV band, which is a factor of ∼20–40 higher than ROSAT (Boller et al. 2016), allows for the detection of sources that were too faint for ROSAT’s soft X-ray coverage or for hard X-ray observatories, such as the INTErnational Gamma-Ray Astrophysics Laboratory (INTEGRAL; Winkler et al. 1993; Doroshenko et al. 2014) or the Neil Gehrels Swift Burst Alert Telescope (Swift/BAT; Barthelmy et al. 2005).
To identify new X-ray binary candidates in the catalogue of the first eROSITA all-sky survey (eRASS1), our team uses the typical X-ray and optical properties (e.g., eROSITA fluxes and Gaia magnitudes) of sources contained in the most recent catalogues of heretofore known high-mass X-ray binaries (HMXBs, Neumann et al. 2023) and low-mass X-ray binaries (LMXBs, Avakyan et al. 2023) before performing follow-up observations with other pointed instruments. Among the sources flagged as X-ray binary candidates, our team obtained deeper observations for four candidates by means of target of opportunity (ToO) observations with the Nuclear Spectroscopic Telescope Array (NuSTAR; Harrison et al. 2013) and the X-ray Multi-Mirror Mission (XMM-Newton; Jansen et al. 2001), with each of them observing two of the candidates. An analysis of one of the X-ray binary candidate follow-ups with NuSTAR has been presented by Doroshenko et al. (2022), while the two others have been reclassified and will be discussed by Avakyan et al. (in prep.).
This paper focuses on the analysis of eROSITA and NuSTAR observations of the fourth candidate, 1eRASS J085039.9−4211511 (hereafter, J085039), a source that first came to our notice as an X-ray source found at  ,
,  , with a positional uncertainty of
  (Merloni et al. 2024), during the first eROSITA All-Sky Survey (eRASS1). The system had been previously detected in X-rays (as Swift J0850.8−4219) in the 105 month Swift/BAT All Sky Hard X-ray Survey carried out by the Swift/BAT instrument on board the Neil Gehrels Swift Observatory (Gehrels et al. 2004) at the position
  ,
,  , where it was flagged as an unidentified source (Oh et al. 2018). We flagged J085039 as an X-ray binary candidate due to its positional coincidence with the star UCAC2 13726137 (Fig. 1), which is only 3″ away, and it has since been identified as a K-type supergiant (De et al. 2024, hereafter, De+24). This star is contained in the Gaia catalogues and is reported to have a G-band magnitude of 13.354±0.002 mag and a parallax of 0.0827 ± 0.0139 mas (Gaia Collaboration 2016, 2023), corresponding to a geometric distance of
  kpc (Bailer-Jones et al. 2021).
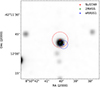 |
Fig. 1. Infrared view of the optical counterpart from the Two Micron All Sky Survey (2MASS; Cutri et al. 2003), with 2MASS (Cutri et al. 2003), NuSTAR (Harrison et al. 2013), and eRASS1 (Merloni et al. 2024) error circles indicated in green, red, and blue, respectively. The star is located |

Here, we report on the analysis of the eROSITA data, a pointed observation with NuSTAR, and archival observations from the ESO Very Large Telescope (VLT)’s spectrograph X-shooter (Vernet et al. 2011) of the optical counterpart, with the primary focus on determining the nature of its compact object. We compare our results with the findings of De+24, who studied Swift/XRT data and a near-infrared (NIR) spectrum obtained using the Southern Astrophysical Research Telescope (SOAR)’s TripleSpec spectrograph (Schlawin et al. 2014). The paper is structured as follows. In Sect. 2, we describe the observations obtained and analysed, as well as report on information gathered from several survey instruments. This is followed by inferences on the behaviour of the optical counterpart in Sect. 3. Section 4 discusses the timing and spectral analysis of the X-ray data, on the basis of which we discuss likely physical scenarios for the system in Sect. 5, before concluding on our findings in Sect. 6.
2. Observations and data reduction
2.1. eROSITA
J085039 has been observed by eROSITA four times, once during each complete All-Sky Survey conducted thus far (Table 1). The data were obtained within the framework of the eROSITA_DE consortium. We extracted the data products using evtool and srctool from the eROSITA data analysis software (eSASS; Brunner et al. 2022), version 211214, processing version c020, and the High Energy Astrophysics Software (HEASOFT), version 6.29. The source and background extraction regions for this source were computed by eSASS to be 20″ and an annulus with inner and outer radii of ∼48″ and ∼250″, respectively.
Observing log of the four eROSITA snapshots of J085039 and the follow-up observation obtained by NuSTAR.
Since eROSITA performs a slew survey, the total exposure of sources during each All-Sky Survey is only a few 100 s, taken during several ∼40 s long passes of the source through eROSITA’s field of view, which are separated by 4 h due to the rotation of SRG.
2.2. NuSTAR
Due to the short exposure times of the eROSITA slew survey, with the exception of for the brightest X-ray sources, follow-up observations with other instruments are necessary to accumulate data that are suited for a detailed quantitative analysis that would allow us to deduce physical information characterising the source. Therefore, we triggered follow-up observations of J085039 with NuSTAR, launched on 2012 June 13 into an orbit with a period of about 97 minutes. It comprises two detector arrays, focal plane modules A and B (FPMA and FPMB), which operate in the 3–79 keV energy range (Harrison et al. 2013).
NuSTAR observed J085039 between MJD 59347.187 and 59348.388 (OBSID: 80660302002), close to the third eROSITA observation (Fig. 2) with an effective exposure time of 55.6 ks. We carried out the data reduction and processing using NuSTAR’s analysis software NuSTARDAS, version 2.1.1, v20211115, of the NuSTAR calibration database (CALDB), and HEASOFT v6.29. We reduced the raw data to produce cleaned event lists using nupipeline and applied nuproducts to extract spectra and barycentered light curves from circular regions of ∼45″ radius separately for FPMA and FPMB. The background regions were circles with ∼117″ radius, offset from the source, but on the same detector chip.
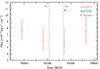 |
Fig. 2. 3–10 keV X-ray flux from each observation of J085039 as a functin of time, corrected for absorption. The eROSITA fluxes are displayed at the start time of each scan. The third eROSITA observation was only four days prior to the pointed NuSTAR observation. The NuSTAR flux is brighter by a factor ∼2, which might indicate slight source-intrinsic variability, even when taking into account eROSITA’s known calibration uncertainties (Migkas et al. 2024). The observation times of the optical observations from X-shooter are marked by gray dashed lines as O1 and O2. |
2.3. Other X-ray data
In addition to the NuSTAR follow-up, we searched for the source in other X-ray survey data. The results are listed in Table 2 and described in the following. We refer to the 157 month light curve provided by the 157 month Swift/BAT All Sky Hard X-ray Survey (Lien et al., in prep.), which spans the period from the detection of the source in 2004 December until 2017 January. We obtained Crab-weighted light curves of J085039’s Swift/BAT counterpart, Swift J0850.8−4219, from the Swift/BAT Hard X-ray Survey webpage hosted by the High Energy Astrophysics Software ARChive (HEASARC) server2. We determined the flux based on the value listed there. Archival Swift/XRT observations with serendipitous detections of the source were obtained from HEASARC. We also estimated the fluxes, and upper limits where fluxes were unattainable, as observed by other survey missions at the source position of J085039, namely, by ROSAT, INTEGRAL, and the Mikhail Pavlinsky Astronomical Roentgen Telescope-X-ray Concentrator (ART-XC; Pavlinsky et al. 2021, also on board SRG).
J085039 as seen by different observatories over the years.
The upper limits on ROSAT count rate were obtained using the upper limit server HIgh-energy LIght-curve GeneraTor3 (HILIGT; Saxton et al. 2022; König et al. 2022). We converted them to a flux upper limit with WebPIMMS4, assuming a powerlaw with an index of Γ = 0.5, and an NH = 1.5 × 1022 cm−2 (see Sect. 4.2).
We determined the INTEGRAL flux upper limits in the 30–50 keV band from merged IBIS/ISGRI (Ubertini et al. 2003; Lebrun et al. 2003) spectra of all IBIS Science Windows during which the source position had an off-axis angle of < 10°. We used version 11.2 of the Off-line Scientific Analysis (OSA)5 for the data extraction. The resulting spectrum includes a total of 2.8 Ms of exposure time. We described its shape with a simple powerlaw model to determine a flux upper limit.
The ART-XC flux for J085039’s counterpart in the 4–12 keV band was obtained from the recently published catalog of all sources detected by SRG/ART-XC in its first year (Pavlinsky et al. 2022), where it has been independently identified as a potential HMXB candidate.
Swift/XRT fluxes were obtained by fitting an absorbed powerlaw to the spectra extracted at the source position, with extraction regions spanning ∼25″ in radii. The fitting resulted in a relatively unconstrained photon index of  with
with  . We do not use these spectra for further spectral analysis, in favour of the eROSITA data which provide more overall counts.
2.4. X-shooter
We also used data from the two observations of the potential companion star of J085039 in the optical and NIR found in the ESO archive. These data were obtained using the VLT’s spectrograph X-shooter (Vernet et al. 2011). X-shooter is a medium resolution spectrograph that has three spectroscopic arms, operating in ultraviolet-blue (UVB; 300–559.5 nm), visible (VIS; 559.5–1024 nm), and near-infrared (NIR; 1024–2480 nm). The observations were carried out four months apart, on 2021 January 11 (MJD 59225) and 2021 May 14 (MJD 59348). Each observation had an exposure of ∼1000 s in each of the three bands covered by X-shooter.
Finally, the counterpart is also monitored by the All Sky Automated Survey for Supernovae (ASAS-SN; Shao 2017), where we used the light curve, as hosted on the ASAS-SN Lightcurve Server6.
2.5. Search for counterparts in other wavelengths
Apart from the optical and X-ray regimes, X-ray binaries can also sometimes show up in other wavelengths, as microquasars (Koljonen & Russell 2019) or accreting millisecond X-ray pulsars (AMXPs) in radio (e.g. Gusinskaia et al. 2020), or as γ-ray binaries emitting γ-rays (Chernyakova & Malyshev 2020). Emission (or lack thereof) in these wavelengths can serve as yet another distinguishing feature that allows us to place the system among the various subclasses of X-ray binaries, hinting at the nature of the compact object.
With this in mind, we performed a search for counterparts at the coordinates of J085039 with survey data from the Fermi Gamma-ray Space Telescope’s Large Area Telescope (Fermi/LAT; Atwood et al. 2009). The search returned no reliable counterparts within 25′ of the source position. To look for radio counterparts, we queried HEASARC’s regularly updated Master Radio Catalog7, which provides access to all available radio source catalogs. We did not find any reliable radio counterparts within the error circle of the eROSITA position of J085039 or within that of the optical counterpart.
3. The nature of the optical counterpart UCAC2 13726137
3.1. Narrowing down the spectral type and luminosity class
We start our discussion of the nature of J085039 with a look at the optical counterpart, since this can help us narrow down the possible configurations X-ray binaries may exist in, which are typically classified based on the mass and spectral type of the donor star (Shao 2017; Fornasini et al. 2023). HMXBs tend to be subdivided into Be X-ray binaries (BeXRBs) and supergiant X-ray binaries (SgXBs), with the companion stars being non-supergiant Be-type stars and massive supergiant stars, typically of spectral type OB, respectively (Reig 2011; Fornasini et al. 2023). In rare cases, the high-mass donor can also be a late-type red supergiant (RSG), as in 4U 1954+31 (Hinkle et al. 2020). LMXBs are instead characterised by late-type dwarf companions (see, e.g., Bahramian & Degenaar 2023, for a review) or, in a smaller subset of cases, M-giant donors. This subset of sources is called symbiotic X-ray binaries (SyXBs; Bozzo et al. 2022b; Yungelson et al. 2019). They are supposed to host highly magnetised neutron stars accreting from the slow stellar wind of their M giant optical counterparts.
Optical spectra enable us to discern between these possible donor types, based on the presence of various emission lines and overall spectral shape (see, e.g., Masetti et al. 2012). Be-type stars, typically defined as non-supergiant stars, show Balmer emission lines in their spectra at any time (Slettebak 1988), which are attributed to the presence of a decretion disk. OB-type supergiants can also exhibit some Balmer lines in emission, albeit shallower, but typically have several metal lines in emission (Aret et al. 2012; Liu et al. 2019). Late-type giant and supergiant stars typically do not show strong Balmer lines in emission. They are instead characterised by the presence of molecular absorption bands, mainly TiO in the optical and CO in the NIR regimes (Serote Roos et al. 1996). M giants in SyXBs do sometimes also show key lines in emission such as Hα (Davidsen et al. 1977). It should also be noted that M giants in accreting systems have been predominantly studied in the context of symbiotic stars (SySts) hosting white dwarfs as the compact object (Merc et al. 2019).
Although De+24 already characterised the optical counterpart of J085039 as a K4–5 supergiant, we nevertheless conduct an independent study, including a wider wavelength regime using the X-shooter data. The X-shooter spectra shown in Fig. 3 clearly indicate several lines in emission, most notably, the Balmer lines. These are strong indicators for the presence of a hot circumstellar decretion disk around a Be-type star (Slettebak 1988). However, the spectra also show prominent TiO bands at 6250 Å, 7150 Å, and 8500 Å, and very evident CO bands in the NIR spectra, strongly supporting the late-type characterisation invoked by De+24.
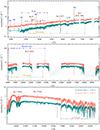 |
Fig. 3. De-reddened X-shooter spectra of the optical counterpart. Observation 2 shows an increase in flux with stronger emission lines. Prominent features include the Balmer series, several He I and Fe II lines, and TiO and CO absorption bands. Telluric regions are greyed out. |
To determine the spectral type, we employed methods to discern spectral type in SyXBs, as put forth by Kenyon & Fernandez-Castro (1987), who established that the depth of TiO bands acts as an indicator for spectral type and temperature of the star, independent of the effects of reddening, and have been similarly applied elsewhere (e.g. Munari & Banerjee 2018). We determined the [TiO]1 and [TiO]2, and the [Na] index, as defined by Kenyon & Fernandez-Castro (1987, their Eqs. 1, 2, and 4), and use them to compute the spectral type according to Eqs. (5) and (6) of the same paper,
![Mathematical equation: $$ \begin{aligned} \mathrm{ST} _{1} = 1.75 + 9.31[\mathrm{TiO} ]_{1} ,\end{aligned} $$](/articles/aa/full_html/2025/01/aa48708-23/aa48708-23-eq16.gif) (1)
(1)
and
![Mathematical equation: $$ \begin{aligned} \mathrm{ST} _{2} = 1.83 + 10.37[\mathrm{TiO} ]_{2} - 3.28[\mathrm{TiO} ]_{2}^2, \end{aligned} $$](/articles/aa/full_html/2025/01/aa48708-23/aa48708-23-eq17.gif) (2)
(2)
where the spectral type, ST is −6 for K0 stars, 0 for M0 stars, and +6 for M6 stars.
The indices determined from the X-shooter spectra are listed in Table 3. Using Eqs. (1) and (2), we find ST1 ranging from ∼2.86–3.14 and ST2 ranging from ∼1.80–1.98 between the two observations, pointing to a spectral type closer to ∼M2–3, as opposed to the K4–5 characterisation invoked by De+24. We compared UVES (Bagnulo et al. 2003) spectra corresponding to an M type and K type supergiant with the X-shooter data and find the TiO bands observed in UCAC2 13726137 are only visible in the M type spectrum. The conclusion that UCAC2 13726137 is a M type star is further supported by the correlation between the equivalent width of the CO(2, 0) band and spectral type as put forth by Davies et al. (2007), where our estimated values populate the top right of their Fig. 2, already hinting at a luminosity class of I.
Spectral indices used in this work.
Nevertheless, we also used other diagnostics to estimate the luminosity class. We use the equivalent width (EW) of the line blend constituting Ti I, Fe I, and CN around 8468 Å (see Table 4), which sits in the parameter space occupied by the handful of supergiants considered by Negueruela et al. (2011) in their Fig. 5, where they correlate EW(8468Å) with a specific spectral type. Messineo et al. (2017) analysed a sample of red supergiants, and find that they lie in the bottom right while correlating the equivalent widths of the Mg I line and the CO(2, 0) band. We compute the equivalent width of the CO(2, 0) band as defined by Messineo et al. (2021) for both observations. Some of the lines in this spectral region are shown in Fig. 4. We find our results for these lines consistent with the positions occupied by supergiants in this parameter space, compared to giants. We also estimated the equivalent widths and indices proposed by Dorda et al. (2016a), but found our overall values to be systematically larger. This is likely due, as the authors indicate, due to differences between red supergiant properties between the Magellanic Clouds – where their sample lies – and the Galaxy. We therefore do not use their characterisation, but tentatively suggest that the star is of luminosity class I, in agreement with De+24. Below, we retrace the steps taken by De+24 and compare our results.
Equivalent widths of spectral lines obtained from the X-shooter spectra, as well as other diagnostics.
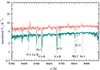 |
Fig. 4. 8300–9000 Å region of the NIR spectrum. Several key absorption lines used for classification of the donor star are indicated here. |
3.2. Retracing the steps undertaken by De et al. 2024
De+24 show a comparison of their SOAR T-Spec spectrum of UCAC2 13726137 to NIR spectra of an M giant and a K supergiant, eventually concluding that a K supergiant is the better fit. In this section, we take a deeper look at their diagnostics and apply them to the X-shooter spectra.
We find our measured values for the equivalent width of the CO(2, 0) band to be comparable to the value determined by De+24. Furthermore, we measured the equivalent widths of the absorption features at Na I and Ca I, although we found them to be more complex in the X-shooter spectra than in the T-Spec data. We also confirm that log(EW(CO)/(EW(Na)+EW(Ca))) lies in the parameter space for evolved late-type stars in the diagnostic put forth by Ramirez et al. (1997). The respective values are given in Table 4.
In accordance with De+24, we found CN absorption features in the Y + J band; in addition, we also found a TiO band at 11 000 Å. Upon closer inspection, the SOAR Tspec spectrum studied by De+24 also revealed the presence of the TiO absorption band, although it is masked by the strong He I emission line at 10 830 Å. As mentioned earlier in this paper, the presence of TiO bands throughout the optical and infrared regimes points to a later spectral type than K 4–5. Dorda et al. (2016b) suggested that deriving the spectral type from TiO bands results in underestimations of the temperature. These authors proposed using atomic line features such as those from Ti I and Fe I instead. However, as previously stated by Dicenzo & Levesque (2019), their results are based on a sample of stars ranging between G–M3 in spectral type, with the M stars making up a very small fraction. Dicenzo & Levesque (2019) emphasised the reliability of using the TiO band for late spectral types to determine the effective temperature. The M-type description of UCAC2 13726137 is further supported by correlations between effective temperature and equivalent widths of Na I, Ca I, and CO(2, 0) lines, respectively, (see Fig. 9 in Ramirez et al. 1997), where our values all correspond to a cool star with temperatures between 3200–3600 K. However, we are in complete agreement with De+24 on the luminosity class of the star, based on the diagnostics used by them employing the equivalent widths of lines from Mg I and CO(2, 0), and the J8, J9, and J10 indices from Messineo et al. (2021). Therefore, we have tentatively reclassified UCAC2 13726137 as an M2–3 supergiant.
3.3. Disentangling the emission lines
As alluded to in Sect. 3.1, emission lines are not typically observed in late-type supergiants. The emission lines must arise from matter surrounding the star, whether they are intrinsic to the star or attributed to the binary configuration of the system. However, if the emission lines are due to photo-ionisation by the compact companion, as suggested by De+24, the transient nature of some of them observed in the optical spectrum are expected to be correlated with variability in the X-rays. An example of variability in the emission lines between the two observations can be seen in the case of Hα (shown in Fig. 5). This is difficult to reconcile with the fairly persistent X-ray flux of J085039, as detected by eROSITA in each scan. Other lines such as those from He I and He II (also depicted in Fig. 5) are variable but markedly less so in comparison.
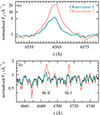 |
Fig. 5. (a) Hα line as seen in both X-shooter spectra, normalised for comparison. The second observation shows a stronger and single-peaked line profile, compared to an asymmetric line profile in the first data set. The asymmetry is likely due to the contribution of He IIλ6560, also being in emission. (b) He IIλ4686 and He Iλ4713 are in emission, in both X-shooter spectra, but without as much variability. We normalised the two spectral continua relative to each other to compare the behaviour of the emission lines. |
An obvious analogue to these spectra are the optical spectra of SySts, which are characterised as having the cool spectral continuum of a K–M giant, with several hydrogen, helium, and iron lines in emission; they also typically reveal high-ionisation states such as [Fe VII] (Kenyon & Webbink 1984). Although we found several hydrogen and helium lines in the X-shooter spectra, we did not find such lines as [Fe VIIλ, 6087] or [He IIλ, 10123]. Thus, in conjunction with the apparent lack of pronounced X-ray variability, we attempted to find other optical spectra showing similar lines in emission. We start with a comparison of our spectra to X-shooter spectra of late-type giants and supergiants. In particular, we identified KM-type giants and supergiants in the X-shooter spectral library (XSL) published as part of the third X-shooter data release (Verro et al. 2022). The giants in the sample are typically variable stars, namely, Mira variables or long-period variables (LPV), which are both known to show emission lines in their spectra. Some of these are shown in Fig. 6.
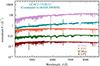 |
Fig. 6. Comparison of the de-reddened X-shooter spectra of the optical counterpart to J085039 with spectra of a variety of late type stars, obtained from the X-shooter spectral library. Although the K-type supergiant has some absorption lines in common with that of UCAC2 13726137, the latter’s overall shape seems to agree better with the M-type supergiant, in addition to the presence of TiO bands. Of special intrigue is the remarkable similarity in spectral shape and presence of the same emission lines in the Mira variable. |
We find that the red supergiants in the sample show similar lines in absorption with the strength of the TiO bands increasing with later spectral types, but there was no instance of emission lines as observed in UCAC2 13726137. On the other hand, we noticed a remarkable consistency with the spectra of Mira variables which display several of the same lines in emission as seen in one observation of UCAC2 13726137.
The similarity between the X-shooter spectra and Mira variables warrants a deeper look. Mira variables are cool giants of M-type, which show regular variability and periodicities of more than a few 100 days, along with amplitudes of ≥2.5 mag (Percy 2007). To address the possibility of J085039’s optical companion indeed being a Mira variable, we looked for evidence of variability in the optical regime. Based on the ASAS-SN light curve (Johnson V-band, ∼520 nm), UCAC2 13726137 has been reported to show semi-periodic photometric variability with a periodicity of ∼39.24 d (Jayasinghe et al. 2021). The light curve is displayed in Fig. 7, confirming a semi-regular variability with an amplitude of about ±0.1 mag. According to Jayasinghe et al. (2021), it was therefore classified as a semi-regular variable star (SRV). These objects are late spectral type giants or supergiants showing variability (Samus et al. 1997; Percy 2007). They differ from Mira variables in their lower variability amplitude and less regular periodic behaviour. It is unclear, however, what this periodicity pertains to in the specific case of UCAC2 13726137. With Mira variables, the periodic change in brightness is attributed to the expansion and contraction of these M giants, which is also responsible for the presence of the emission lines. A similar scenario can be invoked for SRVs (Moon 2008; Kiss et al. 1999).
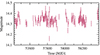 |
Fig. 7. ASAS-SN light curve of J085039. The light curve displays a semi-periodic variable behaviour. |
Although epoch folding (Leahy et al. 1983) on the publicly available ASAS-SN data does not yield a significant periodicity (and so we did not use it to attempt to obtain any orbital constraints), the ASAS-SN light curve serves to confirm the variable nature of the star. Semi-regular variables are generally classified into four subclasses based on the kind of variability observed: SRa, SRb, SRc, and SRd, with their typical features listed in Table 5, based on the General Catalogue of Variable Stars (GCVS; Samus et al. 1997; Samus’ et al. 2017). This confirms that there are indeed supergiants that are classed as ‘semi-regular’. Although we do not find many precedents for M supergiant emission line spectra, they are not unheard of, as can be seen in the case of the unusually late-type red supergiant WOH G64 discussed by Levesque et al. (2009). The emission lines in this object are attributed to the circumstellar environment, with the suggested dominant source of ionisation being shock heating due to pulsations. These are both common characteristics of M supergiants (Skinner & Whitmore 1988), not unlike the variable stars discussed above. Moreover, as Skinner & Whitmore (1988) reiterate, the lack of significant variability in the optical regime is insufficient evidence for the absence of pulsations, since red supergiants peak in the infrared, where we have sparse monitoring data.
Four subclasses of semi-regular variables and how they are classified.
The alternative scenario for WOH G64 explored by Levesque et al. (2009) is a binary nature of the system, which still needs probing into in our case. As briefly mentioned above, SySts and SyXBs are observed to have cool spectra with emission lines due to the hot companion. We therefore explored the emission lines that are typically observed in this case. Early studies of symbiotic binaries (Proga et al. 1994) have reported several He I lines in emission, although (at the time) the ionising region was simply considered to be a hot nebula and not an accreting compact object. Balmer lines are also seen in emission in Miras (Fox et al. 1984) and several SySts (Miszalski et al. 2013), while accreting X-ray binaries show at least Hα in emission (e.g. Torres et al. 2015; Bassa et al. 2009). In the latter case, they are often taken as an indicator for the presence of an accretion disk (Fender et al. 2009, and references therein). A prototypical SyXB hosting a neutron star is GX 1+4, which has a rich emission line spectrum (Davidsen et al. 1977) attributed to a persistent accretion disk, but the Fe II line forest around its Hα line seen there is not found in the X-shooter spectra of UCAC2 13726137; neither are the instances of [Fe] emission. Some metallic lines from Mg I and Fe I are observed in emission in Miras (Yao et al. 2017), while the many Fe II emission lines that are visible in the X-shooter optical spectra, are, in fact, consistent with semi-regular variable spectra (Jaschek & Jaschek 1995). However, the emission line spectrum does show lines that require a hot ionising plasma, such as He II at 4686 Å, which cannot simply be explained by intrinsic variability of the supergiant. The corresponding lack of X-ray variability cannot be explained at the moment.
Overall, we conclude that emission lines generated by intrinsic variability similar to what is seen in Miras and semi-regular variables could explain at least some of the lines observed in the spectra of UCAC2 13726137, considering that some of the higher ionisation lines typically observed in SySts and SyXBs are not seen here. However, the He II line indicates that there is further contribution due to the presence of the compact object and we speculate that this should be correlated to the X-ray behaviour of the source. Further study and detailed modelling needs to be conducted in order to fully disentangle the origin of these emission lines. We state here that we find it likely to entail a contribution from intrinsic variability of the donor star, in addition to photo-ionisation from the X-ray source.
4. Characterising the X-ray source
Having discussed the donor star in the previous section, we turn to a discussion of the properties of the X-ray source. We start in Sect. 4.1 with a study of the variability behavior, followed by a discussion of the X-ray spectral properties in Sect. 4.2.
4.1. Timing analysis
The underlying physics of an X-ray binary is driven by the nature of its compact object, which in most HMXBs, is typically a neutron star and not a black hole (Fortin et al. 2023). The most reliable way to confirm the presence of a neutron star is through the detection of pulsations (e.g. Torrejón et al. 2004; Reig et al. 2009).
The NuSTAR FPMA and FPMB light curves show the system to be in a state of relatively constant flux across the ∼55 ks long observation, as Fig. 8 shows. We searched for any period in the 0.1–6000 s band using epoch folding (Leahy et al. 1983) and a Z2 search (Buccheri et al. 1983; García et al. 2011), as well as a standard Fourier analysis and Lomb Scargle periodogram (Scargle 1982; Horne & Baliunas 1986). Searches were performed for the whole energy range of the detector, 3–79 keV, as well as for the 3–15 keV and 15–60 keV bands. We note that NuSTAR’s orbit results in gaps in the light curves every ∼90 minutes, leading to aliasing effects in the light curve analysis.
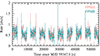 |
Fig. 8. 100s binned light curve of J085039. The light curve shows barely any variability within uncertainties. |
As an example of the analysis, Fig. 9 shows the epoch-folded events from detector FPMA in the range 1–6000 s, using the entire energy range of NuSTAR. Except for a peak at ∼5800 s, or 96 minutes, a signature of NuSTAR’s orbital period, no significant period is found. At lower frequencies, low statistics of the data and the dominance of NuSTAR’s orbit hinder robust detection of a signal. We also used the Z2-periodogram on event data to eliminate possible aliasing effects due to binning, to search for periods in the range from 0.01 to 600 s. Again, no significant periodicity was found.
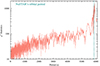 |
Fig. 9. Epoch-folded periodogram of barycentred event file from NuSTAR’s FPMA detector. The signal around ∼5800 s is most likely an effect of NuSTAR’s orbital period. |
To determine an upper limit on the amplitude of any undetected signal that may be present, we used the analytical approach of Brazier (1994). Beyond 200 s, the data are dominated by noise and the method is unable to compute reliable pulsed fractions at this point. For the range of 1–200 s, the pulsed fraction 3σ upper limit on a sinusoidal signal is 3.56%, in the 3–79 keV energy range. Pulse periods in this range simulated with NuSTAR’s time resolution and the estimated pulsed fraction appeared above the detection level.
4.2. Spectral analysis
4.2.1. Individual eROSITA spectra
While a detailed spectral analysis is not possible for the eROSITA spectra due to the low signal to noise ratio (S/N), we used the eROSITA data to estimate the source flux by fitting them with an absorbed power-law, applying Cash statistics (Cash 1979), and the absorption model of Wilms et al. (2000) with abundances therein, and with cross-sections from Verner et al. (1996). The resulting goodness of fit varies from case to case, with reduced C-statistics in the range 0.5–0.8, due to low counts. Moreover, the photon index is negative in two of the four cases and around ∼0.5 otherwise. The column density is in the range NH ∼ 1–2 × 1022 cm−2. We froze the photon index at 0.5 to determine fluxes. Over the two years of observations, the system showed no decrease in flux within uncertainties in the 0.2–10.0 keV range. This suggests that there is no (or, at most, marginal) variability, the average unabsorbed flux being ∼7.75 × 10⁻¹² erg cm−2 s−1. Adopting the ∼7.45 kpc distance, J085039 displays a stable luminosity of ∼5.14 × 1034 erg s−1 in the eROSITA band during the scans.
4.2.2. Describing the broadband continuum
To get a better handle on the overall spectral shape than from eROSITA alone, we turn our attention to the analysis of the joint NuSTAR and eROSITA data cumulated over the four eRASS scans. The spectra were re-binned to at least 25 counts in each bin.
We began the spectral analysis by modelling the 0.2–10.0 keV eROSITA spectrum and the 3–60 keV NuSTAR FPMA and FPMB spectra together with models typically used to describe the continuum of accreting binaries, including an absorption component TBabs (Wilms et al. 2000) to account for Galactic absorption in all models; again, here we adopted the cross-sections from Verner et al. (1996) and abundances from Wilms et al. (2000). The NuSTAR energy range is chosen as such, since the background dominates from 60 keV. The process is detailed in the following.
First, we use a simple power law model with a folding energy, cutoffpl in XSPEC-like notation,
 (3)
(3)
where F(E) is the photon flux, Γ is the photon index, Efold is the folding energy, and K is a normalisation constant. This model is typically used to phenomenologically describe Comptonised photons from either the polar caps of the neutron star or originating from the black hole’s corona. We used a constant multiplier to account for differences in the flux calibration between the two detectors of NuSTAR and eROSITA, referring all fluxes to NuSTAR-FPMA. We included a Gaussian emission line to the fit to model an evident feature in the Fe Kα band around 6.4 keV. This spectral model (hereafter Model 1a or M1a) results in reasonable fit statistics with χ2/d.o.f. = 853.43/706 and χred2 = 1.20, resulting in a photon index Γ ∼ 0.13; this is on the lower end of what is observed for accreting binaries (Fornasini et al. 2023). The folding energy, Efold ≃ 9 keV, is within the range of what has been observed for neutron star binaries (e.g. Müller et al. 2013; König et al. 2020), while it is lower than usual for black holes (McClintock & Remillard 2006).
We also used other continuum models that are typically applied to neutron star spectra (e.g. Müller et al. 2013; Diez et al. 2022), such as a Fermi-Dirac cutoff FDcut (Tanaka 1986) which results in reasonable fit statistics (χ2/d.o.f. = 795.51/51, χred2 = 1.12) or the negative-positive exponential model NPEX (Mihara et al. 1995), which results in better fit statistics χ2/d.o.f. = 777.43/704, χred2 = 1.10), but produces unconstrained parameters, with positive and negative photon indices of  and
and  .
.
Our spectral modelling reveals the possible presence of additional spectral components near 8 keV and above 30 keV in the residuals. Considering similar residuals, we adopted the simpler and better-known cutoffpl for further modelling to investigate them. Our initial fit with a cut-off power-law continuum and a neutral, homogeneous absorber shows strong residuals around the Fe K edge. We find that the prominent Fe K edge and continuum absorption are well modelled by a neutral partial covering absorber, modelled using pcfabs. The inclusion of the partial covering absorber (M1b) results in a better fit (χ2/d.o.f. = 731.65/704, χred2 = 1.04). We note that this is the only fit so far where the residuals do not show a dip around 8 keV, likely corresponding to an absorption edge. The corresponding photon index Γ ≃ 0.5 is higher than the previous value, perhaps hinting that the previous fit partly accounted for the absorption edge with a low photon index. However, we find that the model does not offer a good fit to the lowest eROSITA data point. Although the energy resolution and S/N of the eROSITA and NuSTAR spectra do not facilitate probing the ionization state of the absorbing medium, we replaced the neutral partial covering absorber with an ionised partial covering component zxipcf (M1c). This indeed results in improved fit statistics (χ2/d.o.f. = 698.23/703, χred2 = 0.99) and improves the modelling of the eROSITA data at the lowest energy bin. The corresponding photon index, Γ ≃ 0.8, is even higher, and the model predicts lower column density for the absorber, NH ≲ 1023 cm−2, but with a higher covering fraction. The usage of tbpcf to model the partial covering absorber resulted in very similar fit parameters, as with pcfabs.
We estimated the equivalent width of the Fe Kα line for the neutral partial covering model to be EW(FeKα)≃691 ± 45 eV, indicating strong fluorescence. Given the necessity for a strong absorber in the line of sight to account for the absorption edge evident in the spectrum, this is to be expected based on the assumption that the absorbing material is also responsible for fluorescence (Inoue 1985; Fürst et al. 2011). The ionised absorber zxipcf models the line with a more complex profile than we can resolve with NuSTAR; in particular, it includes an Fe absorption line at 6.7 keV, such that the Fe Kα emission line is narrower (EW(FeKα)≃345 ± 35 eV). The two scenarios also result in different NH values for the partial absorber (see Table 6). A stringent constraint on the column density would require disentangling the ionisation state of the absorber; thus, it cannot be carried out with the data at hand. Considering that the NuSTAR spectra cannot resolve the complex line profile modelled by zxipcf and that the errant eROSITA bin for Model 1b spans a wide energy range, we adopted the neutral partial covering absorber for further spectral fitting, with caveats as stated above.
Spectral parameters for different models used to fit the eROSITA and NuSTAR spectra, with 2σ confidence intervals.
We modified the continuum model (M1b) with the inclusion of cyclabs, a model that describes cyclotron absorption with a pseudo-Lorentzian profile, to probe the presence of cyclotron resonant scattering features (CRSFs) in the spectra (see, e.g. Truemper et al. 1978; Staubert et al. 2019). The fit statistics and residuals were not significantly improved by the inclusion of an absorption component at around 34 keV, indicating that a cyclotron component likely cannot be adequately resolved here (χ2/d.o.f. = 717.22/701). The fit was also conducted using gabs, a cyclotron absorption component with a Gaussian optical depth parameter, with similar results.
We find a discrepancy in the cross-calibration between eROSITA and NuSTAR of up to 40%. While part of this can be attributed to known calibration issues of the eROSITA hard band with instruments like XMM-Newton, which has then been used to get an indirect relation for NuSTAR by Migkas et al. (2024), this only amounts to about 3–5%. Since the eROSITA and NuSTAR observations are not contemporaneous, the difference in flux could also be source-intrinsic. Nevertheless, a discrepancy by a factor of ≲2 within the uncertainties is well within typical variability observed for wind accretors (Kretschmar et al. 2019).
4.2.3. ‘Best’ spectral fits
Our spectral fits M1a–c assume the same underlying continuum but differ in the modelling of the source-intrinsic absorption with regard to the geometrical and temporal variability as well as the possible degree of ionization. The question of the absorption model is primarily raised by strong residuals around the Fe K edge left in our simplest, fully covering, neutral absorption model M1a. Diagnostics about the absorbing medium are, however, hampered because of NuSTAR’s energy resolution and the limited soft coverage. As shown in Fig. 10, the models diverge mostly below 3 keV. Best-fit parameters are given in Table 6, with 90% confidence limits.
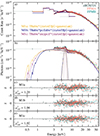 |
Fig. 10. NuSTAR and eROSITA spectra of J085039 from FPMA (teal) and FPMB (peach) fitted with three different models. The folded and unfolded models with individual model components are shown in panels (a) and (b), respectively. The χ2-residuals are shown for (c) Model 1a (M1a), the high-energy cutoff, (d) M1b, the high-energy cut-off including a partial absorber, and (e) M1c, the high-energy cutoff including an ionised absorber. |
We note that the baseline NH(tbabs) in all our evaluated models agrees within uncertainties, along with estimated intrinsic fluxes determined using the convolution model cflux, after fixing the parameters to their best-fit values for each model. The unabsorbed fluxes were obtained by setting the absorption contribution to zero. The partial covering models M1b and M1c contain a higher column density component that gives rise to a deeper Fe K edge, thereby resolving the modelling issues between 6–8 keV. Statistically, our analysis favors model M1c, but we note that the choice of the absorption model has only a marginal effect on the derived source luminosity.
5. Discussion
The results of the previous sections can be summarized as follows:
-
J085039 was detected in each eROSITA scan, displaying a persistently bright flux.
-
The spectroscopic and photometric data of the optical counterpart reveal an M2–3 supergiant donor, with several transient emission lines. This indicates that the X-ray binary in question is an HMXB, albeit an unusual one.
-
The persistent nature of J085039 and its late-type supergiant companion place it in a sparsely populated class of only two in the Galaxy.
-
The hard photon index, cut-off energy, and luminosity all favor a neutron star as the accreting object.
-
We did not detect pulsations in the NuSTAR light curves, but suggest that pulsations longer than 200 s would not be detected due to the low sensitivity of the observation to pulsations in that period range. Such larger spin periods are commonly seen in X-ray binaries with late-type companions or obscured HMXBs.
-
The detection of a strong Fe Kα line with EW(FeKα)∼700 eV is indicative of obscuration of the X-ray source by the wind of the supergiant companion or other circumstellar material.
-
The presence of circumstellar material in the system is also consistent with a red supergiant companion that shows intrinsic variability.
In the following, we discuss each of the above points in more detail.
5.1. Persistent X-ray luminosity
We use the estimated geometric distance of  kpc, as obtained from Bailer-Jones et al. (2021) for our luminosity estimates8. For completeness, the photogeometric distance is
  kpc (Bailer-Jones et al. 2021).
The unabsorbed 0.2–55 keV luminosity of J085039, estimated using the adopted distance of 7.45 kpc and the model assumptions discussed in Sect. 4.2, is ∼2.1–3.1 × 1035 erg s−1. As shown in Fig. 2, the flux state is consistent between the eROSITA scans. A similar luminosity is reported by De+24, using the Swift/XRT data, consistent within the uncertainties despite the difference in the adopted distances. Although a drop in flux between these observations would not have been noticed, the fact that each detection of J085039 finds it at the same flux lends credence to its higher duty cycle at this flux state.
Furthermore, the Swift/BAT light curve of J085039 displays consistently low flux ≲2 mCrab for its entire duration of 13 years, corresponding to an average 14–195 keV flux of ∼1.2 × 10⁻¹¹ erg cm−2s−1. The lack of Swift/BAT detections of any outbursts from J085039 over 13 years supports its persistent nature at ∼1035 erg s−1. Moreover, J085039 displays consistent flux levels between Swift/BAT and the eROSITA snapshots and NuSTAR observation nearly four years later. The non-detections with ROSAT and INTEGRAL are also consistent with this low flux (see Table 2), placing this source closer to the realm of persistent HMXBs than transients.
5.2. The optical picture: Spectral type and emission lines
As detailed in Sect. 3, we determined the spectral type and luminosity class of J085039 to be an M2–3 type supergiant. We used TiO indices defined by Kenyon & Fernandez-Castro (1987) to compute the spectral type, finding that a K type scenario is inconsistent with the strength of TiO bands at 6180 Å and 7100 Å (among others) in the optical and NIR X-shooter spectra. We then used the absorption features of Ti I, Fe I, and CN, the first CO overtone CO(2, 0), as well as other diagnostics also used by De+24 to confirm that the optical counterpart to J085039 is indeed a late-type supergiant, as suggested by De+24. This makes J085039 only the second known Galactic X-ray binary with a red supergiant companion, in addition to 4U 1954+31 (Hinkle et al. 2020).
We then investigated the likely cause of the many emission lines present in the X-shooter spectra of UCAC2 13726137, finding them similar to those present in variable stars like Miras (Wood 1990; Castelaz et al. 2000) or the less well-defined class of SRVs (Jaschek & Jaschek 1995). Alternate scenarios where the emission lines are solely due to accretion were found insufficient to explain the whole picture since the X-shooter spectra do not show the many high ionisation state emission lines typically observed in the spectra of SyXBs such as GX 1+4 (Davidsen et al. 1977) or IGR J17329−2731 (Bozzo et al. 2018). Instead, most of the lines we observed in emission have been observed in variable stars (see Sect. 3 for details).
Nevertheless, the presence of the He IIλ4686 line in emission, indicates a hard ionizing source in the system. For instance, He II has been associated with an accretion disk around the compact companion, in a handful of cases (Fornasini et al. 2023). However, Roche Lobe overflow (RLOF) is thought to be the predominant accretion mode in these systems (Kretschmar et al. 2019, and references therein), which we do not consider likely for J085039. Transient accretion disks that have been observed in some HMXBs (Sidoli & Paizis 2018) could still explain the presence and intrinsic variability of the He II emission lines, although this also comes with periods of enhanced luminosity. He II emission has also been associated with nebular emission in a handful of symbiotic stars (Merc et al. 2019). In comparison to He II, there is much more variability in the Hα emission line (see Fig. 5). Since this is difficult to reconcile with the low variability of the X-ray source, we suggest that it could arise from the late-type companion, as has been observed in variable M giants. The caveat is that there is much less precedence for supergiant systems with similar optical spectra, although there are certainly some examples (Levesque et al. 2009). A scenario where the compact object is in a low-eccentricity orbit around the massive star, allowing for persistent accretion where the shape and intensity of the emission lines in the optical spectra are primarily due to geometric effects (e.g. inclination and viewing angle) is not out of the question. However, a monitoring campaign in both optical and X-ray regimes would be required to confirm this.
5.3. Evolutionary track and likely accretion mode
Although there is precedence for a binary system with a compact object accreting from a red supergiant (Hinkle et al. 2020), we attempt to trace such a system’s journey by considering typical binary evolution scenarios. There are three scenarios that can result in a system hosting an RSG and a compact object (e.g. Han et al. 2020, their Fig. 1). In each case, the binary system starts off consisting of two massive stars and the preceding stage to the RSG phase is a wind-accreting HMXB phase. One of the scenarios involves a common envelope phase which then results in a binary system with a Helium star and a main sequence star. But in each case, there is a stage of mass transfer where a He star accretes from a main sequence companion, eventually undergoing a supernova explosion and resulting in a HMXB with wind accretion. Depending on its initial mass, after leaving the main sequence, the massive companion star becomes a red supergiant resulting in this particular stage of binary evolution. This phase is comparably short since the RSG phase is marked by a significant amount of mass loss, resulting in a second supernova, eventually giving rise to a double compact binary. Although this is not explained in further detail by Han et al. (2020), RSG+CO phase is assumed to have mass transfer via RLOF; however, as mentioned above, we do not observe any indication of this. We therefore assume that the primary mode of mass transfer is wind accretion.
De+24 suggested that the observed X-ray luminosity of J085039 implies unrealistically large binary separations of a ∼ 25 000 R⊙. We used the same accretion efficiency coefficient, η = 0.2, and using LX = ηṁc2 (Longair 2011) and obtained a mass accretion rate onto the compact object of ṀNS = 1.72 × 10¹⁵ g s−1, adopting an X-ray luminosity of 3 × 1035 erg s−1. With the assumption of Bondi-Hoyle-Lyttleton accretion (Bondi & Hoyle 1944; Edgar 2004) and a circular orbit around the donor star,
 (4)
(4)
where G is the gravitational constant. Here, MNS is the mass of the neutron star, which we assume to be 1.4 M⊙, it is possible to obtain a reasonable binary orbital separation of a ≲ 2000 R⊙, for a mass loss rate of Ṁwind = 10−8 M⊙ yr−1 (Beasor et al. 2020), adopting a slightly higher mass of the red supergiant (see Levesque 2017, for a wide range of possible radius and mass values). The relative velocity, vrel, requires us to take into account both the orbital velocity of the neutron star and the stellar wind velocity, vwind, for which we assume a typical value of about ∼20 km s−1 (Goldman et al. 2017), as in the work by De+24.
5.4. The compact object
X-ray emission arising from Comptonisation occurring near the compact object’s surface or corona, phenomenologically modelled using cutoffpl, was found to describe the data well. It would be in line with both neutron star and black hole binary spectra (van der Klis 1994; Di Salvo et al. 2006). However, the photon index, Γ ≃ 0.5, is significantly harder than typical values for black hole binaries (McClintock & Remillard 2006; Xu et al. 2019; Fabian et al. 2020), for which Γ ∼ 1.5–2.0 range. The low folding energy, Efold ≃ 8 keV, is also rather unusual for black hole binaries where the exponential cutoff is expected between 30–100 keV (McClintock & Remillard 2006), while neutron star binaries do show similar values (see Fig. 1.9 of Falkner 2018).
The observed X-ray luminosity of the order of a few 1035 erg s−1 is atypical for black hole binaries (Barillier et al. 2023), which appear at much lower luminosities ≲1032 erg s−1 when in quiescence (e.g. Carpano et al. 2022), if even detected. Furthermore, evolutionary predictions for binary systems hosting red supergiants with black hole companions imply that this stage of binary evolution is extremely short-lived and is very unlikely to be observed (Klencki et al. 2021).
A white dwarf accretor should also be considered, since the optical spectra show striking resemblance to those of SySts (white dwarfs accreting from late-type giants). The vast majority of SySts have soft X-ray spectra (Luna et al. 2013), such as StHα 32 (Orio et al. 2007), but there have also been detections of sources with harder X-ray emission, even exceeding 20 keV like RT Cru (Chernyakova & Malyshev 2020; Tueller et al. 2005). The corresponding X-ray spectra are also highly absorbed and it is speculated that the hard X-ray emission arises at the truncation radius of the accretion disk (Luna et al. 2013). However, the relatively higher luminosity of J085039, also rules out a white dwarf as the compact object. The maximum X-ray luminosities observed for white dwarf symbiotic systems are only up to a few times ∼1033 erg s−1 (Luna et al. 2013), while J085039 is brighter by a factor of ∼100.
The handful of other X-ray binaries where the donor is a red supergiant – 4U 1954+31 (Hinkle et al. 2020) and the extragalactic NGC 300 ULX-1 (Heida et al. 2019) – both contain neutron stars for which pulsations have been detected. This is too limited a sample to serve as a convincing argument, but we conclude on J085039 most likely containing an accreting neutron star compact object by exclusion, following the preceding discussion of alternative scenarios. Furthermore, based on the evolutionary tracks and characteristic ages of red supergiants, the accreting neutron star should be highly magnetised with magnetic fields of the order of a few 1012 G (Tauris & van den Heuvel 2023; Han et al. 2020).
5.5. Comparison to 4U 1954+31 and other HMXBs
As an X-ray binary with a red supergiant donor suspected to host a neutron star, J085039 merits a comparison with the only other Galactic system known to fit this configuration, 4U 1954+31. This system has long been studied as a SyXB (Enoto et al. 2014; Marcu et al. 2011) since it was thought to contain an M giant donor, until revised optical identification by Hinkle et al. (2020) revealed an M supergiant donor instead. It has been observed at similar X-ray luminosities to J085039, but also shows flaring behaviour (Enoto et al. 2014; Bozzo et al. 2022a), reaching upto luminosities of 1036 erg s−1. Its broadband X-ray spectrum has been modelled with a variety of spectral models over the years (Marcu et al. 2011; Enoto et al. 2014; Bozzo et al. 2022a), but is typically found to have a hard spectrum with an Fe Kα emission line and often requires a partial covering absorber.
Another candidate is CXO 174528.79−290942.8, which was discovered as a result of infrared identification of X-ray binaries in the Galactic Centre and was proposed to contain a red supergiant donor by Gottlieb et al. (2020). Although the NuSTAR observation of the source only yielded ∼400 counts, spectral parameters reported indicate a very hard spectrum with a photon index, Γ ∼ 0.7 (Hong et al. 2016), similar to the X-ray spectrum of J085039.
Since X-ray binaries with red supergiant companions constitute a very small fraction of HMXBs, they have so far either been considered part of SyXBs (De et al. 2022, 2024) or SgXBs (Hinkle et al. 2020; Bozzo et al. 2022a). However, based on binary evolution scenarios (as summarised by Han et al. 2020), it is evident that X-ray binaries hosting a compact object accreting from an RSG and those accreting from M giants or asymptotic giant branch (AGB) stars follow two completely separate evolutionary tracks. The M supergiant donors of J085039 and 4U 1954+31 imply vastly different mass loss rates and orbital parameters from those with M giant donors (and similarly for O/B-type supergiant donors), so that classifying them under either subclass might be misleading. There are, however, common features between these systems in the context of X-ray observations, especially since persistent wind accretion and high obscuration due to clumpy wind are well-studied phenomena in SgXBs. Additionally, the expected magnetic field estimates for the accreting neutron star are similar for each subclass. One caveat is that there is only one robust detection of a magnetic field estimate among known SyXBs, that of IGR J17329−2731, which was reported by Bozzo et al. (2018) to be ∼2.4 × 10¹² G; however, they are generally suspected to host highly magnetised neutron stars owing to their long pulse periods (Lü et al. 2012). Nevertheless, since the sample of sources with a similar configuration to J085039 is rather limited and since the underlying origin of the X-ray emission is supposed to be from the vicinity of an accreting neutron star, we attempted to contrast the observations against a wider variety of source types where this assumption holds.
The NuSTAR spectrum of J085039 deviates from the typical spectra of Sy/SgXBs, which exhibit sharp cut-offs (e.g. Barthelmy et al. 2005; Hemphill et al. 2019), as opposed to the high energy flattening and rising of the spectra seen in low-luminosity BeXRBs (Sokolova-Lapa et al. 2021). Both examples are shown in Fig. 11, where we compare the NuSTAR spectrum of J085039 with those of a handful of different HMXBs, X Persei (Doroshenko et al. 2012), the aforementioned 4U 1954+31, two SgXBs 4U 1700−37 (Bala et al. 2020) and 4U 1538+22 (Hemphill et al. 2019), the SyXB IGR J17329−2731 (Bozzo et al. 2018), the persistently wind accreting system GX 301−2 with a hypergiant companion (Islam & Paul 2014; Zalot et al. 2024), and the SFXT IGR J16418−4532 (Islam et al. 2023, where the same NuSTAR observation is studied for timing results). The spectral shape of J085039 notably does not match that of 4U 1954+31, with the absorption severely modifying the soft spectrum and the latter’s cutoff at high energies. On the other hand, 4U 1954+31 has a similar spectrum to IGR J16418−4532. The high obscuration is present in both SgXBs and SyXBs. Overall, the spectra in Fig. 11 serve to convey the inhomogeneous nature of the X-ray spectra of HMXB subclasses, while commonality can be found between different types, perhaps hinting at the need for something in addition to subclass as a discerning factor, while affirming the relative uniqueness of J085039 as an HMXB.
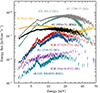 |
Fig. 11. X-ray spectrum eRASSU J085039 (teal) shown along with NuSTAR spectra of a few other HMXBs for comparison: X Persei, a persistent BeXRB displaying low luminosity accretion in yellow (Doroshenko et al. 2012), two SgXBs 4U 1700−37 in grey (Bala et al. 2020), and 4U 1538+22 in blue (Hemphill et al. 2019), a SyXB IGR J17329−2731 in red (Bozzo et al. 2018), the persistent, albeit brighter wind-accretor GX 301−2 in light green (Islam & Paul 2014; Zalot et al. 2024), and the SFXT IGR J16418−4532 in purple (Islam et al. 2023). FPMA and FPMB spectra have been illustrated using different shades of the same colour. The strong iron line in J085039 is comparable to that of the obscured systems and one of the SyXBs. These spectra each correspond to luminosities of 1035 erg s, with the exception of GX 301−2, which is brighter by a factor of ∼10. |
5.6. Low luminosity persistent XRB?
De+24 proposed that J085039 is in the propeller regime, based on the donor’s estimated mass loss rate, which they deemed incompatible with the observed X-ray luminosity. Following the results of De+24, the study by Afonina & Popov (2024) explored the possibility of J085039 being in the propeller state by applying spin-down models. The latter authors concluded that such a propeller stage would be too short an evolutionary phase to provide a high enough probability to observe such a system.
Spectral signatures of the propeller regime have not yet been established in literature. The sources where centrifugal inhibition of accretion has been suggested were reported to show a spectral transition at the low luminosity state, with the spectrum tapering off around 5–6 keV (Tsygankov et al. 2017b, although this is difficult to disentangle from simply low counting statistics). This is inconsistent with the NuSTAR spectrum of J085039, where we observe hard X-ray emission up to 55 keV. On the other hand, a scenario where accretion is allowed to a certain extent, as is in the case of magnetic inhibition (first described as a subsonic propeller by Davies et al. 1979; Davies & Pringle 1980), has been observed in many HMXBs, including the SFXTs (Shakura et al. 2015). The case where some matter can still penetrate onto the surface of the magnetic field is certainly compatible with the observed hard X-ray emission and luminosity of J085039. This is the only model proposed by Afonina & Popov (2024) as being realistic with respect to J085039.
The estimated luminosity of ∼2–3 × 1035 erg s−1 (see Sect. 5.1) is consistent with that of several HMXBs, namely: wind-accreting SgXBs such as GX 301−2, 4U 1538−52, 4U 1909+07, and IGR J19140+0951 (see Sidoli & Paizis 2018, and references therein). This also includes some BeXRBs such as GX 304−1, GRO J1008−57, and A0535+262 (Rouco Escorial et al. 2018; Lutovinov et al. 2021; Tsygankov et al. 2019), detected at comparable luminosities outside of outbursts. Then, SFXTs, characterised by very low quiescent luminosities of 1032–1033 erg s−1 and high dynamic ranges of 102–105 (Sidoli 2013), have also been detected at intermediate luminosities of 1035 erg s−1 (Romano et al. 2009; Drave 2013). Finally, the red-SgXB, 4U 1954+31 has been observed at luminosities of 1033–1035 erg s−1 (Enoto et al. 2014; Bozzo et al. 2022a).
The above examples serve to emphasise that stable accretion onto a highly magnetised neutron star as found in HMXBs, at low and intermediate luminosities, has been observed across all subclasses. However, there are only a few cases where the luminosity remains stable without flaring or outbursting activity. While this might be an observational effect, it is still surprising in comparison to sources which show dynamic ranges of at least a factor of ∼10, even with similarly low cadence of observations (Sidoli & Paizis 2018). This picture of so-called ‘low luminosity’ accretion is a matter of current study within each subclass. Tsygankov et al. (2017a) proposed accretion from a cold non-ionised disk to explain ongoing quiescent (i.e. outside of outburst) accretion in BeXRBs. For SFXTs, the physical scenario proposed is the settling accretion regime, whereby the slowly rotating neutron star accretes quasi-spherically (Shakura et al. 2012, 2018) and is inhibited by a quasistatic shell above the magnetosphere at low mass accretion rates; this is due to inefficient cooling of the infalling matter, leading to a reduction in overall X-ray luminosity (Bozzo et al. 2015; Sidoli et al. 2023). A similar consideration is applied to SyXBs, with accommodations for the lower wind velocities of the M giant donors (Yungelson et al. 2019).
5.7. The Fe Kα line and obscuration
The spectra necessitate a partial covering absorber for an acceptable spectral fit, with an NH between ∼75–240 × 1022 cm−2. Physical scenarios producing such an effective partial covering absorption are plausible and include, for example, a short-term variability of the absorption column that is averaged in a longer observation or radiation scattered into the line of sight via different paths through the absorbing medium. However, quantitative interpretations of these parameters, including the ionization parameter, requires several assumptions about the composition, geometrical dimensions, and density of the absorber. These properties cannot be validated reliably given our limited knowledge about the source and quality of the observational X-ray data.
The obscuration may be interpreted as being due to the compact object being embedded in a stream of stellar wind from the companion star. This is a scenario often invoked for classical SgXBs, some examples of which are IGR J16320−4751 (Walter et al. 2003), IGR J16393−4643 (Rodriguez et al. 2003), and IGR J17252−3616 (Zurita Heras et al. 2006). All of these have been classified as highly obscured HMXBs following their detections in the INTEGRAL survey. Consequently, at comparable luminosities, several SgXBs have strong Fe Kα emission lines in their X-ray spectra, with EW(Fe Kα) reaching well beyond 1 keV, provided the corresponding column density is sufficiently high (Pradhan et al. 2018, and references therein). The observed absorption for J085039 is still about an order of magnitude higher and is comparable to the highly obscured IGR J16318−4848 (Filliatre & Chaty 2004; Ballhausen et al. 2020), which has an sgB[e] companion. Although the stellar wind properties differ vastly between early and late-type supergiants, there is an evolutionary link between sgB[e] stars and red supergiants, as the former are considered to either be in a pre-RSG phase or a post-RSG phase (Wit et al. 2014), with circumstellar dust being a common property between the two stages of massive star evolution (Stencel et al. 1987). The presence of dusty clumpy winds might explain the high obscuration in the system, but more information on the absorber can only be obtained from a longer, high-resolution soft X-ray observation, which is outside the scope of this study.
5.8. Non-detection of pulsations
Although the high likelihood of J085039 to be a neutron star has been established, the non-detection of pulsations must be addressed. The absence of detectable pulsations is not markedly unusual, since not all known neutron star HMXBs show pulsations (see the catalogues of Neumann et al. 2023; Fortin et al. 2023). This is, in particular, the case for sources where heavy obscuration by surrounding material is detected, such as 4U 2206+54 (Reig et al. 2009), whose long pulse period was detected several decades after its initial discovery. Wind-fed obscured SgXBs, IGR J16320−4751 and OAO 1657−415, are other examples of sources where pulsations are smeared out by high levels of absorption (Varun 2023; Pradhan et al. 2014).
The other Galactic red-SgXB, 4U 1954+31 has a notoriously long spin period of 5.4 h (Corbet et al. 2008; Enoto et al. 2014). However, the ULX with a red supergiant donor, NGC 300 was detected to have a rather short spin period of ∼32 s (Heida et al. 2019). Nevertheless, other HMXBs that spend most of their duty cycle at a comparable luminosity state, such as those discussed in Sect. 5.6, have spin periods between 100–10 000 s. In fact, those presented in Fig. 11 have spin periods ranging from 526 s to 5.4 h (in ascending order of spin period; Davison et al. 1977; White et al. 1976a,b; Bozzo et al. 2018; Corbet et al. 2008). We did not detect a significant signal in this range (see Fig. 9). Therefore, the non-detection of a long rotation period that may be present as a weak signal in the data cannot be ruled out.
De+24 suggested that J085039 is in the propeller regime and should correspondingly spin with a very short pulsation period. However, as shown in Sect. 4.1, we did not detect any significant pulsations in this range.
6. Conclusions
In conclusion, 1eRASS J085039.9−421151 is among the new X-ray binaries to be studied in detail as a result of X-ray surveys of the entire sky. It was first examined by De+24 based on the Swift/BAT survey, followed by the present work, where the effort was motivated by follow-up of bright sources detected by eROSITA. Along with the discovery of SRGA J124404.1, the discovery of J085039 possibly hints at the advent of a class of low-luminosity persistent X-ray binaries whose detections are facilitated by eROSITA. We suggest that J085039 is a neutron star binary, given its spectral parameters and the spectral type of the companion star. We confirm it as a late-type supergiant, in accordance with De+24, although with a later spectral type of M2–3. The X-ray spectrum is well described by an absorbed power law with a high energy cutoff as well as by Comptonisation of soft photons from the magnetic poles of a neutron star, with heavy obscuration occurring in the surrounding medium. We did not detect any periodic variability with NuSTAR, but suggest that a signal beyond 200 s (which is where we would expect a signal from both neutron stars accreting from late-type giants and supergiants and heavily obscured systems) is likely present and goes undetected due to insufficient counting statistics provided by the data at low frequencies. The detection of the pulse period would require deeper X-ray observations. In general, we find the NuSTAR light curves fairly stable, as they display no significant variability. An improved understanding of the physics at work here requires a comparison to the light curves of other HMXBs at similarly stable low-luminosity states, which is beyond the scope of the current study. Unveiling the geometry of the absorber would require more sensitive X-ray observations in the soft energy band that are most affected by absorption and the strong iron line, with an instrument such as XMM-Newton, or the Resolve instrument on board the recently launched XRISM observatory (XRISM Science Team 2020). Longer optical observations are required to study the orbital parameters of the system.
The source name at the time of proposed follow-up was eRASS U J084850−420035 and has since been updated based on improved astrometry.
De+24 adopt a value of ∼12 kpc using the Gaia parallax, making our luminosity estimates not directly comparable.
Acknowledgments
We thank the members of the XMAG collaboration for fruitful discussions regarding this work. We thank Amy Lien for providing us with the 157-Month Swift/BAT lightcurve. We thank the anonymous referee for their useful comments that vastly improved this paper. We acknowledge funding from the Deutsche Forschungsgemeinschaft within the eROSTEP research unit under DFG project number 414059771. RB and JBC acknowledge support by NASA under award number 80GSFC21M0002. CMD acknowledges support from the European Space Agency as an ESA Research Fellow. JW and ESL acknowledge support from Deutsche Forschungsgemeinschaft grant WI 1860/11-2. This work is based on data from eROSITA, the soft X-ray instrument aboard SRG, a joint Russian-German science mission supported by the Russian Space Agency (Roskosmos), in the interests of the Russian Academy of Sciences represented by its Space Research Institute (IKI), and the Deutsches Zentrum für Luft- und Raumfahrt (DLR). The SRG spacecraft was built by Lavochkin Association (NPOL) and its subcontractors, and is operated by NPOL with support from the Max Planck Institute for Extraterrestrial Physics (MPE). The development and construction of the eROSITA X-ray instrument was led by MPE, with contributions from the Dr. Karl Remeis Observatory Bamberg and ECAP (FAU Erlangen-Nuernberg), the University of Hamburg Observatory, the Leibniz Institute for Astrophysics Potsdam (AIP), and the Institute for Astronomy and Astrophysics of the University of Tübingen, with the support of DLR and the Max Planck Society. The Argelander Institute for Astronomy of the University of Bonn and the Ludwig Maximilians Universität Munich also participated in the science preparation for eROSITA. The eROSITA data shown here were processed using the eSASS/NRTA software system developed by the German eROSITA consortium. We thank the NuSTAR Science Operations Centre (SOC) for their invaluable help in the quick scheduling of the observations. This research has made use of ISIS functions (ISISscripts) provided by ECAP/Remeis observatory and MIT (https://www.sternwarte.uni-erlangen.de/isis/). This research has made use of data, software and/or web tools obtained from the High Energy Astrophysics Science Archive Research Center (HEASARC), a service of the Astrophysics Science Division at NASA/GSFC and of the Smithsonian Astrophysical Observatory’s High Energy Astrophysics Division. This research has made use of the Vizier and HEASARC database systems for querying objects and getting information from different catalogues. Optical analysis was carried out based on observations collected at the European Organisation for Astronomical Research in the Southern Hemisphere under ESO programmes 105.20DA.001 and 106.21B1.001, which were taken from the ESO archive. This work has made use of data from the European Space Agency (ESA) mission Gaia (https://www.cosmos.esa.int/gaia), processed by the Gaia Data Processing and Analysis Consortium (DPAC, https://www.cosmos.esa.int/web/gaia/dpac/consortium). Funding for the DPAC has been provided by national institutions, in particular the institutions participating in the Gaia Multilateral Agreement. SIMBAD database, operated at CDS, Strasbourg, France, was also used to get additional information. This publication also makes use of data products from the Two Micron All Sky Survey, which is a joint project of the University of Massachusetts and the Infrared Processing and Analysis Center/California Institute of Technology, funded by the National Aeronautics and Space Administration and the National Science Foundation.
References
- Afonina, M. D., & Popov, S. B. 2024, Universe, 10, 205 [NASA ADS] [CrossRef] [Google Scholar]
- Aret, A., Kraus, M., Muratore, M. F., & Borges Fernandes, M. 2012, MNRAS, 423, 284 [NASA ADS] [CrossRef] [Google Scholar]
- Atwood, W. B., Abdo, A. A., Ackermann, M., et al. 2009, ApJ, 697, 1071 [CrossRef] [Google Scholar]
- Avakyan, A., Neumann, M., Zainab, A., et al. 2023, A&A, 675, A199 [NASA ADS] [CrossRef] [EDP Sciences] [Google Scholar]
- Bagnulo, S., Jehin, E., Ledoux, C., et al. 2003, The Messenger, 114, 10 [Google Scholar]
- Bahramian, A., & Degenaar, N. 2023, Low-Mass X-ray Binaries (Springer Living Reference Work), 120 [Google Scholar]
- Bailer-Jones, C. A. L., Rybizki, J., & Fouesneau, M. 2021, ApJ, 161, 147 [CrossRef] [Google Scholar]
- Bala, S., Roy, J., & Bhattacharya, D. 2020, MNRAS, 493, 3045 [CrossRef] [Google Scholar]
- Ballhausen, R., Lorenz, M., Fürst, F., et al. 2020, A&A, 641, A65 [NASA ADS] [CrossRef] [EDP Sciences] [Google Scholar]
- Barillier, E., Grinberg, V., Horn, D., et al. 2023, ApJ, 944, 165 [NASA ADS] [CrossRef] [Google Scholar]
- Barthelmy, S. D., Barbier, L. M., Cummings, J. R., et al. 2005, Space Sci. Rev., 120, 143 [Google Scholar]
- Bassa, C. G., Jonker, P. G., Steeghs, D., & Torres, M. A. P. 2009, MNRAS, 399, 2055 [NASA ADS] [CrossRef] [Google Scholar]
- Beasor, E. R., Davies, B., Smith, N., et al. 2020, MNRAS, 492, 5994 [Google Scholar]
- Boller, T., Freyberg, M. J., Trümper, J., et al. 2016, A&A, 588, A103 [NASA ADS] [CrossRef] [EDP Sciences] [Google Scholar]
- Bondi, H., & Hoyle, F. 1944, MNRAS, 104, 273 [Google Scholar]
- Bozzo, E., Romano, P., Ducci, L., Bernardini, F., & Falanga, M. 2015, Adv. Space Res., 55, 1255 [NASA ADS] [CrossRef] [Google Scholar]
- Bozzo, E., Bahramian, A., Ferrigno, C., et al. 2018, A&A, 613, A22 [NASA ADS] [CrossRef] [EDP Sciences] [Google Scholar]
- Bozzo, E., Ferrigno, C., Oskinova, L., & Ducci, L. 2022a, MNRAS, 510, 4645 [NASA ADS] [CrossRef] [Google Scholar]
- Bozzo, E., Romano, P., Ferrigno, C., & Oskinova, L. 2022b, MNRAS, 513, 42 [CrossRef] [Google Scholar]
- Brazier, K. T. S. 1994, MNRAS, 268, 709 [NASA ADS] [Google Scholar]
- Brunner, H., Liu, T., Lamer, G., et al. 2022, A&A, 661, A1 [NASA ADS] [CrossRef] [EDP Sciences] [Google Scholar]
- Buccheri, R., Bennett, K., Bignami, G. F., et al. 1983, A&A, 128, 245 [NASA ADS] [Google Scholar]
- Carpano, S., Haberl, F., Maitra, C., et al. 2022, A&A, 661, A20 [NASA ADS] [CrossRef] [EDP Sciences] [Google Scholar]
- Cash, W. 1979, ApJ, 228, 939 [Google Scholar]
- Castelaz, M. W., Luttermoser, D. G., Caton, D. B., & Piontek, R. A. 2000, AJ, 120, 2627 [NASA ADS] [CrossRef] [Google Scholar]
- Chernyakova, M., & Malyshev, D. 2020, in Multifrequency Behaviour of High Energy Cosmic Sources, ed. J. H. Beall, 45 [Google Scholar]
- Corbet, R. H. D., Sokoloski, J. L., Mukai, K., Markwardt, C. B., & Tueller, J. 2008, ApJ, 675, 1424 [NASA ADS] [CrossRef] [Google Scholar]
- Cutri, R. M., Skrutskie, M. F., van Dyk, S., et al. 2003, 2MASS All Sky Catalog of point sources [Google Scholar]
- Davidsen, A., Malina, R., & Bowyer, S. 1977, ApJ, 211, 866 [NASA ADS] [CrossRef] [Google Scholar]
- Davies, R. E., & Pringle, J. E. 1980, MNRAS, 191, 599 [NASA ADS] [CrossRef] [Google Scholar]
- Davies, B., Figer, D. F., Kudritzki, R., et al. 2007, ApJ, 671, 781 [NASA ADS] [CrossRef] [Google Scholar]
- Davies, R. E., Fabian, A. C., & Pringle, J. E. 1979, MNRAS, 186, 779 [NASA ADS] [CrossRef] [Google Scholar]
- Davison, P. J. N., Watson, M. G., & Pye, J. P. 1977, MNRAS, 181, 73 [Google Scholar]
- De, K., Chakrabarty, D., Soria, R., et al. 2022, ApJ, 928, L8 [NASA ADS] [CrossRef] [Google Scholar]
- De, K., Daly, F. A., & Soria, R. 2024, MNRAS, 528, L38 [Google Scholar]
- Di Salvo, T., Iaria, R., Robba, N., & Burderi, L. 2006, Chin. J. Astron. Astrophys. Suppl., 6, 183 [Google Scholar]
- Dicenzo, B., & Levesque, E. M. 2019, AJ, 157, 167 [NASA ADS] [CrossRef] [Google Scholar]
- Diez, C. M., Grinberg, V., Fürst, F., et al. 2022, A&A, 660, A19 [NASA ADS] [CrossRef] [EDP Sciences] [Google Scholar]
- Dorda, R., González-Fernández, C., & Negueruela, I. 2016a, A&A, 595, A105 [NASA ADS] [CrossRef] [EDP Sciences] [Google Scholar]
- Dorda, R., Negueruela, I., González-Fernández, C., & Tabernero, H. M. 2016b, A&A, 592, A16 [NASA ADS] [CrossRef] [EDP Sciences] [Google Scholar]
- Doroshenko, V., Ducci, L., Santangelo, A., & Sasaki, M. 2014, A&A, 567, A7 [NASA ADS] [CrossRef] [EDP Sciences] [Google Scholar]
- Doroshenko, V., Santangelo, A., Kreykenbohm, I., & Doroshenko, R. 2012, A&A, 540, L1 [NASA ADS] [CrossRef] [EDP Sciences] [Google Scholar]
- Doroshenko, V., Staubert, R., Maitra, C., et al. 2022, A&A, 661, A21 [NASA ADS] [CrossRef] [EDP Sciences] [Google Scholar]
- Drave, S. 2013, A&G, 54, 6.27 [NASA ADS] [CrossRef] [Google Scholar]
- Edgar, R. 2004, New A Rev., 48, 843 [CrossRef] [Google Scholar]
- Enoto, T., Sasano, M., Yamada, S., et al. 2014, ApJ, 786, 127 [NASA ADS] [CrossRef] [Google Scholar]
- Fabian, A. C., Buisson, D. J., Kosec, P., et al. 2020, MNRAS, 493, 5389 [NASA ADS] [CrossRef] [Google Scholar]
- Falkner, S. 2018, Ph.D. Thesis, Friedrich-Alexander-Universität Erlangen-Nürnberg, Germany [Google Scholar]
- Fender, R. P., Russell, D. M., Knigge, C., et al. 2009, MNRAS, 393, 1608 [NASA ADS] [CrossRef] [Google Scholar]
- Filliatre, P., & Chaty, S. 2004, ApJ, 616, 469 [NASA ADS] [CrossRef] [Google Scholar]
- Fornasini, F. M., Antoniou, V., & Dubus, G. 2023, arXiv e-prints [arXiv:2308.02645] [Google Scholar]
- Fortin, F., García, F., Simaz Bunzel, A., & Chaty, S. 2023, A&A, 671, A149 [NASA ADS] [CrossRef] [EDP Sciences] [Google Scholar]
- Fox, M. W., Wood, P. R., & Dopita, M. A. 1984, ApJ, 286, 337 [NASA ADS] [CrossRef] [Google Scholar]
- Fürst, F., Suchy, S., Kreykenbohm, I., et al. 2011, A&A, 535, A9 [NASA ADS] [CrossRef] [EDP Sciences] [Google Scholar]
- Gaia Collaboration (Prusti, T., et al.) 2016, A&A, 595, A1 [NASA ADS] [CrossRef] [EDP Sciences] [Google Scholar]
- Gaia Collaboration (Vallenari, A., et al.) 2023, A&A, 674, A1 [NASA ADS] [CrossRef] [EDP Sciences] [Google Scholar]
- García, J., Kallman, T. R., & Mushotzky, R. F. 2011, ApJ, 731, 131 [CrossRef] [Google Scholar]
- Gehrels, N., Chincarini, G., Giommi, P., et al. 2004, ApJ, 611, 1005 [Google Scholar]
- Goldman, S. R., van Loon, J. T., Zijlstra, A. A., et al. 2017, MNRAS, 465, 403 [Google Scholar]
- Gottlieb, A. M., Eikenberry, S. S., Ackley, K., DeWitt, C., & Marco, A. 2020, ApJ, 896, 32 [NASA ADS] [CrossRef] [Google Scholar]
- Gusinskaia, N. V., Russell, T. D., Hessels, J. W. T., et al. 2020, MNRAS, 492, 1091 [CrossRef] [Google Scholar]
- Han, Z.-W., Ge, H.-W., Chen, X.-F., & Chen, H.-L. 2020, RAA, 20, 161 [NASA ADS] [Google Scholar]
- Harrison, F. A., Craig, W. W., Christensen, F. E., et al. 2013, ApJ, 770, 103 [Google Scholar]
- Heida, M., Lau, R. M., Davies, B., et al. 2019, ApJ, 883, L34 [NASA ADS] [CrossRef] [Google Scholar]
- Hemphill, P. B., Rothschild, R. E., Cheatham, D. M., et al. 2019, ApJ, 873, 62 [NASA ADS] [CrossRef] [Google Scholar]
- Hinkle, K. H., Lebzelter, T., Fekel, F. C., et al. 2020, ApJ, 904, 143 [NASA ADS] [CrossRef] [Google Scholar]
- Hong, J., Mori, K., Hailey, C. J., et al. 2016, ApJ, 825, 132 [Google Scholar]
- Horne, J. H., & Baliunas, S. L. 1986, ApJ, 302, 757 [Google Scholar]
- Inoue, H. 1985, Space Sci. Rev., 40, 317 [CrossRef] [Google Scholar]
- Islam, N., & Paul, B. 2014, MNRAS, 441, 2539 [NASA ADS] [CrossRef] [Google Scholar]
- Islam, N., Corbet, R. H. D., Coley, J. B., Pottschmidt, K., & Fuerst, F. 2023, ApJ, 948, 45 [NASA ADS] [CrossRef] [Google Scholar]
- Jansen, F., Lumb, D., Altieri, B., et al. 2001, A&A, 365, L1 [NASA ADS] [CrossRef] [EDP Sciences] [Google Scholar]
- Jaschek, C., & Jaschek, M. 1995, The Behavior of Chemical Elements in Stars, 1st edn. (Cambridge University Press) [CrossRef] [Google Scholar]
- Jayasinghe, T., Kochanek, C. S., Stanek, K. Z., et al. 2021, MNRAS, 503, 200 [NASA ADS] [CrossRef] [Google Scholar]
- Kenyon, S. J., & Fernandez-Castro, T. 1987, AJ, 93, 938 [CrossRef] [Google Scholar]
- Kenyon, S. J., & Webbink, R. F. 1984, ApJ, 279, 252 [NASA ADS] [CrossRef] [Google Scholar]
- Kiss, L. L., Szatmáry, K., Cadmus, R. R., Jr, & Mattei, J. A. 1999, A&A, 346, 542 [NASA ADS] [Google Scholar]
- Klencki, J., Nelemans, G., Istrate, A. G., & Chruslinska, M. 2021, A&A, 645, A54 [EDP Sciences] [Google Scholar]
- Koljonen, K. I. I., & Russell, D. M. 2019, ApJ, 871, 26 [Google Scholar]
- König, O., Fürst, F., Kretschmar, P., et al. 2020, A&A, 643, A128 [NASA ADS] [CrossRef] [EDP Sciences] [Google Scholar]
- König, O., Saxton, R. D., Kretschmar, P., et al. 2022, Astron. Comput., 38, 100529 [CrossRef] [Google Scholar]
- Kretschmar, P., Fürst, F., Sidoli, L., et al. 2019, New Astron. Rev., 86, 101546 [Google Scholar]
- Lü, G.-L., Zhu, C.-H., Postnov, K. A., et al. 2012, MNRAS, 424, 2265 [CrossRef] [Google Scholar]
- Leahy, D. A., Elsner, R. F., & Weisskopf, M. C. 1983, ApJ, 272, 256 [Google Scholar]
- Lebrun, F., Leray, J. P., Lavocat, P., et al. 2003, A&A, 411, L141 [NASA ADS] [CrossRef] [EDP Sciences] [Google Scholar]
- Levesque, E. M. 2017, Astrophysics of Red Supergiants (IOP Publishing), 2514 [Google Scholar]
- Levesque, E. M., Massey, P., Plez, B., & Olsen, K. A. G. 2009, AJ, 137, 4744 [NASA ADS] [CrossRef] [Google Scholar]
- Liu, Z., Cui, W., Liu, C., et al. 2019, ApJS, 241, 32 [CrossRef] [Google Scholar]
- Longair, M. S. 2011, High Energy Astrophysics (Cambridge, UK: Cambridge University Press) [Google Scholar]
- Luna, G. J. M., Sokoloski, J. L., Mukai, K., & Nelson, T. 2013, A&A, 559, A6 [NASA ADS] [CrossRef] [EDP Sciences] [Google Scholar]
- Lutovinov, A., Tsygankov, S., Molkov, S., et al. 2021, ApJ, 912, 17 [Google Scholar]
- Marcu, D. M., Fürst, F., Pottschmidt, K., et al. 2011, ApJ, 742, L11 [NASA ADS] [CrossRef] [Google Scholar]
- Masetti, N., Parisi, P., Jiménez-Bailón, E., et al. 2012, A&A, 538, A123 [NASA ADS] [CrossRef] [EDP Sciences] [Google Scholar]
- McClintock, J. E., & Remillard, R. A. 2006, Black Hole Binaries, 39, 157 [Google Scholar]
- Merc, J., Gális, R., & Wolf, M. 2019, Astron. Nachr., 340, 598 [NASA ADS] [CrossRef] [Google Scholar]
- Merloni, A., Lamer, G., Liu, T., et al. 2024, A&A, 682, A34 [NASA ADS] [CrossRef] [EDP Sciences] [Google Scholar]
- Merloni, A., Predehl, P., Becker, W., et al. 2012, arXiv e-prints [arXiv:1209.3114] [Google Scholar]
- Messineo, M., Zhu, Q., Menten, K. M., et al. 2017, ApJ, 836, 65 [NASA ADS] [CrossRef] [Google Scholar]
- Messineo, M., Figer, D. F., Kudritzki, R.-P., et al. 2021, AJ, 162, 187 [NASA ADS] [CrossRef] [Google Scholar]
- Migkas, K., Kox, D., Schellenberger, G., et al. 2024, A&A, 688, A107 [NASA ADS] [CrossRef] [EDP Sciences] [Google Scholar]
- Mihara, T., Makishima, K., & Nagase, F. 1995, AAS Meeting Abstr., 187, 1040.03 [Google Scholar]
- Miszalski, B., Mikołajewska, J., & Udalski, A. 2013, MNRAS, 432, 3186 [NASA ADS] [CrossRef] [Google Scholar]
- Moon, T. T. 2008, JAAVSO, 36, 77 [NASA ADS] [Google Scholar]
- Müller, S., Ferrigno, C., Kühnel, M., et al. 2013, A&A, 551, A6 [NASA ADS] [CrossRef] [EDP Sciences] [Google Scholar]
- Munari, U., & Banerjee, D. P. K. 2018, MNRAS, 475, 508 [NASA ADS] [CrossRef] [Google Scholar]
- Negueruela, I., González-Fernández, C., Marco, A., & Clark, J. S. 2011, A&A, 528, A59 [NASA ADS] [CrossRef] [EDP Sciences] [Google Scholar]
- Neumann, M., Avakyan, A., Doroshenko, V., & Santangelo, A. 2023, A&A, 677, A134 [NASA ADS] [CrossRef] [EDP Sciences] [Google Scholar]
- Oh, K., Koss, M., Markwardt, C. B., et al. 2018, ApJS, 235, 4 [Google Scholar]
- Orio, M., Zezas, A., Munari, U., Siviero, A., & Tepedelenlioglu, E. 2007, ApJ, 661, 1105 [NASA ADS] [CrossRef] [Google Scholar]
- Pavlinsky, M., Tkachenko, A., Levin, V., et al. 2021, A&A, 650, A42 [EDP Sciences] [Google Scholar]
- Pavlinsky, M., Sazonov, S., Burenin, R., et al. 2022, A&A, 661, A38 [NASA ADS] [CrossRef] [EDP Sciences] [Google Scholar]
- Percy, J. R. 2007, Understanding Variable Stars (Cambridge University Press) [CrossRef] [Google Scholar]
- Pradhan, P., Bozzo, E., & Paul, B. 2018, A&A, 610, A50 [NASA ADS] [CrossRef] [EDP Sciences] [Google Scholar]
- Pradhan, P., Maitra, C., Paul, B., Islam, N., & Paul, B. C. 2014, MNRAS, 442, 2691 [Google Scholar]
- Predehl, P., Andritschke, R., Arefiev, V., et al. 2021, A&A, 647, A1 [EDP Sciences] [Google Scholar]
- Proga, D., Miko ajewska, J., & Kenyon, S. J. 1994, MNRAS, 268, 213 [NASA ADS] [CrossRef] [Google Scholar]
- Ramirez, S. V., Depoy, D. L., Frogel, J. A., Sellgren, K., & Blum, R. D. 1997, AJ, 113, 1411 [NASA ADS] [CrossRef] [Google Scholar]
- Reig, P. 2011, Ap&SS, 332, 1 [Google Scholar]
- Reig, P., Torrejón, J. M., Negueruela, I., et al. 2009, A&A, 494, 1073 [NASA ADS] [CrossRef] [EDP Sciences] [Google Scholar]
- Rodriguez, J., Tomsick, J. A., Foschini, L., et al. 2003, A&A, 407, L41 [NASA ADS] [CrossRef] [EDP Sciences] [Google Scholar]
- Romano, P., Sidoli, L., Cusumano, G., et al. 2009, MNRAS, 399, 2021 [NASA ADS] [CrossRef] [Google Scholar]
- Rouco Escorial, A., van den Eijnden, J., & Wijnands, R. 2018, A&A, 620, L13 [NASA ADS] [CrossRef] [EDP Sciences] [Google Scholar]
- Samus, N. N., Durlevich, O. V., & Kazarovets, E. V. 1997, Open Astron., 6, 296 [NASA ADS] [CrossRef] [Google Scholar]
- Samus’, N. N., Kazarovets, E. V., Durlevich, O. V., Kireeva, N. N., & Pastukhova, E. N. 2017, Astron. Rep., 61, 80 [Google Scholar]
- Saxton, R. D., König, O., Descalzo, M., et al. 2022, Astron.& Comput., 38, 100531 [NASA ADS] [CrossRef] [Google Scholar]
- Scargle, J. D. 1982, ApJ, 263, 835 [Google Scholar]
- Schlawin, E., Herter, T. L., Henderson, C., et al. 2014, in SPIE Conf. Ser., 9147, 91472H [NASA ADS] [Google Scholar]
- Serote Roos, M., Boisson, C., & Joly, M. 1996, A&AS, 117, 93 [NASA ADS] [CrossRef] [EDP Sciences] [Google Scholar]
- Shakura, N., Postnov, K., Kochetkova, A., & Hjalmarsdotter, L. 2012, MNRAS, 420, 216 [Google Scholar]
- Shakura, N. I., Postnov, K. A., Kochetkova, A. Y., et al. 2015, Astron. Rep., 59, 645 [NASA ADS] [CrossRef] [Google Scholar]
- Shakura, N., Postnov, K., Kochetkova, A., & Hjalmarsdotter, L. 2018, Accretion Flows in Astrophysics, Astrophysics and Space Science Library (Springer International Publishing AG), 454 [Google Scholar]
- Shao, Y. 2017, Acta Astron. Sin., 58, 41 [Google Scholar]
- Sidoli, L. 2013, PoS, INTEGRAL, 2012, 11 [Google Scholar]
- Sidoli, L., & Paizis, A. 2018, MNRAS, 481, 2779 [NASA ADS] [CrossRef] [Google Scholar]
- Sidoli, L., Ponti, G., Sguera, V., & Esposito, P. 2023, A&A, 671, A150 [NASA ADS] [CrossRef] [EDP Sciences] [Google Scholar]
- Skinner, C. J., & Whitmore, B. 1988, MNRAS, 235, 603 [NASA ADS] [CrossRef] [Google Scholar]
- Slettebak, A. 1988, PASP, 100, 770 [NASA ADS] [CrossRef] [Google Scholar]
- Sokolova-Lapa, E., Gornostaev, M., Wilms, J., et al. 2021, A&A, 651, A12 [NASA ADS] [CrossRef] [EDP Sciences] [Google Scholar]
- Staubert, R., Trümper, J., Kendziorra, E., et al. 2019, A&A, 622, A61 [NASA ADS] [CrossRef] [EDP Sciences] [Google Scholar]
- Stencel, R. E., Pesce, J. E., & Hagen Bauer, W. 1987, in Cool Stars, Stellar Systems, and the Sun, eds. J. L. Linsky, & R. E. Stencel (Berlin, Heidelberg: Springer), 380 [NASA ADS] [CrossRef] [Google Scholar]
- Tanaka, Y. 1986, in Radiation Hydrodynamics in Stars and Compact Objects, eds. K. H. Winkler, & D. Mihalas (New York, Heidelberg: Springer), 198 [NASA ADS] [CrossRef] [Google Scholar]
- Tauris, T. M., & van den Heuvel, E. P. 2023, 10. Formation and Evolution of High-mass X-ray Binaries (Princeton University Press), 376 [Google Scholar]
- Torrejón, J. M., Kreykenbohm, I., Orr, A., Titarchuk, L., & Negueruela, I. 2004, A&A, 423, 301 [NASA ADS] [CrossRef] [EDP Sciences] [Google Scholar]
- Torres, M. A. P., Jonker, P. G., Miller-Jones, J. C. A., et al. 2015, MNRAS, 450, 4292 [NASA ADS] [CrossRef] [Google Scholar]
- Truemper, J., Pietsch, W., Reppin, C., et al. 1978, ApJ, 219, L105 [CrossRef] [Google Scholar]
- Tsygankov, S. S., Mushtukov, A. A., Suleimanov, V. F., et al. 2017a, A&A, 608, A17 [NASA ADS] [CrossRef] [EDP Sciences] [Google Scholar]
- Tsygankov, S. S., Wijnands, R., Lutovinov, A. A., Degenaar, N., & Poutanen, J. 2017b, MNRAS, 470, 126 [Google Scholar]
- Tsygankov, S. S., Doroshenko, V., Mushtukov, A. A., et al. 2019, MNRAS, 487, L30 [NASA ADS] [CrossRef] [Google Scholar]
- Tueller, J., Gehrels, N., Mushotzky, R. F., et al. 2005, ATel, 591, 1 [NASA ADS] [Google Scholar]
- Ubertini, P., Lebrun, F., Di Cocco, G., et al. 2003, A&A, 411, L131 [CrossRef] [EDP Sciences] [Google Scholar]
- van der Klis, M. 1994, ApJ, 92, 511 [NASA ADS] [Google Scholar]
- Varun, Iyer N., & Paul, B., 2023, New Astron., 98, 101942 [NASA ADS] [CrossRef] [Google Scholar]
- Verner, D. A., Ferland, G. J., Korista, K. T., & Yakovlev, D. G. 1996, ApJ, 465, 487 [Google Scholar]
- Vernet, J., Dekker, H., D’Odorico, S., et al. 2011, A&A, 536, A105 [NASA ADS] [CrossRef] [EDP Sciences] [Google Scholar]
- Verro, K., Trager, S. C., Peletier, R. F., et al. 2022, A&A, 660, A34 [NASA ADS] [CrossRef] [EDP Sciences] [Google Scholar]
- Voges, W., Aschenbach, B., Boller, T., et al. 1999, A&A, 349, 389 [NASA ADS] [Google Scholar]
- Walter, R., Rodriguez, J., Foschini, L., et al. 2003, A&A, 411, L427 [NASA ADS] [CrossRef] [EDP Sciences] [Google Scholar]
- White, N. E., Mason, K. O., Huckle, H. E., Charles, P. A., & Sanford, P. W. 1976a, ApJ, 209, L119 [NASA ADS] [CrossRef] [Google Scholar]
- White, N. E., Mason, K. O., Sanford, P. W., & Murdin, P. 1976b, MNRAS, 176, 201 [NASA ADS] [Google Scholar]
- Wilms, J., Allen, A., & McCray, R. 2000, ApJ, 542, 914 [Google Scholar]
- Winkler, C., Pace, O., & Volonté, S. 1993, ESA J., 17, 207 [NASA ADS] [Google Scholar]
- Wit, W. J. d., Oudmaijer, R. D., & Vink, J. S. 2014, Adv. Astron., 2014, 270848 [CrossRef] [Google Scholar]
- Wood, P. R. 1990, ASP Conf. Ser., 11, 355 [NASA ADS] [Google Scholar]
- XRISM Science Team, 2020, arXiv e-prints [arXiv:2003.04962] [Google Scholar]
- Xu, Y., Harrison, F. A., Tomsick, J. A., et al. 2019, ApJ, 879, 93 [NASA ADS] [CrossRef] [Google Scholar]
- Yao, Y., Liu, C., Deng, L., De Grijs, R., & Matsunaga, N. 2017, ApJS, 232, 16 [NASA ADS] [CrossRef] [Google Scholar]
- Yungelson, L., Kuranov, A., & Postnov, K. 2019, MNRAS, 485, 851 [NASA ADS] [CrossRef] [Google Scholar]
- Zalot, N., Sokolova-Lapa, E., Stierhof, J., et al. 2024, A&A, 686, A95 [NASA ADS] [CrossRef] [EDP Sciences] [Google Scholar]
- Zurita Heras, J. A., De Cesare, G., Walter, R., et al. 2006, A&A, 448, 261 [NASA ADS] [CrossRef] [EDP Sciences] [Google Scholar]
All Tables
Observing log of the four eROSITA snapshots of J085039 and the follow-up observation obtained by NuSTAR.
Equivalent widths of spectral lines obtained from the X-shooter spectra, as well as other diagnostics.
Spectral parameters for different models used to fit the eROSITA and NuSTAR spectra, with 2σ confidence intervals.
All Figures
|
Fig. 1. Infrared view of the optical counterpart from the Two Micron All Sky Survey (2MASS; Cutri et al. 2003), with 2MASS (Cutri et al. 2003), NuSTAR (Harrison et al. 2013), and eRASS1 (Merloni et al. 2024) error circles indicated in green, red, and blue, respectively. The star is located |
| In the text | |
|
Fig. 2. 3–10 keV X-ray flux from each observation of J085039 as a functin of time, corrected for absorption. The eROSITA fluxes are displayed at the start time of each scan. The third eROSITA observation was only four days prior to the pointed NuSTAR observation. The NuSTAR flux is brighter by a factor ∼2, which might indicate slight source-intrinsic variability, even when taking into account eROSITA’s known calibration uncertainties (Migkas et al. 2024). The observation times of the optical observations from X-shooter are marked by gray dashed lines as O1 and O2. |
| In the text | |
|
Fig. 3. De-reddened X-shooter spectra of the optical counterpart. Observation 2 shows an increase in flux with stronger emission lines. Prominent features include the Balmer series, several He I and Fe II lines, and TiO and CO absorption bands. Telluric regions are greyed out. |
| In the text | |
|
Fig. 4. 8300–9000 Å region of the NIR spectrum. Several key absorption lines used for classification of the donor star are indicated here. |
| In the text | |
|
Fig. 5. (a) Hα line as seen in both X-shooter spectra, normalised for comparison. The second observation shows a stronger and single-peaked line profile, compared to an asymmetric line profile in the first data set. The asymmetry is likely due to the contribution of He IIλ6560, also being in emission. (b) He IIλ4686 and He Iλ4713 are in emission, in both X-shooter spectra, but without as much variability. We normalised the two spectral continua relative to each other to compare the behaviour of the emission lines. |
| In the text | |
|
Fig. 6. Comparison of the de-reddened X-shooter spectra of the optical counterpart to J085039 with spectra of a variety of late type stars, obtained from the X-shooter spectral library. Although the K-type supergiant has some absorption lines in common with that of UCAC2 13726137, the latter’s overall shape seems to agree better with the M-type supergiant, in addition to the presence of TiO bands. Of special intrigue is the remarkable similarity in spectral shape and presence of the same emission lines in the Mira variable. |
| In the text | |
|
Fig. 7. ASAS-SN light curve of J085039. The light curve displays a semi-periodic variable behaviour. |
| In the text | |
|
Fig. 8. 100s binned light curve of J085039. The light curve shows barely any variability within uncertainties. |
| In the text | |
|
Fig. 9. Epoch-folded periodogram of barycentred event file from NuSTAR’s FPMA detector. The signal around ∼5800 s is most likely an effect of NuSTAR’s orbital period. |
| In the text | |
|
Fig. 10. NuSTAR and eROSITA spectra of J085039 from FPMA (teal) and FPMB (peach) fitted with three different models. The folded and unfolded models with individual model components are shown in panels (a) and (b), respectively. The χ2-residuals are shown for (c) Model 1a (M1a), the high-energy cutoff, (d) M1b, the high-energy cut-off including a partial absorber, and (e) M1c, the high-energy cutoff including an ionised absorber. |
| In the text | |
|
Fig. 11. X-ray spectrum eRASSU J085039 (teal) shown along with NuSTAR spectra of a few other HMXBs for comparison: X Persei, a persistent BeXRB displaying low luminosity accretion in yellow (Doroshenko et al. 2012), two SgXBs 4U 1700−37 in grey (Bala et al. 2020), and 4U 1538+22 in blue (Hemphill et al. 2019), a SyXB IGR J17329−2731 in red (Bozzo et al. 2018), the persistent, albeit brighter wind-accretor GX 301−2 in light green (Islam & Paul 2014; Zalot et al. 2024), and the SFXT IGR J16418−4532 in purple (Islam et al. 2023). FPMA and FPMB spectra have been illustrated using different shades of the same colour. The strong iron line in J085039 is comparable to that of the obscured systems and one of the SyXBs. These spectra each correspond to luminosities of 1035 erg s, with the exception of GX 301−2, which is brighter by a factor of ∼10. |
| In the text | |
Current usage metrics show cumulative count of Article Views (full-text article views including HTML views, PDF and ePub downloads, according to the available data) and Abstracts Views on Vision4Press platform.
Data correspond to usage on the plateform after 2015. The current usage metrics is available 48-96 hours after online publication and is updated daily on week days.
Initial download of the metrics may take a while.